NVIDIA's revenue doubles, beating expectations; is the AI trade narrative making a comeback?

Jensen Huang labels AI as "national infrastructure" at G20; will NVIDIA raise its guidance again?
$NVIDIA (NVDA.US)$ The stock surged over 8% in a single day following the earnings release, but has failed to sustain this strong momentum recently,showing signs of high-level consolidation.
Recently, JPMorgan cited NVIDIA management's comments at a recent institutional investor conference: the framework for 70% year-over-year growth in FY2028is a conservative estimate under current capacity constraints, rather than the true ceiling of demand.—If supply of advanced wafers and HBM is sufficient,actual growth has the potential to exceed 100%.The core significance of this statement lies intransforming the market's long-term pricing risk regarding demand-side uncertainty into solvable supply-side constraints.During the same period,CEO Jensen Huang announced at the G20 Summit that "NVIDIA will invest nearly $1 trillion in U.S. infrastructure this year",and in discussions with the U.S. Secretary of Commerce, explicitly defined AI as"national infrastructure on par with water and electricity"—leading to a repricing of the rigidity and sustainability of AI computing demand. On September 2, NVIDIA shares rose 3.21% in response.
Recent stock price movement
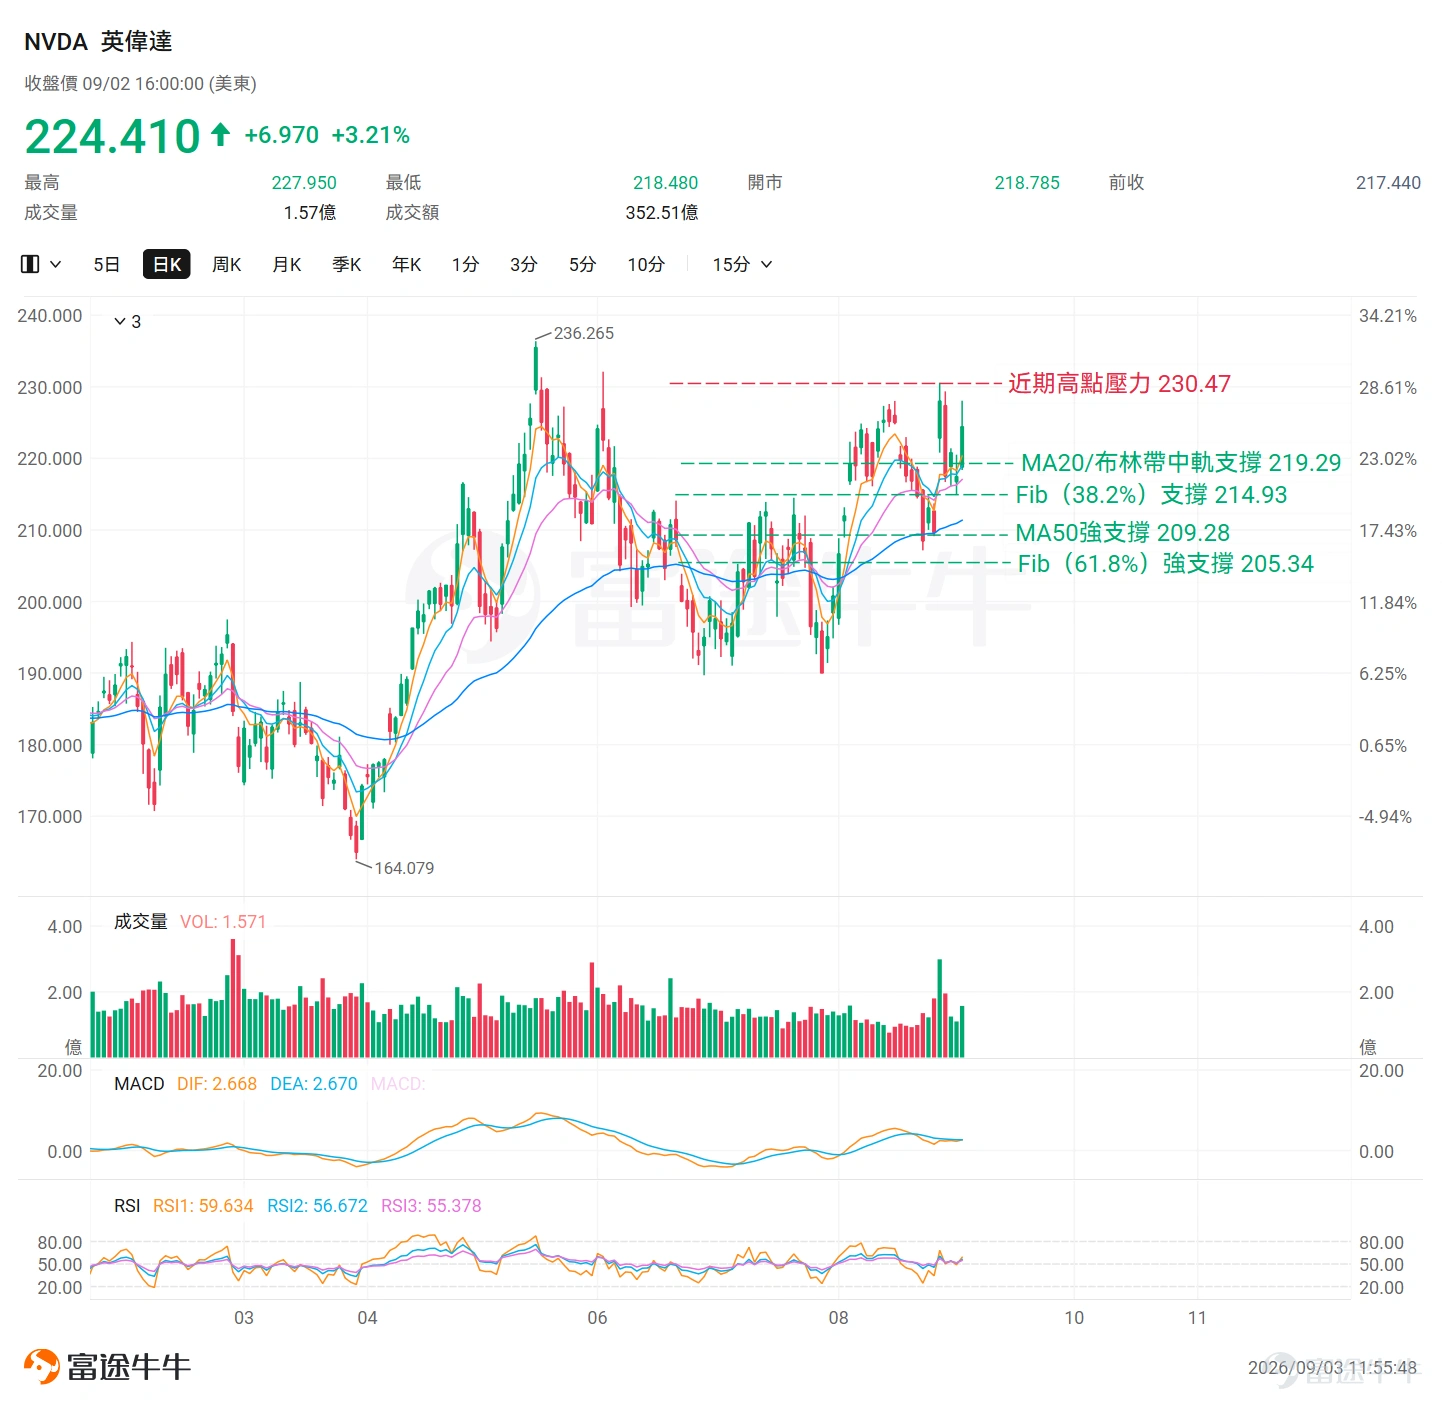
As mentioned at the outset, regarding the overall trend, NVIDIA is currentlymaintaining a short-term uptrend while facing pressure for consolidation at high levels.The stock price continues to hold above the 60-day EMA, confirming that it remains in a technical bull market zone. There is significant resistance in the $229–$230 range, where bears have mounted strong defense at these highs. Whether this resistance zone can be effectively broken through is a key factor to watch for future market direction.
Key Technical Indicator Analysis
EMA Moving Averages:EMA5 = $220.33, EMA10 = $218.97, EMA20 = $217.05, EMA60 = $211.36. A complete bullish alignment is present, with a sound trend structure.
RSI:56.67, indicating strength within the neutral zone, with no overbought pressure, no bearish divergence signals, and momentum not yet exhausted.
MACD:The MACD line (2.668) is slightly below the Signal line (2.67), having just formed a bearish crossover, but both remain above the zero axis. The histogram has shifted from positive to slightly negative, with no obvious divergence.
Bollinger Bands:The latest closing price of $224.41 is positioned in the upper half between the middle band ($219.29) and the upper band ($229.71), indicating a state of normal expansion.
Fibonacci:The current stock price of $224.41 is above the 23.6% Fibonacci retracement level ($220.87). For downside support, key attention should be paid to the 38.2% ($214.93) and 61.8% ($205.34) levels.
* Fibonacci retracement levels are automatically calculated based on the highest and lowest prices over the past 60 trading days, not manually selected swing points. Actual support/resistance effectiveness should be confirmed by market price action
Comprehensive assessment
Regarding key support,The 23.6% Fibonacci retracement level at $220.87 serves as the first short-term support level;if this level is breached,Attention should then shift to the double support level at $219.29, formed by the 20-day moving average (MA20) and the middle band of the Bollinger Bands; the next key medium-term defense level lies at $209.28, where the 50-day moving average (MA50) is located.On the upside, resistance lies atKeep a close watch on the area near the recent high of $230.47,a breakout will open up greater upside potential.

Risk Disclaimer: The above content only represents the author's view. It does not represent any position or investment advice of Futu. Futu makes no representation or warranty.Read more

Comment (1)
to post a comment
28
19