Tesla Roadster release date set: Could this serve as another catalyst for the stock price?

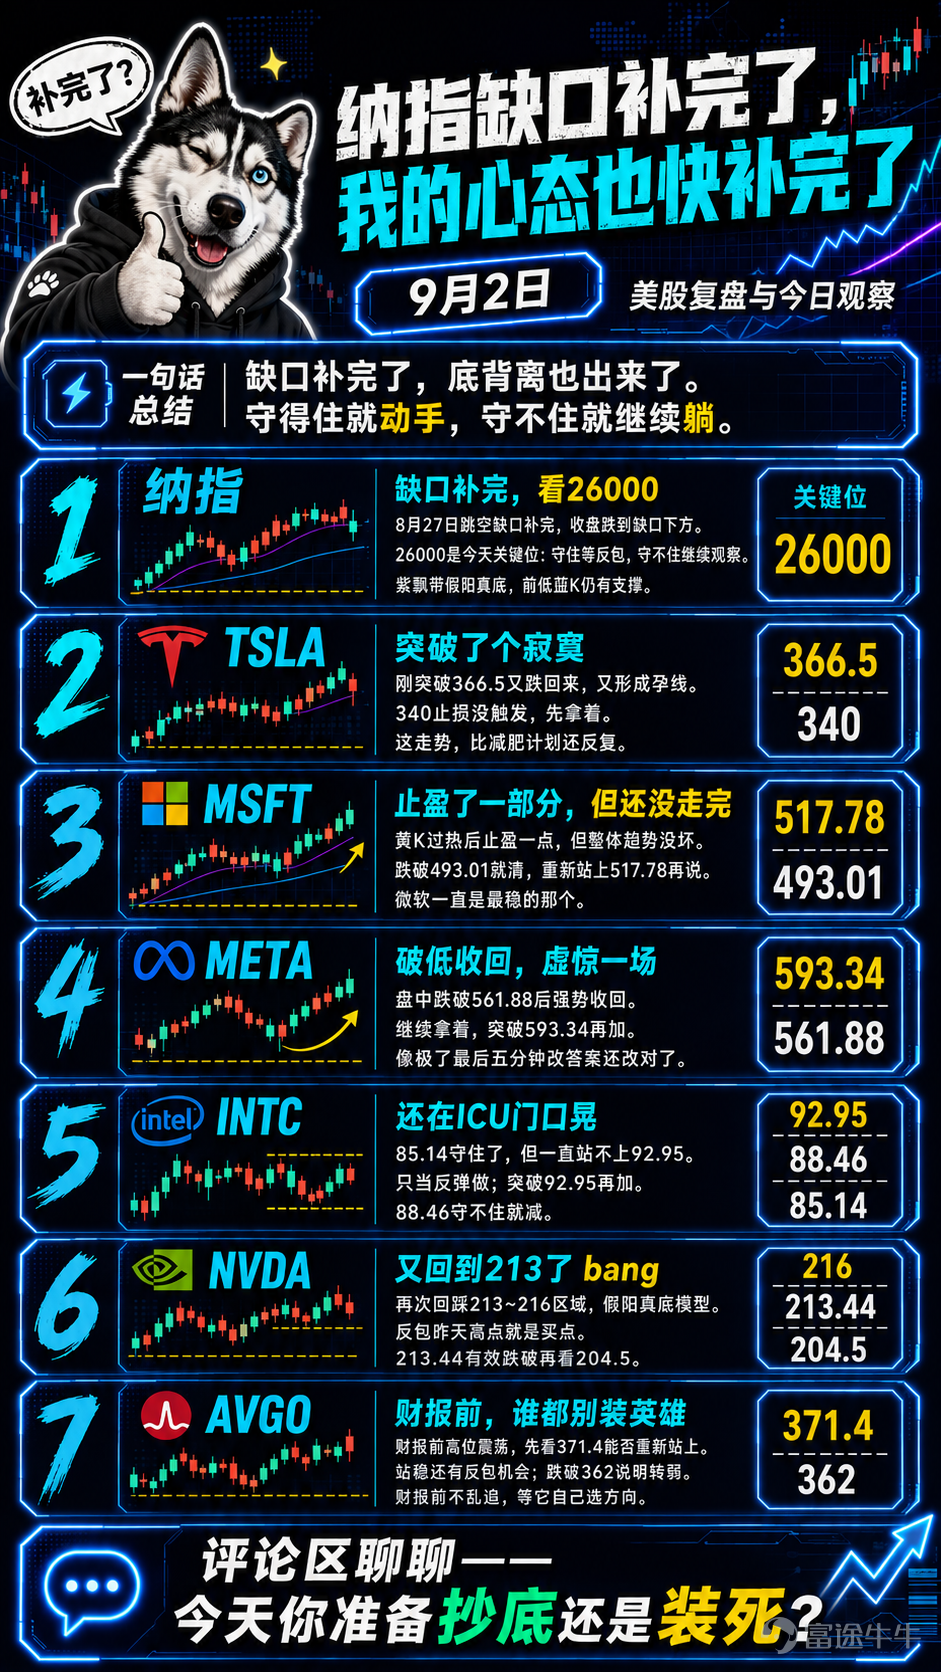
[Husky's Pre-Market Briefing — September 2] The Nasdaq has fully filled its gap, and my sanity is nearly restored.
The three major indices continued to weaken yesterday. The gap from August 27 on the Nasdaq was finally filled, with the close ending below the gap level. Looking at my account is indeed uncomfortable. However, despite opening lower, it closed with a bullish candle. The 'Purple Ribbon' pattern suggests a false bullish candle masking a true bottom. Support remains at the previous low (blue candle), and the weekly chart hasn't deteriorated. I can only tell myself: this is a second retest on the daily chart, not the end of the world.Today, watch whether 26,000 can hold.If it holds and forms a bullish engulfing pattern, I'll take action; if it fails to hold and continues to drop, I'll stay put.
TSLA: A breakout that amounted to nothing. $Tesla (TSLA.US)$
It just broke above 366.5 yesterday, but fell back today, forming a harami pattern again. The stop-loss at 340 wasn't triggered, so I'm holding for now. Tesla's price action is more volatile than my diet plan.
MSFT: Took some profits, but the trade isn't over yet. $Microsoft (MSFT.US)$
I took some profits after the yellow candle indicated overheating, but the overall trend remains intact. Continue holding; clear the position if it falls below 493.01, and reconsider if it reclaims 517.78. Microsoft has always been the steadiest performer, so I'm not panicked.
META: Broke the low but recovered; a false alarm. $Meta Platforms (META.US)$
Yesterday, the price dipped below 561.88 during intraday trading but staged a strong recovery, forming a 'break-low-and-recover' structure. The expectation of a weekly bottom remains valid. Hold your positions; add more only if it breaks above 593.34. Meta's recent move was like changing your answers in the last five minutes of an exam and getting them right.
INTC: Still hovering at the doors of the ICU. $Intel (INTC.US)$
It held support at 85.14 but failed to sustain levels above 92.95. Treat this as a rebound trade only; add positions only on a breakout above 92.95, and reduce holdings if it fails to hold 88.46. Intel, can you please show some strength?
NVDA: Back to 213 again. $NVIDIA (NVDA.US)$
Yesterday, it retested the purple moving average band and the 213–216 zone, forming a 'fake bullish candle, real bottom' pattern. A bullish engulfment of yesterday's high would be a buy signal. The weekly chart remains intact; watch for 204.5 only if the daily close decisively breaks below 213.44. I am waiting for a clear buy entry.
AVGO: Before earnings, don't try to play the hero. $Broadcom (AVGO.US)$
While the broader market was green (down) yesterday, AVGO showed resilience, dipping to a low of 362 before rallying back to 369.68. In the short term, it continues to consolidate at high levels. With earnings due tonight, even a beautiful technical setup must take a backseat to the fundamental report. First, watch whether it can reclaim and hold above 371.4; doing so would keep the opportunity for a short-term bullish engulfment alive. The level of 362 marks yesterday's low; a break below suggests that its recent resilience may have been merely forced support. I won't chase the price before earnings; I'll wait for it to choose a direction.
One-Sentence Summary
The gap has been filled, and bullish divergence has emerged. If support holds, take action; if not, stay on the sidelines.
Let's chat in the comments—are you planning to buy the dip or play dead today? 🤫
Risk Disclaimer: The above content only represents the author's view. It does not represent any position or investment advice of Futu. Futu makes no representation or warranty.Read more


Comments
to post a comment
5