US-Iran tensions flare up again: How will Strait risks impact assets?

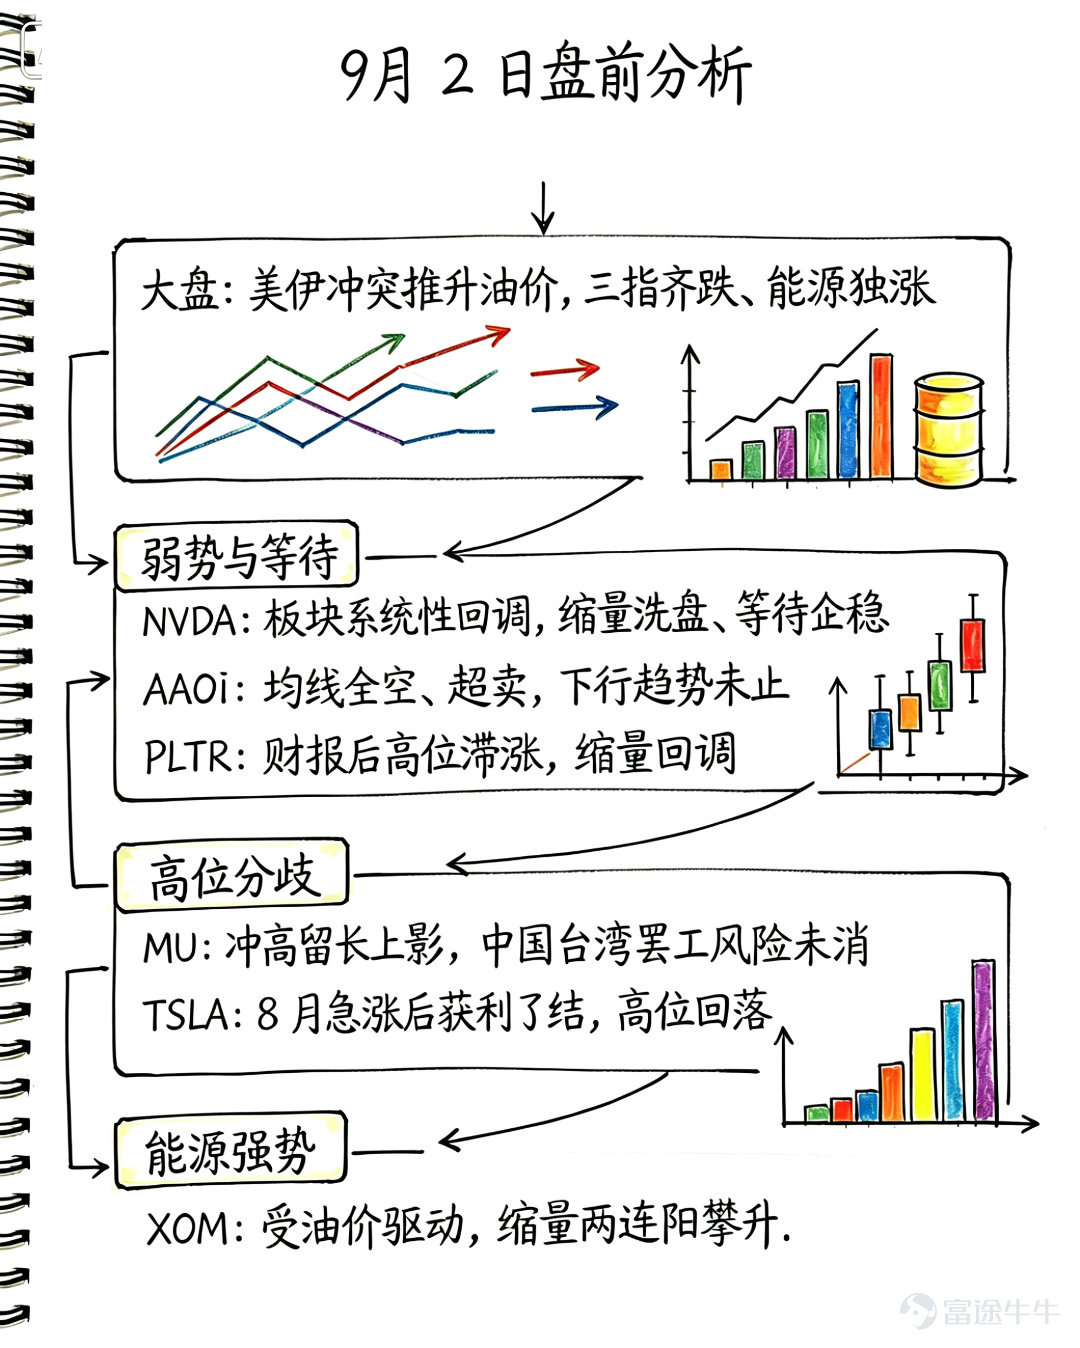
9/2 US Market Preview: Geopolitical tensions ignite oil prices; growth stocks under pressure, energy sector rises alone
9/1 The three major indices closed lower collectively, $Dow Jones Industrial Average (.DJI.US)$ the Dow Jones fell 0.79%, $S&P 500 Index (.SPX.US)$ the S&P500fell 0.71%, $Nasdaq Composite Index (.IXIC.US)$ the Nasdaq fell 1.03%, $PHLX Semiconductor Index (.SOX.US)$ and the Philadelphia Semiconductor Index fell 2.14%. The core variable isthe sudden escalation of US-Iran tensions (US military strikes on targets linked to Iran's Revolutionary Guard Corps, reigniting risks in the Strait of Hormuz), which pushed up oil prices and long-end interest rates, compounded by expectations of a Fed rate hike in September.Structurally, energy was the only sector to close higher (XOM +2.24%, CVX +2.38%, COP +2.79%). Apple (+2.61%) moved independently (Cook handing over to Ternus), while tech and semiconductors broadly declined. This represents a macro-driven structural correction, not negative news specific to any single company.
NVIDIA (NVDA)
Market Recap:Closed at $217.44 on Sep 1, down 1.51%. After opening higher at $216.75 and surging to a high of $220.41, it pulled back, fluctuating within the $215.10–$220.41 range for the rest of the day. This represents a consolidation phase following the heavy-volume rally to the $227.98 peak on Aug 27. The decline was not driven by company-specific negative news, but rather by systematic weakness in the semiconductor sector (SOX -2.14%).
Technical Analysis:Moving averages are converging and acting as resistance: MA5 ($218.68) and MA20 ($219.03) are nearly overlapping and slightly above the closing price, forming a short-term pressure zone at $218–$219. While a bearish crossover has not yet occurred, the trend is weakening; MA60 ($208.52) provides strong support. The price sits below MA5/MA20 and near the Bollinger Band middle track at $219, with the flattening middle track suggesting ongoing consolidation without a clear direction. MACD shows green bars below the zero line at -0.76, with DIF/DEA converging pending a move; KDJ's J-value is 55.7, trending downward from the midpoint; RSI6 is 49.6, indicating neutral-to-weak momentum. Volume on Sep 1 was 109.8 million shares, shrinking significantly compared to the record volume on Aug 27, suggesting this pullback on lower volume is a shakeout.
Trend Forecast: Expect continued oscillation within the $214–$221 range over the next 1–2 days. Direction depends on whether the price can reclaim the short-term moving averages. If it stabilizes above $219–$221 with increased volume, it would confirm the end of the correction, targeting the upper Bollinger Band at $229 and potentially filling the Aug 27 gap. If it fails to regain these levels, it will likely grind out a bottom in the $215–$219 range.
Micron Technology MU
Market Review: Opened higher at $941.13 on Sep 1, spiked to $969.44, then fell sharply to close at $933.44, down 2.64%, leaving a long upper shadow and a medium-sized bearish candle. This nearly erased the previous day's +2.77% gain. Turnover reached approximately $26.1 billion, ranking among the highest in the market, reflecting intense bullish-bearish contention at high levels.
Risks: The union at the Taiwan facility (accounting for ~60% of global capacity) has 80% support for a strike, with mediation scheduled for September. Hyperscalers have locked in $22 billion worth of capacity. The earnings window is around Sep 30.
Technical analysis: Short-to-medium term moving averages show a bullish arrangement but lack stability. MA5 ($939.76) crossed above MA20 ($929.37), forming a golden cross for short-term bullishness. However, the close at $933 fell below MA5 and remains well below MA60 ($959.08), presenting a divergence repair structure where the price floats above MA5/MA20 but below MA60. $960 serves as the key pivot between bulls and bears. MACD red bars (above zero axis) indicate remaining bullish momentum, though the bars are contracting. KDJ's J-value is 50.96 (mid-range); RSI6 is 47.83 (neutral). Bollinger Bands show a middle track at $929.37 and an upper track at $1007.48; the price is above the middle track, and the band width is not tightening. The combination of a long upper shadow and record high volume suggests heavy selling pressure around the $970 level.
Trend Forecast: Expect oscillation and repair within the $929–$960 range over the next 1–2 days. If it stabilizes above $939 with moderate volume increase, it could target $959–$960. A break below $929 would lead to a retest of $908. The bias is bullish but requires breakout confirmation; news of the Taiwan strike is the biggest short-term disruptor.
Tesla (TSLA)
Market Review: Opened higher at $360.90 on Sep 1, spiked to $362.70, then pulled back to close at $356.09, down 3.22%, ending the consecutive gains from Aug 31 (+5.51%). This reflects profit-taking after an 18% cumulative gain in August, combined with de-risking ahead of the Cybercab launch on Sep 3.
Technical analysis: Moving averages are in a bullish alignment. MA5 ($354.68) crossed above MA20 ($342.55), forming a golden cross for short-term bullishness. MA60 ($365.88) acts as overhead resistance. The price stands above MA5/MA20 and hugs the upper Bollinger Band at $368.88 (middle track at $342.55). The bullish structure remains intact but is approaching the upper channel boundary. MACD red bars are expanding at +7.46, with DIF above the zero axis. KDJ is around 66, high but not overbought. RSI6 is 54.9, indicating neutral-to-strong momentum. Volume/Price: Sep 1 turnover was 36.19 million shares. The spike and pullback left an upper shadow, indicating profit-taking pressure in the $362–$370 zone.
Trend Forecast: Expect strong oscillation in the $354–$368 range over the next 1–2 days. Holding above $354 maintains the bullish structure, allowing for accumulation before attacking $368–$370 again. A breakout on increased volume could target $380. The trend is strong, but chasing highs offers low risk-reward value.
Applied Optoelectronics (AAOI)
Market Review: On Sep 1, the stock closed lower with shrinking volume at 103.39, down 3.99%. It tested the lower boundary of the 101–103 support zone (daily low of 101.23; multiple supports at the Aug 24 low of 102.1). Although YTD gains stand at +196.59%, the price has retreated from highs, dropping 41.59% over the past 60 days.
Technical analysis: Moving averages are in a full bearish alignment—MA5 (108.87), MA10 (114.12), MA20 (125.08), and MA60 (129.08) are all above the closing price, with MA5 < MA10 < MA20 < MA60. The price is tracking along the lower Bollinger Band, with rebounds repeatedly capped by short-term moving averages. MACD is at -5.47, indicating bearish momentum below the zero line; KDJ's J-value is 2.66, signaling oversold conditions; RSI6 is at 30.6, approaching oversold territory. Bollinger Bands: lower band at 96.44, upper band at 153.71. While severely oversold, the downtrend remains intact, and any rebound is likely technical in nature.
Trend Forecast: Over the next 1–2 days, expect weak consolidation between 101 and 110, as the downtrend has not reversed. Holding 101 could trigger an oversold bounce toward 108–110; a break below 101 may lead to a test of 96. Oversold conditions do not equal a bottom; the strength of any rebound depends on trading volume.
Palantir PLTR
Market Review: On Sep 1, it opened higher at 182.98 and surged to 186.55 before falling sharply to close below 180 at 179.92, down 3.47%. On Aug 31, it stagnated with a mere +0.05% gain. Following the August earnings report, the cumulative 50% rally began to see profit-taking on shrinking volume, while ARK's reduction of its position on Aug 31 unsettled market sentiment.
Technical analysis: Moving averages show a bullish trend but are converging at high levels—MA5 (183.20) and MA10 (179.37) are hugging the closing price. MA20 (174.92) serves as initial support, while MA60 (143.50) provides strong support. The price has broken below MA5 but remains above MA10 and MA20; the bullish structure is intact, though short-term momentum is weakening. MACD is at -0.778 with green bars below the zero line, and DIF has crossed below DEA, showing slight bearish divergence. KDJ is around 72, retreating from overbought saturation. RSI6 is neutral at 53.5. Bollinger Bands: upper band at 190.39, middle band at 174.92. The price has pulled back from highs to sit above the middle band, with narrowing bandwidth suggesting an impending shift in trend.
Trend Forecast: Over the next 1–2 days, expect high-level consolidation between 175 and 186. Holding firmly above 175 will sustain bullish momentum, building energy for another attempt at 186. A breakout on heavy volume could target 188–190; holding above 190 would open up new upside potential.
Exxon Mobil XOM
Market Review: On Sep 1, it formed a medium-sized bullish candle near the day's high, with a volume ratio of 0.75 (shrinking volume), closing at 164.55, up 2.24%. With consecutive bullish candles on Aug 31 and Sep 1, it was the sole core beneficiary rising amid a broad market decline, driven by rising oil prices due to US-Iran tensions (WTI crude up 5.2% to 90.22).
Technical analysis: Moving averages are in a bullish alignment—MA5 (159.37), MA10 (161.76), MA20 (159.70), and MA60 (149.60) are all below the closing price. However, there are concerns about momentum divergence: MACD is at -1.09 below the zero line without a golden cross (price rose while MACD remained negative, indicating repair of bearish divergence); KDJ's J-value is 49, trending upward from the midpoint; RSI6 is at 66.5, approaching overbought territory. Bollinger Bands: upper band at 168.68, middle band at 159.70. The price is pressing against the upper band, with expanding bandwidth; the upper band near 168 acts as short-term target and resistance. Volume-Price analysis: Price rose on shrinking volume, indicating weak willingness among funds to chase higher prices.
Trend ForecastOver the next 1–2 days, expect a bullish bias in the 162–168 range, with oil prices serving as the key driver. If geopolitical tensions escalate and oil prices continue to rise, a firm hold above 164 could target the upper Bollinger Band at 168; a breakout would open the path to 170+. A short squeeze on shrinking volume requires confirmation from oil price movements.
Disclaimer:The above content is based on public data and quantitative analysis and is for reference only; it does not constitute investment advice. The market involves risks, so invest with caution. Any investment decision should be made independently based on personal risk tolerance, financial status, and investment objectives, consulting licensed professional institutions when necessary. Past performance does not indicate future returns.

Content Disclosure: Personal opinion
Risk Disclaimer: The above content only represents the author's view. It does not represent any position or investment advice of Futu. Futu makes no representation or warranty.Read more


Comment (1)
to post a comment
3