US-Iran tensions flare up again: How will Strait risks impact assets?

9/1 US Market Outlook: US-Iran tensions drive up oil prices; AI theme shows localized activity
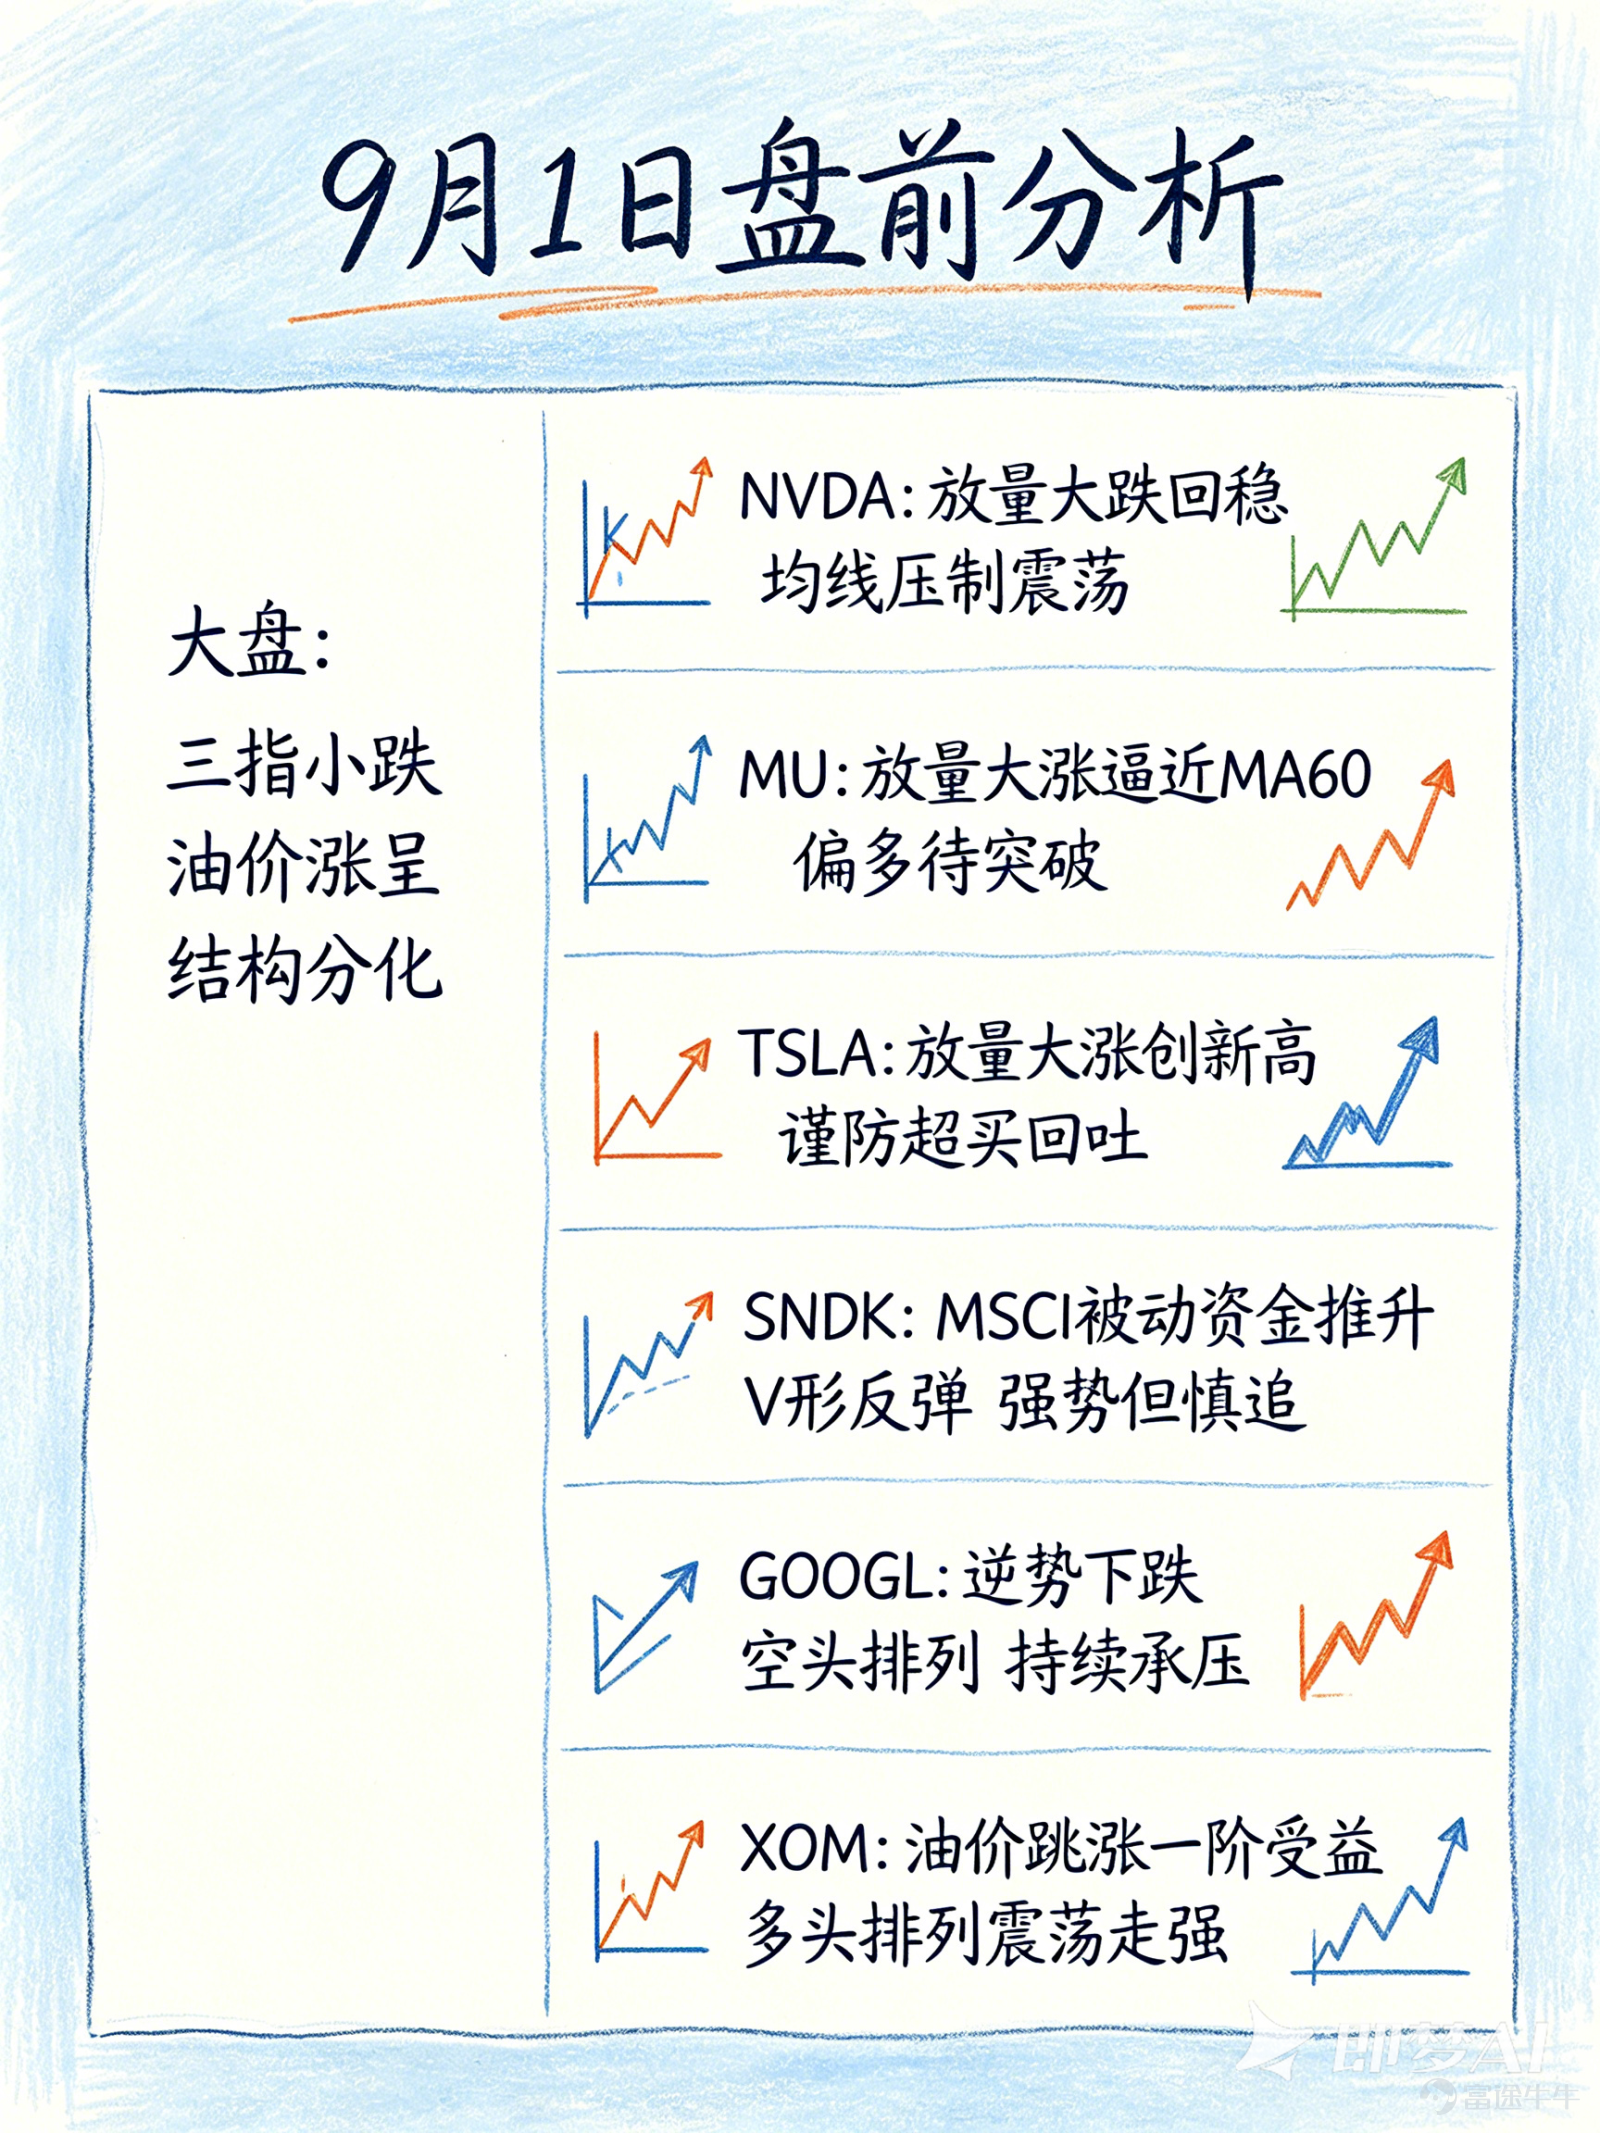
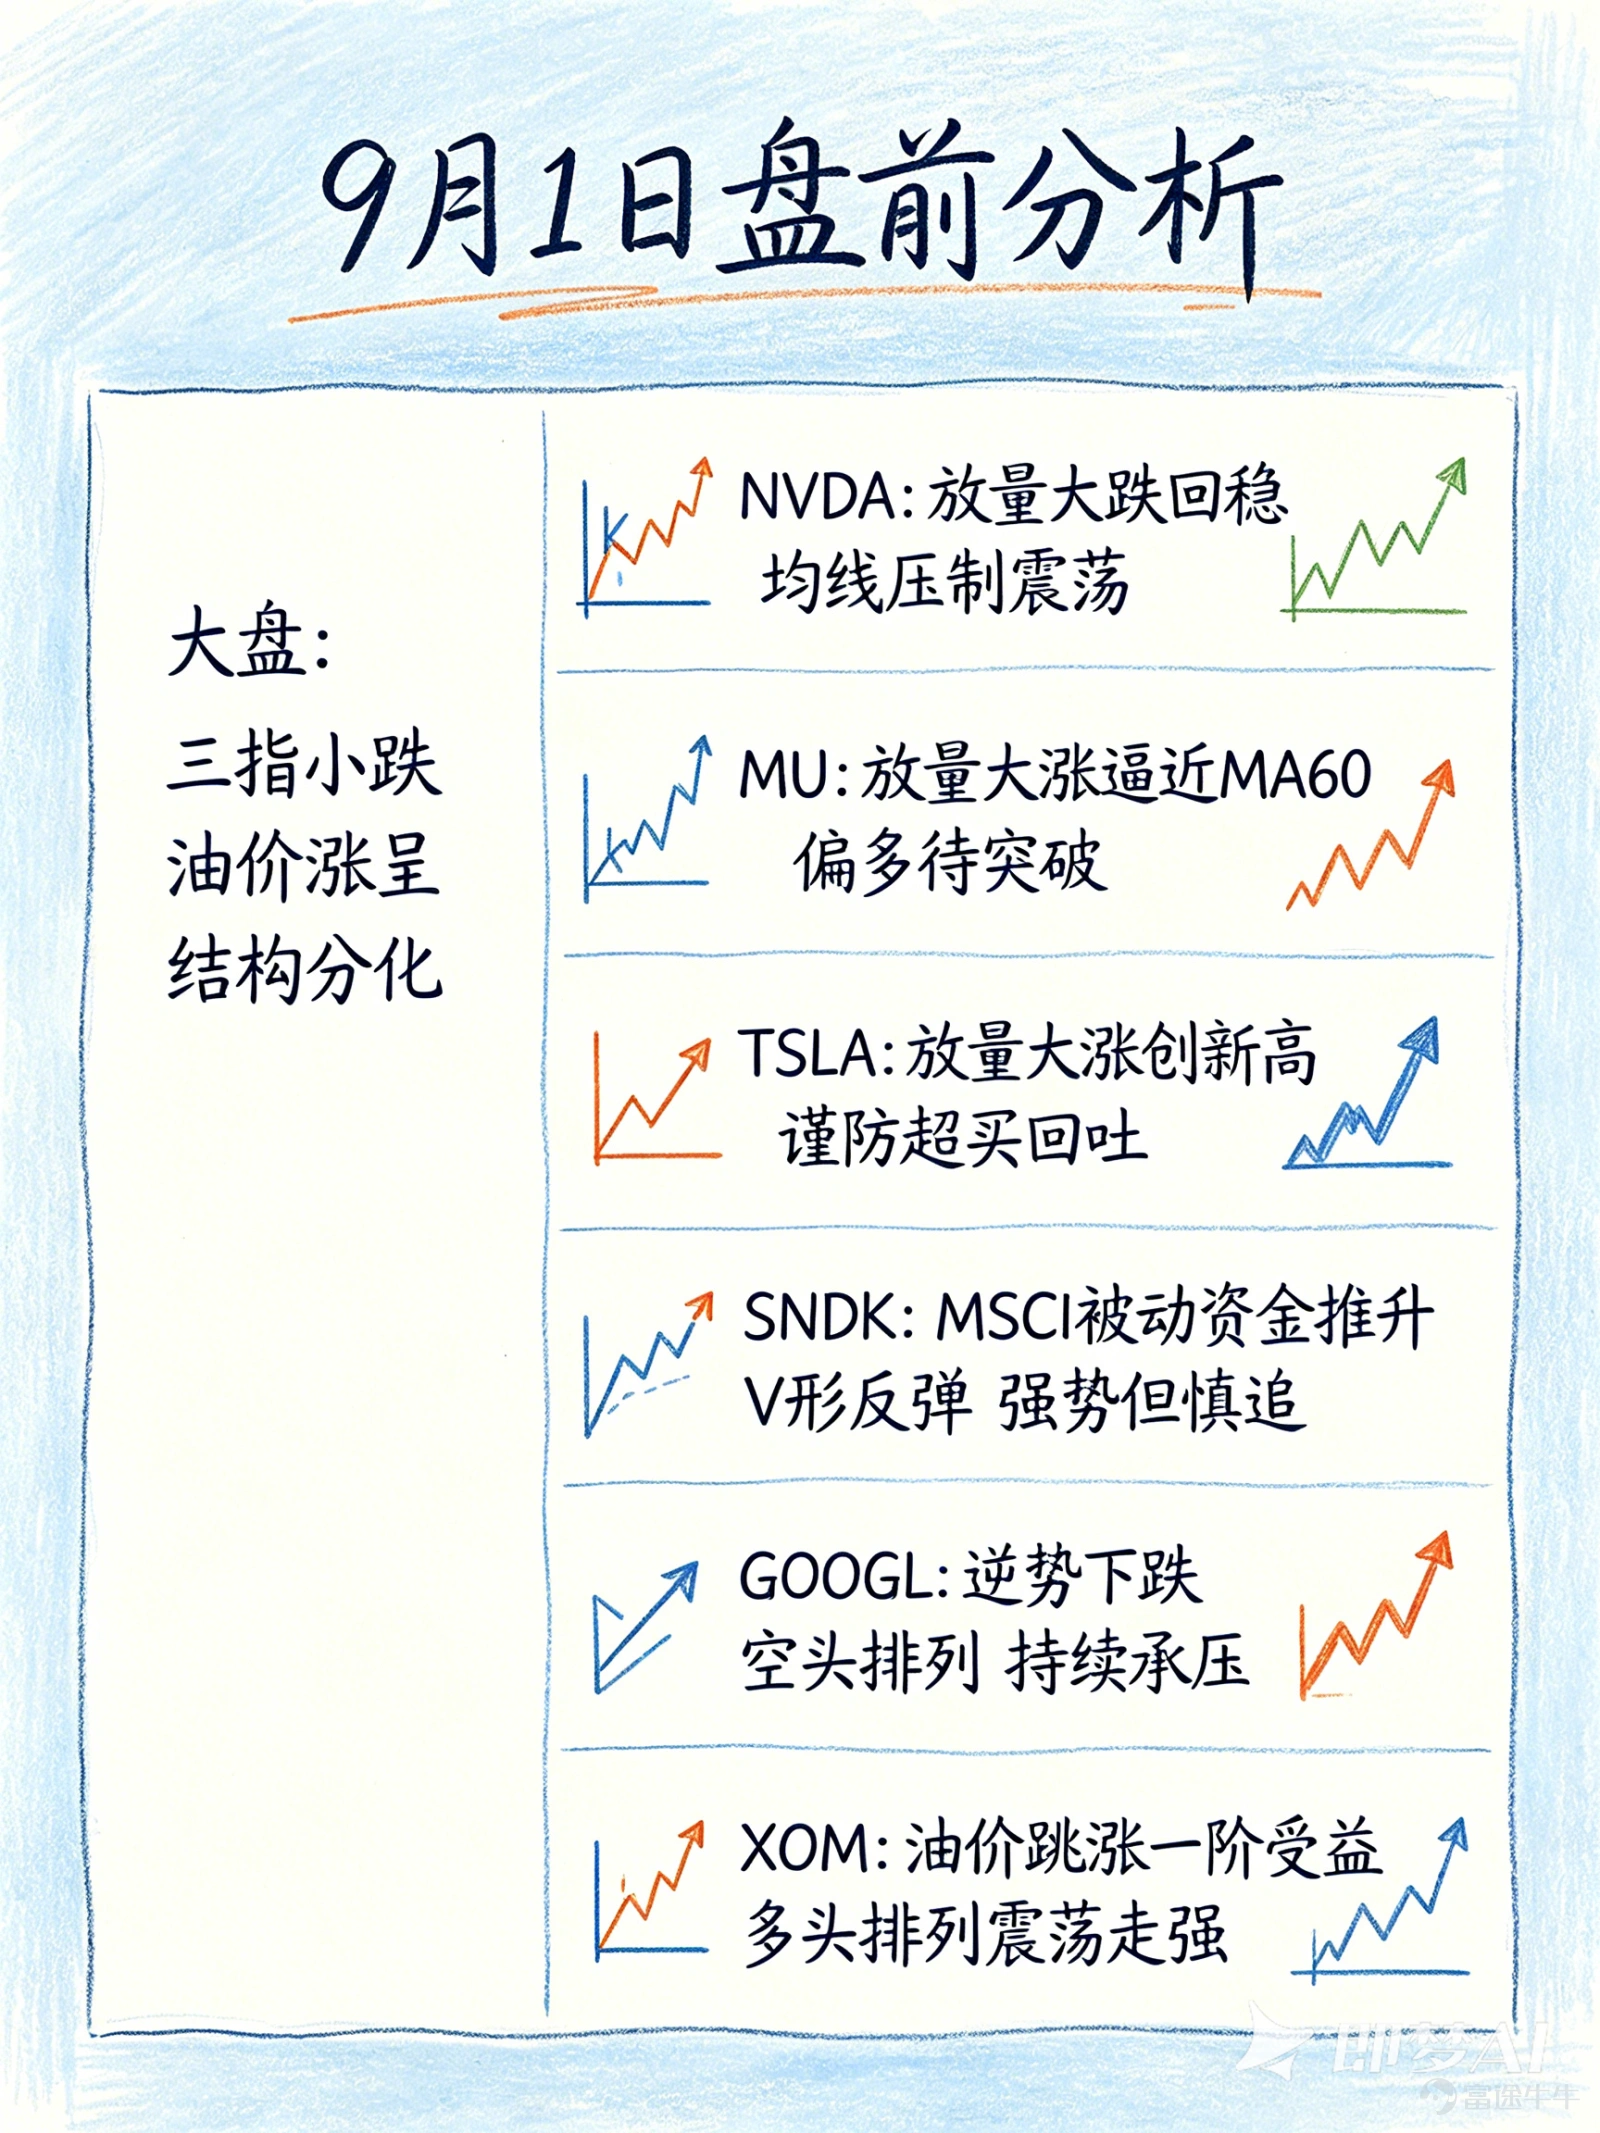
On August 31, the three major US stock indices closed slightly lower, $Dow Jones Industrial Average (.DJI.US)$ the Dow Jones fell 0.70%, $S&P 500 Index (.SPX.US)$ The S&P 500 fell 0.33%, $Nasdaq Composite Index (.IXIC.US)$ the Nasdaq dropped 0.12%, with only the semiconductor index (SOX) bucking the trend to rise 0.57%. The primary driver was the escalation of US-Iran tensions, which pushed up international oil prices; WTI and Brent crude rose to $85.76 and $90.49, respectively. The energy sector led gains with a 2.10% surge, while communication services led declines with a 1.63% drop. The oil price shock has raised inflation expectations and US Treasury yields, with the 10-year yield at approximately 4.75%. The VIX climbed to 14.92, indicating heightened defensive sentiment in the market. However, the AI theme remains locally active, suggesting structural differentiation rather than a broad-based flight to safety.
NVIDIA (NVDA)
Market Review: On 8/28, weighed down by hawkish signals from Christopher Waller at the Jackson Hole meeting and profit-taking following earnings, the stock plummeted 4.57% on heavy volume to 217.55 (trading volume: 195 million shares, lower than the peak on 8/27 but still substantial). On 8/31, it stabilized and rebounded 1.48% to close at 220.78 (trading volume: 125 million shares). After hours, it announced a $3.5 billion convertible bond investment in MediaTek, further binding itself to the AI computing ecosystem and alleviating valuation concerns.
Technical analysis: At the current price of 220.78, it holds firmly above the 60-day moving average (MA60) at 208.31, leaving the medium-term bullish structure intact. However, the MA5 (217.80) and MA20 (218.75) are nearly convergent and moving sideways, forming a "consolidation resistance band" between 217–219, lacking upward momentum in the short term. The MACD is at -0.57, remaining below the zero line; although the green histogram bars are narrowing, a golden cross has not yet formed, indicating waning downward momentum. The KDJ's J-value is 64.31 (neutral to slightly strong), and the RSI6 is 55.08 (moderate), with neither showing overbought conditions. The Bollinger Bands' middle track at 218.75 coincides with the MA20, while the upper track at 229.36 acts as strong overhead resistance. The narrowing Bollinger Bands suggest an impending volatility breakout. Trading volume has shrunk significantly compared to the 8/27 peak; the rebound is characterized by stabilizing on lower volume, requiring increased volume for an effective breakout.
Trend Forecast (Detailed): The core range for the next 1–2 days is 216–222. The first hurdle above is 218.75; if it stabilizes above this level on heavy volume, the target shifts to 221–229. A high-volume breakout above 229.36 would open the path to 240. Below, 215 serves as the bull-bear dividing line; a break below could lead to a retest of 208 or even the psychological support at 200.
Micron Technology MU
Market Review: On 8/28, it edged down 0.27% to close at 932.86. On 8/31, it surged 2.77% on heavy volume to close at 958.73, erasing the previous day's losses and settling near the MA60 (957.92). Trading volume increased compared to the prior two days, indicating active buying interest and strong support at lower levels.
Technical analysis: The moving averages confirm a bullish alignment—the MA5 (939.67) has crossed above the MA20 (927.34) to form a golden cross, strengthening short-term momentum. However, the current price of 958.73 is approaching the MA60 (957.92), which still exerts downward pressure, meaning the medium-term trend has not fully turned bullish. The MACD red histogram bars are expanding to 5.16, accumulating bullish momentum. The KDJ's J-value is 57.24 (neutral to slightly strong), and the RSI6 is 59.45 (moderate); neither is overbought, leaving room for upside. The Bollinger Bands' middle track at 927.34 coincides with the MA20, providing strong support, while the upper track at 1005.08 remains distant. The 957–960 range constitutes a "double pressure zone" where the MA60 overlaps with the previous high from 8/29, making a single breakout difficult. The close on 8/31 was near the daily high (959.97) with a very short upper shadow, indicating bullish control.
Trend Forecast: The core range for the next 1–2 days is 939–960. Strong resistance lies between 960–969; sustained heavy volume is required to break through, otherwise, prices may spike and fall back. If it stabilizes above 960 on heavy volume, the target shifts to 980–1000. Support levels are at 939 and 927; stabilization on shrinking volume presents a buying opportunity. A break below 927 would lead to a retest of the 900–915 platform.
Risk:Memory chips are in a strong cyclical phase; if NAND/DRAM price hikes peak or customer inventory replenishment ends, profit elasticity will reverse rapidly. Strikes in Taiwan's packaging and testing sector (with 80% support rate, mediation in September) may cause short-term disruptions to the supply chain and market sentiment.
Tesla (TSLA)
Market Review: On 8/28, it dipped slightly by 1.71% to 348.75. On 8/31, it surged 5.51% on heavy volume to close at 367.95, hitting a new high for the range and leading the broader market. The gap-up opening was driven by multiple catalysts, including price cuts for the Model 3 in Hong Kong and Macau, the upcoming Cybercab launch on 9/3, FSD deployment in Nevada, and turbine orders from SpaceX.
Technical analysisThe price has risen above the MA5 (353.52) and MA20 (341.11), approaching the MA60 (366.46) and the upper Bollinger Band (366.80), forming a "double resistance zone" at 366–368. The closing price of 367.95 on Aug 31 briefly pierced the upper band but failed to hold. The MACD red histogram is strong at 8.524, indicating robust bullish momentum; however, the RSI6 at 68.84 is nearing the 70 overbought threshold, suggesting significant profit-taking pressure. The KDJ J-value of 80.18 has entered the overbought zone, significantly raising the risk of chasing highs in the short term. Trading volume hit a recent peak of 61.7 million shares, reflecting active capital flow, though heavy volume at high levels also implies divergence. With the price just one step away from the MA60, whether it breaks through will determine the short-term direction.
Trend Forecast (Detailed)The core trading range for the next 1–2 days is 354–370. The 366–368 level represents dense resistance; if the price holds above this level with increased volume, the target shifts to 375–380. Conversely, a push above 370 without corresponding volume may lead to a pullback. Below, 360 serves as the bull-bear dividing line; a break below signals weakness with a retest of 354. A further break of 354 targets 341.
SanDisk SNDK
Market ReviewClosed flat at 1,484.98 on Aug 28; surged 5.50% on heavy volume to close at 1,566.70 on Aug 31 (volume: 23.4 million), forming a V-shaped rebound. This was primarily driven by concentrated late-session buying from passive funds following MSCI index inclusion, compounded by expectations of an AI NAND supercycle, new HBF specifications, and Kioxia's $31 billion expansion plan in Japan.
Technical analysisThe price has moved above the MA5 (1,503.35) and MA20 (1,472.97), confirming short-term recovery. However, the MA60 (1,636.83) remains far above, indicating a still-weak medium-term trend with approximately 4.5% upside room to that level. The MACD red histogram is expanding at 20.374, showing strong bullish momentum. The RSI6 is moderate at 60.05, and the KDJ J-value is neutral-to-low at 32.46, suggesting rebound momentum persists without being overbought, making the technical setup healthier than Tesla's. The Bollinger Band middle track at 1,472.97 coincides with the MA20, providing strong support, while the upper track at 1,772.19 remains distant. The Aug 31 close was near the high with a short upper shadow, favoring bulls. Volume increased to 23.4 million but remained below previous peaks, indicating the rebound was driven by passive buying, leaving the sustainability of active demand questionable.
Trend Forecast (Detailed)The core trading range for the next 1–2 days is 1,485–1,566. The 1,566 level acts as short-term resistance; holding above it targets the 1,600 psychological level. If MSCI passive buying continues and is joined by active capital, the price could challenge 1,630. Support lies at 1,505 and 1,472; stabilization on shrinking volume presents a buying opportunity. A break below 1,472 targets a retest of 1,445.
Alphabet (GOOGL)
Market ReviewRose 1.74% to 346.59 on Aug 28; fell 2.09% against the trend to close at 339.35 on Aug 31 (volume: 33.5 million), marking the weakest performance among the six stocks. This was dragged down by OpenAI's announcement of a $1 billion annual advertising spend rate, which directly threatens Google's core search advertising business, leading the market to reprice the durability of its search moat.
Technical analysisThe moving averages confirm a bearish alignment: the MA5 (344.85) has crossed below the MA20 (350.27) and MA60 (352.28), while the MA20 is also approaching the MA60, forming a "death cross + medium-term resistance." The stock price has broken below the Bollinger Band middle track (350.27) and is approaching the lower track (around 330), with the bands opening downward. The MACD is weakening below the zero line at -0.163, with green bars beginning to appear. The KDJ J-value is neutral-to-weak at 51.82 (not oversold, leaving room for further decline), and the RSI6 shows no extreme values. Increased volume of 33.5 million indicates concentrated selling pressure. The short-term trend has clearly turned bearish, requiring wait for stabilization signals.
Trend ForecastThe core trading range for the next 1–2 days is 330–344. The 344 level acts as overhead resistance; reclaiming it would signal weak stabilization. The 347–350 range represents stronger resistance, making a breakout difficult. Below, 337 is the first support level; a break opens the way to 330. If 330 fails, the next target is 320.
Exxon Mobil XOM
Market ReviewEdged up 0.17% to 156.71 on Aug 28; rose 2.71% on heavy volume to close at 160.95 on Aug 31 (volume: 18.4 million). As a primary beneficiary of the spike in oil prices, driven by escalating US-Iran tensions (US strikes on Iran's Larak Island and Iran's retaliation against US bases in Jordan) which pushed WTI to $85.76 and Brent to $90.49, capital rotated from growth stocks into cyclical and defensive sectors.
RisksStock prices are highly positively correlated with oil prices. If geopolitical tensions ease, causing WTI crude to fall back, it will directly weigh down earnings expectations and market sentiment. While rising inflation suppresses rate-cut expectations, the high dividend yield provides a safety cushion in weak market conditions.
Technical Analysis (Detailed)The moving averages are in a bullish alignment: MA5 (158.59), MA10 (161.86), and MA20 (159.13) are all trending upward, with MA5 and MA10 trading above MA20, indicating strong short-term momentum. The stock price has risen above the Bollinger Bands' middle band (159.13) and is approaching the upper band (168.04), with the bands widening upwards. However, the MACD remains at -1.77, below the zero line (price rising while the indicator has not yet turned positive, characteristic of an early-stage rebound where 'price moves first, indicators lag'). The KDJ J-value is at 12.2, having just turned upward after bottoming out, and the RSI(6) is at a moderate 55.03, both signaling a launch from low levels. With the price still far from the MA60 (149.34), the medium-term trend remains in a repair phase along the lower edge of the upward channel.
Trend Forecast (Detailed)The core trading range for the next 1–2 days is 158–162. Resistance lies at 161–162 in the short term; if volume supports a firm hold above this level, the target shifts to 168. If oil prices continue to rise, the stock could challenge 170+. Support levels are at 158 and 159; a pullback on shrinking volume that holds these levels presents a buying opportunity. A break below 155 would signal weakness, with a potential retrace to 149.
Disclaimer:The above content is based on public data and quantitative analysis and is for reference only; it does not constitute investment advice. The market involves risks, so invest with caution. Any investment decision should be made independently based on personal risk tolerance, financial status, and investment objectives, consulting licensed professional institutions when necessary. Past performance does not indicate future returns.
Content Disclosure: Personal opinion
Risk Disclaimer: The above content only represents the author's view. It does not represent any position or investment advice of Futu. Futu makes no representation or warranty.Read more


Comment (1)
to post a comment
4