Nasdaq hits new highs, AMD market cap surpasses $1 trillion! Is the market trading on the AI Agent n

Sector Breakdown | Cold Data Is Heating Up: HDDs Enter a Substantial Price Hike Cycle
💡Core insight
🔸The most critical marginal change in the HDD industry currently lies on the demand side—AI inference and cloud-based cold data storage demands are resonating and exploding, with demand growth consistently outpacing supply growth.This upturn is essentially a structural rally driven by high-capacity product upgrades,rather than a simple recovery in low-end volume.。
🔸On the supply side, restrained capital expenditure by top-tier manufacturers, combined with objective bottlenecks in read/write head production and testing, makes it difficult to significantly ramp up output in the short term. Industry pricing has alreadyshifted from "moderate improvement" to a more substantial price hike cycle.。
🔸Only three companies remain in the global HDD OEM market: Seagate Technology, Western Digital, and Toshiba.In the nearline storage segment, WDC and STX have effectively formed a duopoly. The industry structure is unprecedentedly concentrated, providing a foundation for sustained price increases and stable profitability.。
🔸In terms of key investment candidates, $Seagate Technology (STX.US)$Leveraging its leadership in HAMR technology and a more direct path to profit realization, $Western Digital (WDC.US)$Driven by rapidly improving gross margins and deep engagement in long-term contracts, $Hoya (7741.JP)$the company benefits from growing demand for glass substrates and EUV mask substrates,with each corresponding to investment opportunities in different segments of the HDD supply chain.All three exhibit strong certainty over the medium to long term.。
1. AI Inference Storage Hierarchy
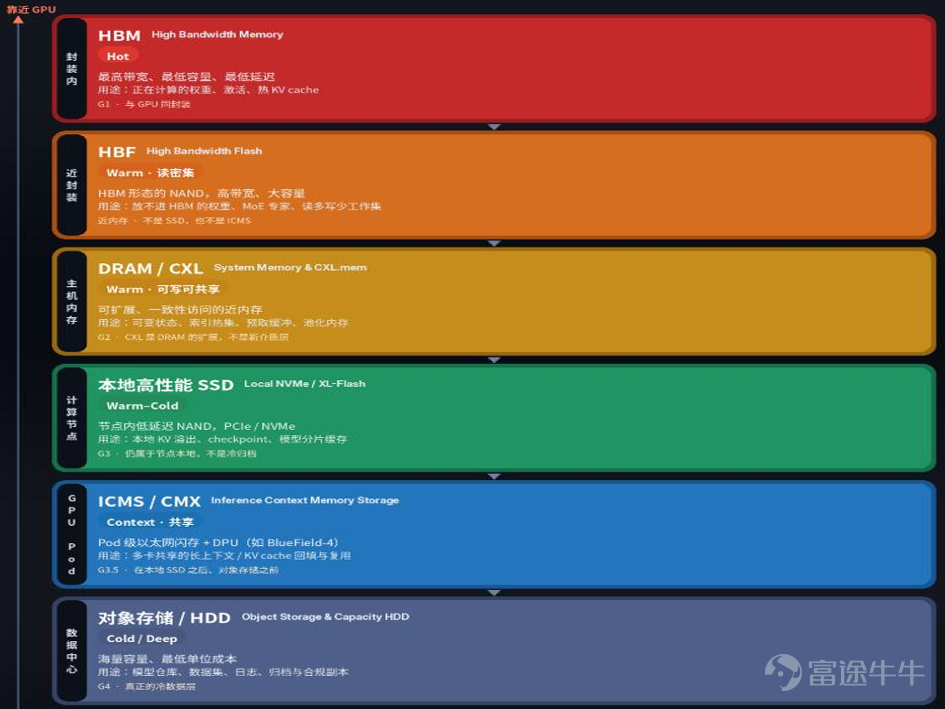
HDDs are a niche category within the storage sector, primarily used in data centers for storing cold data or meeting deeper-tier storage needs—i.e., data that is infrequently accessed but requires long-term retention. Based on proximity to the GPU, storage required for AI inference can be divided into six tiers: tiers closer to the GPU offer faster speeds, higher costs, and smaller capacities; tiers farther from the GPU feature slower speeds, lower costs, and larger capacities.
Within the package: HBM — This layer holds data currently being processed, offering the fastest speed but with very limited capacity.
Mounted adjacent to the chip: HBF — Still flash memory in die form, not a standard SSD. It is used to store weights and expert parameters that exceed HBM capacity but require frequent access.
Host memory: DRAM/CXL — A read-write, shareable, and scalable memory tier; CXL essentially extends memory reach rather than representing a new type of storage drive.
On this machine: Local high-performance SSD — The node’s local fast storage, responsible for KV cache overflow, checkpoints, and model caching. While slower than memory, it does not fall into the cold archival category.
Within the rack/Pod: ICMS/CMX — Shared context flash storage across multiple machines, connected via network and DPU, specifically designed for long conversations and reusable KV caches. (Note: HBF and ICMS are not at the same level; the former is mounted next to the chip, while the latter operates at the rack level.)
Deep within the data center: Object Storage/HDD — Lowest cost and largest capacity, but slowest speed; primarily responsible for cold data storage, with nearline storage also handling part of the warm data storage demand.
Chart 1: AI Inference Storage Hierarchy (Source: Futu Securities)

II. Supply and Demand Landscape
Demand Side: Resonance between AI inference and cloud cold storage drives demand growth beyond historical cycles
The most critical marginal change is currently occurring on the demand side. Industry surveys indicate that HDD demand is growing at an annual rate of40%-50%, while supply-side EB growth is only30%-35%, resulting in a persistent supply-demand gap (note: this industry survey data has not yet been verified through public channels and is for reference only). The overall HDD market, measured in units, has been in continuous decline for over a decade, stabilizing at low levels from 2023 to 2026. This precisely indicates thatthe current upcycle is not driven by volume recovery in low-end products, but rather byDriven by structural upgrades toward higher capacity。
Supply side: OEMs are exercising restraint in capacity expansion, strengthening the industry's pricing power
On the supply side, OEMs show no significant impulse to expand capacity. Instead, they rely more on technological upgrades rather than aggressive capital expenditure to increase capacity supply. This stands in stark contrast to the historical pattern of "rushing to expand capacity as soon as the cycle turns positive." A strong consensus has emerged in the industry to achieve this through Long-Term Agreements (LTAs), Build-to-Order (BTO) arrangements, and more disciplined capital spending.to deliver more predictable growth and more stable pricing。
The latest Japanese supply chain data further highlights that the ramp-up of Nearline HDD volumes may be constrained by read/write head availability and testing capacity (this claim has not yet been verified through public channels). This is a critical point, as it implies that supply constraints stem not only from the deliberate restraint of OEMs but also from objective bottlenecks in components and testing. The upstream supply chain is also highly concentrated: there are only three major OEMs—Seagate Technology, Western Digital Corporation (WDC), and Toshiba. Core segments such as read/write heads, glass substrates, spindle motors, and suspensions are likewise controlled by a handful of companies.
Chart 2: HDD Supply Chain Division of Labor (Source: Futu Securities)

3. Pricing: Has moved from modest improvement to a more substantive price hike cycle
The industry's strongest earnings elasticity comes from pricing. In the early stages, the market was only willing to assume a slight improvement in $/TB, but current surveys are markedly more optimistic: the current long-term contract price for nearline drives is approximately $16/TB, with manufacturers aiming to raise it to$25–30/TBover the next 2–3 years; even under a more conservative base-case scenario, the pricing assumption for FY28 remains atAround $20/TB(The aforementioned pricing forecast data has not yet been verified through public channels).
Data from external channels also corroborates that price hikes are underway: the contract price for benchmark products in Q2 2026 rose by approximately10%, whereas previous quarterly increases mostly ranged between 1% and 4% (this data has not yet been verified through public channels). Current pricing has adopted a "value-based pricing" strategy, with year-on-year increases reaching the mid-to-high single digits, and capacity growth premiums exceeding 10%.This indicates that the industry has moved beyond relying solely on product mix improvements and entered a phase of substantive price increases.。
4. Competitive Landscape: There are only three global OEMs, resulting in an unprecedentedly concentrated industry structure.
The HDD OEM market is essentially an oligopoly dominated by three players: Seagate Technology, Western Digital, and Toshiba. In the nearline data center segment,the duopoly between WDC and STX is even more pronounced,with Toshiba serving primarily as a third-party supplement. WDC holds a slight edge in market share, while STX demonstrates advantages in profit leverage and the pace of technology commercialization. Although Toshiba has shown improvement,its market position is better suited as an observational indicator for validating marginal incremental changes in the industry., rather than the core allocation theme。
Chart 3: Overview of the Global HDD Competitive Landscape (Source: TSR, Futu Securities)

🔍 V. Key Investment Targets
STX is the most direct beneficiary of HAMR (Heat-Assisted Magnetic Recording) technology commercialization. The company has essentially completed its business restructuring by fiscal 2026: Data Center has become the core growth engine, accounting for approximately80%, while Edge IoT consumer applications have taken a backseat. The company holds an absolute leading advantage in HAMR technology, which has already contributed approximately40%of shipments.
To increase capacity in traditional PMR (Perpendicular Magnetic Recording) hard drives, the magnetic grains storing data on the platters must be made smaller. However, once the grains are reduced to a certain size, thermal fluctuations at room temperature can disrupt their magnetic orientation, leading to data loss. Therefore, harder magnetic materials must be used, combined with micro-lasers to heat the media during writing.HAMR is the only definitive long-term technological roadmap for HDDs. Seagate Technology holds a leading position in this roadmap,having transitioned from a "long-term narrative" to a "current gross margin driver", which represents its core differentiation from Western Digital. Research estimates suggest that HAMR shipments could rise from 3.4 million units in 2025 to approximately 9 million units in 2026 and about 16 million units in 2027 (note: these shipment forecasts have not been verified through public channels; the company officially discloses data only based on the EB口径 [Enterprise Business] scope and proportion). Mozaic 3 products are already operating in production environments for all major cloud customers, and Mozaic 4 is ramping up with two global CSPs,Mozaic 4 offers superior gross margins compared to current products, with average quarterly gross margins expected to expand by approximately 300 basis points in FY27.This is also why the market has continued to raise STX's EPS estimates and target prices throughout 2026.
In terms of overall order demand, the vast majority of near-term capacityhas already been allocated through 2028.Historically, HDD manufacturers were viewed by the market as high-beta cyclical stocks due to short order cycles, high customer concentration, and significant quarterly volatility. However, customers are now locking in supply over longer periods, while industry leaders are meeting demand through technological upgrades rather than large-scale capacity expansion,thereby stabilizing the core profitability level.。
Last quarter, its market share was slightly higher than that of Seagate Technology, though the gap was narrow. Its technology roadmap is more balanced. While the market was previously cautious about the pace of its HAMR rollout, those concerns are now being corrected—WDC does not lack HAMR; rather, it is pursuing a dual-track strategy with ePMR/UltraSMR and HAMR. It will push ePMR to its limits before switching to HAMR at the inflection point where 'capacity gains exceed laser costs and certification risks' (approximately above 40TB), thereby extending the high-capacity product curve more smoothly.
The most noteworthy change for WDC isthe significantly accelerated pace of gross margin improvement:quarterly gross margin rose from 41% in June 2025 to 54% in June 2026, driven by a triple convergence of factors: an increased share of high-capacity drives, an improved pricing environment (FY26 Q4 price per GB up 18% year-over-year and 8% quarter-over-quarter), and a continuous decline in cost per TB (down 8% year-over-year in FY26 Q4, with a long-term target of approximately 10% annual reduction). The market has also underestimated the depth of the company's long-term agreements: it had already secured contracts with at least one major customer through 2029, and in August 2026, further indicated that it was discussing LTA agreements covering 2029–2031 with multiple clients. Capacity for 2026 is nearly sold out, and three of its top seven customers have extended their agreements to 2027/2028.
However, compared to Seagate,the rate of cost reduction for Western Digital's TB drives is narrowing: Seagate's 44TB HAMR drives have already achieved volume shipments with two hyperscale cloud providers, whereas Western Digital's 40TB ePMR drives are still in the early ramp-up phase. Production of its 44TB HAMR drives is not expected to start until the first half of 2027. It is reported that four customers have completed certification (note: this timeline differs from some public reports and cannot be fully verified at this time; for reference only). The mid-to-long-term target of a 10% cost reduction is not expected to be realized until the 2027 calendar year. In terms of valuation, Seagate's trailing twelve-month (TTM) P/E ratio is approximately60x, while Western Digital's is around20 times(Western Digital's GAAP profits are somewhat distorted due to mark-to-market accounting of its retained SanDisk shares following the spin-off); the forward one-year P/E ratios for both companies are basicallyin the range of 22-24x, with Seagate being slightly higher.There is still room for upside in the valuations of both companies.
Chart 4: Western Digital Product Roadmap 2026-2032 (Source: Western Digital)

Within the company's business, revenue from the Life Care segment, which is related to eyeglass lenses, accounts for approximately60%; Revenue contributionapproaching 40%However, the IT business contributes more significantly to profits. This segment includes glass substrates for certain HDDs, where HOYA holds a global monopoly with100%market share; in the field of semiconductor mask substrates for lithography machines, HOYA also ranks among the top two globally.
In the latest quarter, the company saw both volume and price increases for EUV mask substrates. The pricing of this product is highly correlated with defect rates. The performance improvement this quarter was mainly driven by the continuous iteration and maturation of manufacturing processes, which released supply capacity for low-defect-grade products. Meanwhile, phase-shift masks (PSM), which will be widely adopted at the N2 node, have potential for price hikes and offer upside beyond expectations. The recovery in demand for advanced processes has boosted the sales proportion of high-end products, leading to a favorable shift in business structure.
Demand for HDD products remains robust. Glass substrates maintained double-digit year-over-year growth in the previous fiscal year. The second-largest customer has disclosed its product roadmap starting from the second half of 2026, while the third customer will not begin adoption until fiscal year 2027. The long-term potential for this business remains substantial.HOYA's investment value lies not in the short-term price elasticity of HDDs, but insharing in the mid-to-long-term growth in material demand driven by data center upgrades, underpinned by high technical barriers, strong customer stickiness, and stable bargaining power.。HOYA exhibits less price elasticity than pure-play memory stocks, but it is considered a relatively steady growth stock.
VI. Summary
Overall, considering limited supply growth and strong demand for data storage, we remain optimistic about the role of HDDs in the expansion of AI capital expenditure. NAND prices are a good leading indicator for HDD demand: changes in NAND prices alter cloud providers' storage procurement decisions in advance, which subsequently translates into HDD orders. When the price gap per TB between NAND and HDD widens, using SSDs for warm data becomes economically less viable. NAND prices are expected to continue rising until mid-2027,The HDD industry is expected to maintain its strong momentum.。
Another reason major manufacturers can control production and maintain a tight balance between supply and demand is the near absence of Chinese competitors in the industry. HDDs face significant patent barriers, and the high capital intensity results in a high break-even threshold. Consequently, China’s strategy has been to partially replace HDDs with enterprise-grade SSDs. However, due to cost constraints, SSDs cannot broadly substitute HDD demand, particularly for cold data storage. Overall, HDDs attract less investor enthusiasm than HBM or NAND, as their technological iteration is slower and their price elasticity is lower.but they offer stronger certainty over the medium to long term.。
⚠️ Risk Warning
- Order fulfillment pace fell short of expectations
- AI capital expenditure missed expectations
[Investment Advisory Information]
Yang Yi, Licensed Representative, CE No.: BUR210
Disclaimer
This report is prepared by Futu Securities International (Hong Kong) Limited ("Futu Securities"). Without Futu Securities’ prior written consent, this report and the information contained herein may not be (i) reproduced, copied, or stored in any form, or (ii) distributed or transmitted directly or indirectly to any other person for any purpose. The information in this report is derived from sources that Futu Securities believes to be accurate and reliable as of the date of publication; however, this report is not intended to contain all information required by investors and may be subject to delays, obstructions, or interception in transmission. Futu Securities makes no express or implied representation or warranty regarding the adequacy, accuracy, completeness, reliability, or fairness of such information or opinions. Accordingly, Futu Securities and its affiliates (collectively, the "Futu Group") shall not be liable for any losses (including, without limitation, direct, indirect, or consequential damages) arising from any actions taken by third parties relying on the content of this report. The views, recommendations, suggestions, and opinions expressed in this report do not necessarily reflect those of Futu Securities or its affiliates and may be changed at any time without notice. Futu Securities undertakes no obligation to update any such information or opinions. This report is provided for general informational purposes only and is intended solely for the general reference of Futu Securities’ clients, without regard to the specific investment objectives, financial situation, or particular needs of any individual recipient. Nothing in this report constitutes or should be construed as an offer, recommendation, or solicitation by any member of the Futu Group to buy or sell any securities, investments, or other financial instruments. It should not be interpreted as an offer or invitation to purchase or sell securities. Any decision to purchase securities mentioned in this report should be based on publicly available information, including relevant prospectuses. The products referenced in this report may not be suitable for all investors, and readers should carefully consider all relevant factors and seek professional advice before making any investment decisions. This report is provided to recipients on the assumption that they are capable of independently evaluating investment risks and exercising independent judgment in making investment decisions. In certain jurisdictions or countries, the distribution, issuance, or use of this report may violate applicable laws, regulations, rules, or other registration or licensing requirements. This report is not intended for distribution to, or use by, any person or entity in such jurisdictions or countries. Hong Kong-based investors with questions regarding Futu Securities research reports should contact Futu Securities directly. The SFC Central Entity Reference Number of the report’s author is disclosed next to the author’s name on the report’s cover page. The analyst primarily responsible for preparing this report confirms that: (i) the views expressed in this report accurately reflect his/her personal views regarding the subject listed companies; and (ii) none of the compensation he/she has received, currently receives, or will receive—directly or indirectly—is linked to the specific recommendations or views expressed in this report. The analyst confirms that neither he/she nor any related party has traded in the securities of the subject listed companies or their related securities within 30 days prior to the publication of this report or within three business days following its publication. Neither the analyst nor any related party serves as a senior officer of the subject listed companies or holds any financial interest in them. In this report, Futu Securities does not hold a financial interest equal to or greater than 1% of the listed company’s market capitalization and has had no investment banking relationship with the company in the past 12 months. None of the company’s employees are employed by the listed company.
Risk Disclaimer: The above content only represents the author's view. It does not represent any position or investment advice of Futu. Futu makes no representation or warranty.Read more

Comments
to post a comment
5