HK Stock Market Barometer | HK stocks continue to fluctuate and pull back! How much room for recover
Market Weekly Report | August 17–23, 2026
This week, global markets revolved around reflation risks, shocks to long-end interest rates, the repricing of AI capital expenditure, and geopolitical premiums. Although US CPI eased, pressure from energy prices and US Treasury supply continued to push up long-term yields, with the 30-year US Treasury yield hitting a new high, weighing on US tech stocks. Escalating tensions between the US and Iran drove oil prices and gold higher. In contrast, Hong Kong stocks rose against the trend, with the Hang Seng Index gaining 3.55% for the week. However, southbound capital saw a net outflow of HKD 11.584 billion, reflecting a pattern of "rising indices, profit-taking by mainland investors, and value outperforming growth." Looking ahead to next week, key variables will include the PCE data, NVIDIA's earnings report, and the Jackson Hole symposium.
I. Global Macroeconomic Overview
The core macroeconomic theme globally this week was"Sticky inflation + Treasury buybacks + Supply-demand dynamics + Resurgence of geopolitical premiums"—These four threads intertwined to drive sharp divergence across asset classes.
On the U.S. front,, the July FOMC meeting minutes released on August 19 indicated that the committee voted 9-3 to keep thefederal funds rateunchanged in the range of 3.50%–3.75%. Regarding inflation, most participants at the July meeting believed that inflation remains distant from the 2% policy target, frequently citing risks to anchored inflation expectations from energy supply shocks due to geopolitics, tariff friction, and the AI investment boom.
US Treasury yields surged this week. On August 17, the 10-year US Treasury yield reached 4.72%, while the 30-year yield hit an intraday high of 5.34%, marking a nearly two-decade high. The US federal government's annual fiscal deficit of nearly USD 2 trillion continues to increase Treasury supply, while large-scale debt issuance by corporations for AI investments has exacerbated the supply-demand imbalance in the long-duration bond market. On August 19, US Treasury Secretary Bessent announced a doubling of the buyback scale for 10- to 30-year Treasuries, triggering a strong market reaction. The 10-year yield fell by approximately 6 basis points, and the 30-year yield dropped by nearly 9 basis points. However, the following day, long-end US Treasury yields rebounded after the initial decline, with the 30-year yield returning to around 5.27% intraday, virtually erasing all gains made after the Treasury Department's announcement of expanded buybacks.
In China,On August 17, the National Bureau of Statistics released a report showing that in July, exports totaled CNY 2.7125 trillion, up 17.8%, and imports totaled CNY 1.9454 trillion, up 21.2%, indicating an optimized trade structure. This also drove industrial value-added to grow 4.5% year-on-year and the services production index to rise 4.3% year-on-year, maintaining robust supply-side support. On the demand side, although imports rose 21.2% to CNY 1.9454 trillion, total retail sales of consumer goods increased by only 0.6% year-on-year, and fixed asset investment fell 1.42% month-on-month. On the price front, July CPI rose 0.5% year-on-year, and core CPI increased 0.9% year-on-year, with overall price levels remaining moderate. The urban surveyed unemployment rate rose slightly to 5.2% due to seasonal factors. While the trade structure continues to optimize, the current economy still reflects stronger supply than demand and stronger external demand than domestic demand. Market expectations for fiscal stimulus and monetary policy easing (RRR cuts and rate cuts) by the end of the third quarter have strengthened.
Regarding geopolitics and commodities,On August 20, US President Trump posted a major statement on his personal social media platform, Truth Social, formally announcing the implementation of the strictest economic actions against Iran in history, launching an all-encompassing, no-holds-barred economic war and global isolation campaign against Iran. Compounded by disruptions to passage through the Strait of Hormuz and the Russia-Ukraine conflict, global diesel supplies have been affected.
As of the close on August 20, WTI crude oil for September delivery rose 2.3% to $87.83 per barrel, WTI for October delivery gained 2.9% to $86.83 per barrel, and Brent crude for October delivery increased 2.4% to $93.78 per barrel.
Amid market debt anxieties compounded by geopolitical concerns, gold surged 11% for the month. On August 21, spot gold traded near $4,623 per ounce, marking a weekly gain of over 5%.
1. Global Asset Class Performance
Global asset divergence intensified: U.S. equity indices fell in unison, while Hong Kong stocks bucked the trend; the U.S. Treasury bear steepener persisted, and both crude oil and gold hit new highs.
In equities,as of the close on August 21, the three major U.S. stock indices all closed lower, ending a three-week winning streak. The S&P 500 fell 1.43%, the Nasdaq Composite dropped 2.10%, and the Dow Jones Industrial Average declined 0.84%; the Philadelphia Semiconductor Index plunged 5.63%. The three major indices rebounded collectively on Friday, primarily driven by a temporary stabilization in the U.S. Treasury market. Asian-Pacific markets showed internal divergence: the Nikkei 225 fell 3.93% for the week, the largest decline among the five major markets; South Korea's KOSPI dropped 1.18%; the FTSE Taiwan 50 fell 1.43%; while the Hang Seng Index strengthened against the trend, rising 3.55% for the week.
In bonds,U.S. Treasury yields exhibited a bear steepening pattern this week, with long-end rates hitting nearly 19-year highs. The 2-year U.S. Treasury yield rose 14 bps to 4.24%, the 10-year yield increased 10 bps to 4.736%, and the 30-year yield climbed 7 bps to 5.276%. On Monday, the 30-year yield briefly touched around 5.31%, a high not seen since June 2007. On Wednesday, the U.S. Treasury announced it would at least double its buyback scale for 10- to 30-year long-term bonds from $2 billion to $4 billion, causing the 30-year yield to plunge momentarily to 5.183%. However, the rally lasted only one day, as long-end rates rebounded consecutively on August 20-21. Regarding Chinese bonds, the yield on China's 10-year government bond declined from 1.711% to approximately 1.696%, a weekly drop of about 1.5 bps, reflecting safe-haven demand amid weak domestic fundamentals.
In foreign exchange,the U.S. Dollar Index weakened after narrow fluctuations this week. On August 19, following the U.S. Treasury's expansion of long-term bond buybacks, the Dollar Index closed down 0.85%, hitting a low of 98.6862 on August 21. The Renminbi continued to strengthen throughout the week; on August 20, the PBOC set the central parity rate at 6.7808, an increase of 46 pips from the previous day's 6.7854, marking the strongest central parity since February 2023.In commodities,International oil prices surged for six consecutive trading sessions this week. On August 21, WTI crude closed at $87.06 per barrel, up 5.66% for the week. Spot gold climbed above $4,600, briefly breaking through $4,632 per ounce during intraday trading to hit a three-month high.
3. Hong Kong Market Weekly Review
Hong Kong stock market trading days this week were from August 17 to August 21 (5 trading days, with no holiday-related volume shrinkage). The Hang Seng Index closed at26,009.46 points, posting a weekly gain of3.55%; the Hang Seng Tech Index closed at4,766.16 points, posting a weekly gain of1.24%; the Hang Seng China Enterprises Index closed at8,634.34 points, posting a weekly gain of3.52%. The Hang Seng Index's P/E (TTM) was approximately11.94x, and P/B was approximately1.26x(Aug 21), the AH Premium Index narrowed from 122.78 to120.96, further reducing the discount of Hong Kong stocks relative to A-shares.
At the industry level,"Surge in gold stocks + Hardware rebound + Large models dipping before rising + Financial and insurance earnings catalysts"These are the four main themes. The explosion in the gold sector is clearly supported by commodity prices. London spot gold consecutively broke through the integer thresholds of $4,400, $4,500, and $4,600 per ounce during the week, posting a weekly gain of 5.20% and marking three consecutive weekly gains. In the hardware sector, memory chip and semiconductor stocks led the gains on Monday. After a collective sell-off on Wednesday, Hang Seng Indexes Company announced after Friday's close that Hua Hong Hongli would be included in the Hang Seng Index. This quarterly review result constitutes a structural positive for the sector. Regarding the large model sector, in terms of capital flows, southbound net inflows into MINIMAX-W ranked among the top for individual stocks during the week. The earnings catalyst effect in the financial and insurance sector was reflected in the overall sector gains and the correlation among individual stocks.
Fundamentals
southbound capitalIn this aspect, the week (Aug 17–Aug 21) showed a "high start, low finish" trend—after net buying of nearly HK$17.1 billion on Monday and Tuesday combined, there were net outflows for three consecutive trading days, with total sales of approximately HK$28.6 billion. For the full week, the totalnet outflow was approximately HK$11.584 billion. Daily flows: Net buying of HK$3.077 billion on Monday; net buying of HK$14.0 billion on Tuesday (a recent high); net selling of HK$10.6 billion on Wednesday (the highest single-day outflow since April 9); net selling of HK$10.412 billion on Thursday; and net selling of HK$7.63 billion on Friday. Breaking down Friday's figures: the Shanghai-Hong Kong Stock Connect saw net selling of HK$5.134 billion, while the Shenzhen-Hong Kong Stock Connect saw net selling of HK$2.496 billion.Regarding individual stocksNet buying was primarily concentrated in Alibaba, SMIC, Zhipu AI, Kuaishou, and MiniMax, while the main net sellers included Hua Hong Semiconductor, Xiaomi, and CSPC Pharmaceutical.Regarding ETF fund flows,Southbound capital sold approximately HKD 10.41 billion of Tracker Fund (02800.HK) and about HKD 5.74 billion of Hang Seng China Enterprises Index ETF (02828.HK) this week, indicating that mainland investors were reducing positions through broad-based ETFs.
Trading volumeIn terms of trading activity, the average daily turnover in the Hong Kong stock market was approximatelyHKD 249.2 billion, representing an increase of about [percentage missing] compared to last week's turnover of HKD 183.765 billion,34%with overall market trading remaining active.Regarding foreign capital,according to the latest data from August 12 to August 18, stable foreign inflows totaled HKD 1.5 billion, while flexible foreign outflows reached HKD 11.4 billion, reinforcing the divergent pattern of 'stable inflows versus flexible outflows.'
The driving forces behind the Hong Kong stock market this week can be summarized into four main themes.: First,Southbound momentum fades—After substantial net buying of HKD 17.1 billion on Monday and Tuesday, there were three consecutive days of net outflows totaling HKD 28.6 billion, resulting in a weekly net outflow of approximately HKD 11.6 billion. The Hang Seng Index rose cumulatively by 3.55% to reclaim the 26,000-point level, yet southbound funds exhibited a profit-taking tendency, selling more as prices rose; secondly,Divergent trading by mainland investors in internet giants—Reflecting mainland capital's assessment of structural differentiation within the internet sector; thirdly,"Buy the dip" strategy for large language model (LLM) stocks —Indicating that mainland investors are positioning contrarianly in the AI sector; fourthly,Divergence between "stable" inflows and "flexible" outflows from foreign capital—Stable foreign capital recorded inflows of HKD 1.5 billion, while flexible foreign capital saw outflows of HKD 11.4 billion. Inflows via the Stock Connect totaled HKD 14.9 billion. The opposing directions of stable and flexible foreign capital suggest that long-term funds remain willing to allocate to Hong Kong stocks, whereas short-term hot money chose to take profits after the Hang Seng Index rebounded to 26,000 points.
IV. Outlook for the Market Ahead
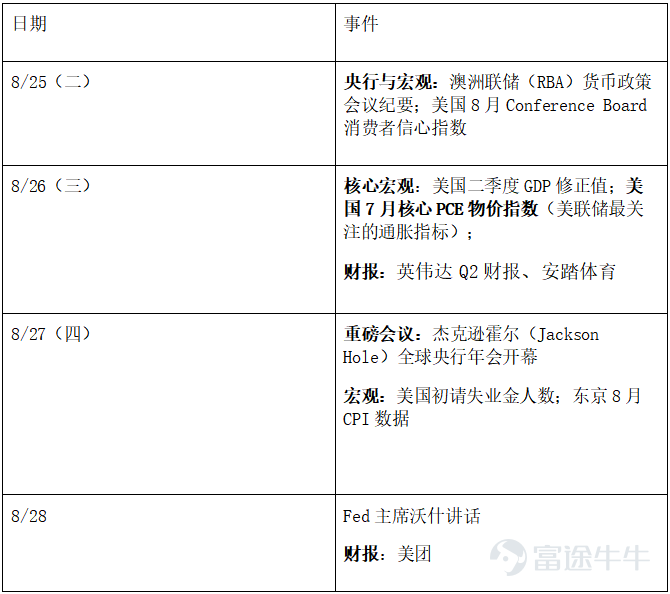
Key Calendar

Key Calendar
Core Thesis
Short-term (1-2 weeks),Hong Kong stocks are expected to remain volatile around the 26,000-point level. Index performance may continue to outpace actual money-making effects. While the Hang Seng Index rises, southbound capital flows have turned net negative, indicating that the current rally is driven more by low-valuation heavyweight stocks, gold, financials, and resources, rather than a broad-based increase in risk appetite. The technology sector awaits confirmation from the August 26 PCE data and NVIDIA's earnings report.
Medium-term (1–3 months)The core variables remain US reflation and long-term interest rates. If the PCE cools and Warsh does not release further hawkish signals, a decline in US Treasury yields will open up room for valuation repair in Hong Kong-listed tech stocks. Conversely, if oil prices remain high and push up inflation expectations, long-duration growth assets will still face valuation compression.
Allocation Strategy
1. AI Hardware/Semiconductors: Focus on earnings realization. Prioritize companies with clear order growth in advanced process nodes, AI computing power, domestic substitution, and hardware. NVIDIA's earnings report on August 26 is a key validation point; if guidance is strong, maintain focus, but be wary of pullbacks in high-valuation targets if AI returns come into question.
2. Gold:The medium-term logic remains intact, but avoid chasing highs. Fiscal deficits, geopolitical risks, and inflation concerns continue to support gold, but given the significant short-term gains, it is more suitable as a defensive and hedging position.
3. Energy/Oil Services:Leaning towards event-driven drivers. Oil prices are supported by US-Iran tensions and supply disruptions, offering opportunities in the energy chain. However, easing geopolitical tensions could lead to a rapid retreat in oil prices, so heavy positions chasing the rally are not advisable.
4. Internet:Focus on AI monetization capabilities. Tencent and Alibaba continue to increase their AI investments. Key areas to watch going forward include AI revenue, profit margins, and free cash flow. Prioritize companies that can translate AI investments into profitability.
5. Financials/High Dividend:Adopt a defensive allocation strategy. Domestic demand in mainland China remains weak, making high-dividend assets such as insurance, telecommunications, and utilities relatively resilient. For pro-cyclical sectors like banking, real estate, and consumer discretionary, wait for improvements in credit and domestic demand data before increasing exposure.
Risk Warning
"US Core PCE and Jackson Hole symposium signal unexpectedly hawkish stance": If inflation continues to rise, Warsh’s views reinforce the possibility of further rate hikes within the year. "Escalating US-Iran tensions; Brent crude breaks above $100": The energy supply shock will gradually shift from being a tailwind for energy stocks to a headwind for global inflation and consumption. At that point, the overall impact on Hong Kong stocks could turn from positive to negative. "AI capital expenditure ROI falls short of expectations": Both Tencent and Alibaba have entered a phase of high Capex. If subsequent guidance from cloud providers indicates a slowdown in AI demand growth, it could trigger a second round of valuation contraction. "China's domestic and credit demand remain persistently weak": If August data on credit, real estate sales, and consumption do not show significant improvement, earnings expectations for pro-cyclical sectors may still be revised downward. "Southbound funds shift from profit-taking to trend-based outflows": Between August 17 and 21, while the Hang Seng Index rose by 3.55%, southbound net outflows totaled HK$11.584 billion, indicating a tendency among mainland investors to cash out near the 26,000-point level. If the index continues to rise over the next two weeks while southbound flows remain net negative, this should be viewed as a warning signal of weakening internal market momentum.
Disclaimer: This report is for internal reference and discussion purposes only and does not constitute any investment advice.
Data sources: AlphaPai database and compiled public market data; data is current as of August 24.

Disclaimer
Risk Disclaimer: The above content only represents the author's view. It does not represent any position or investment advice of Futu. Futu makes no representation or warranty.Read more

Comments
to post a comment
1