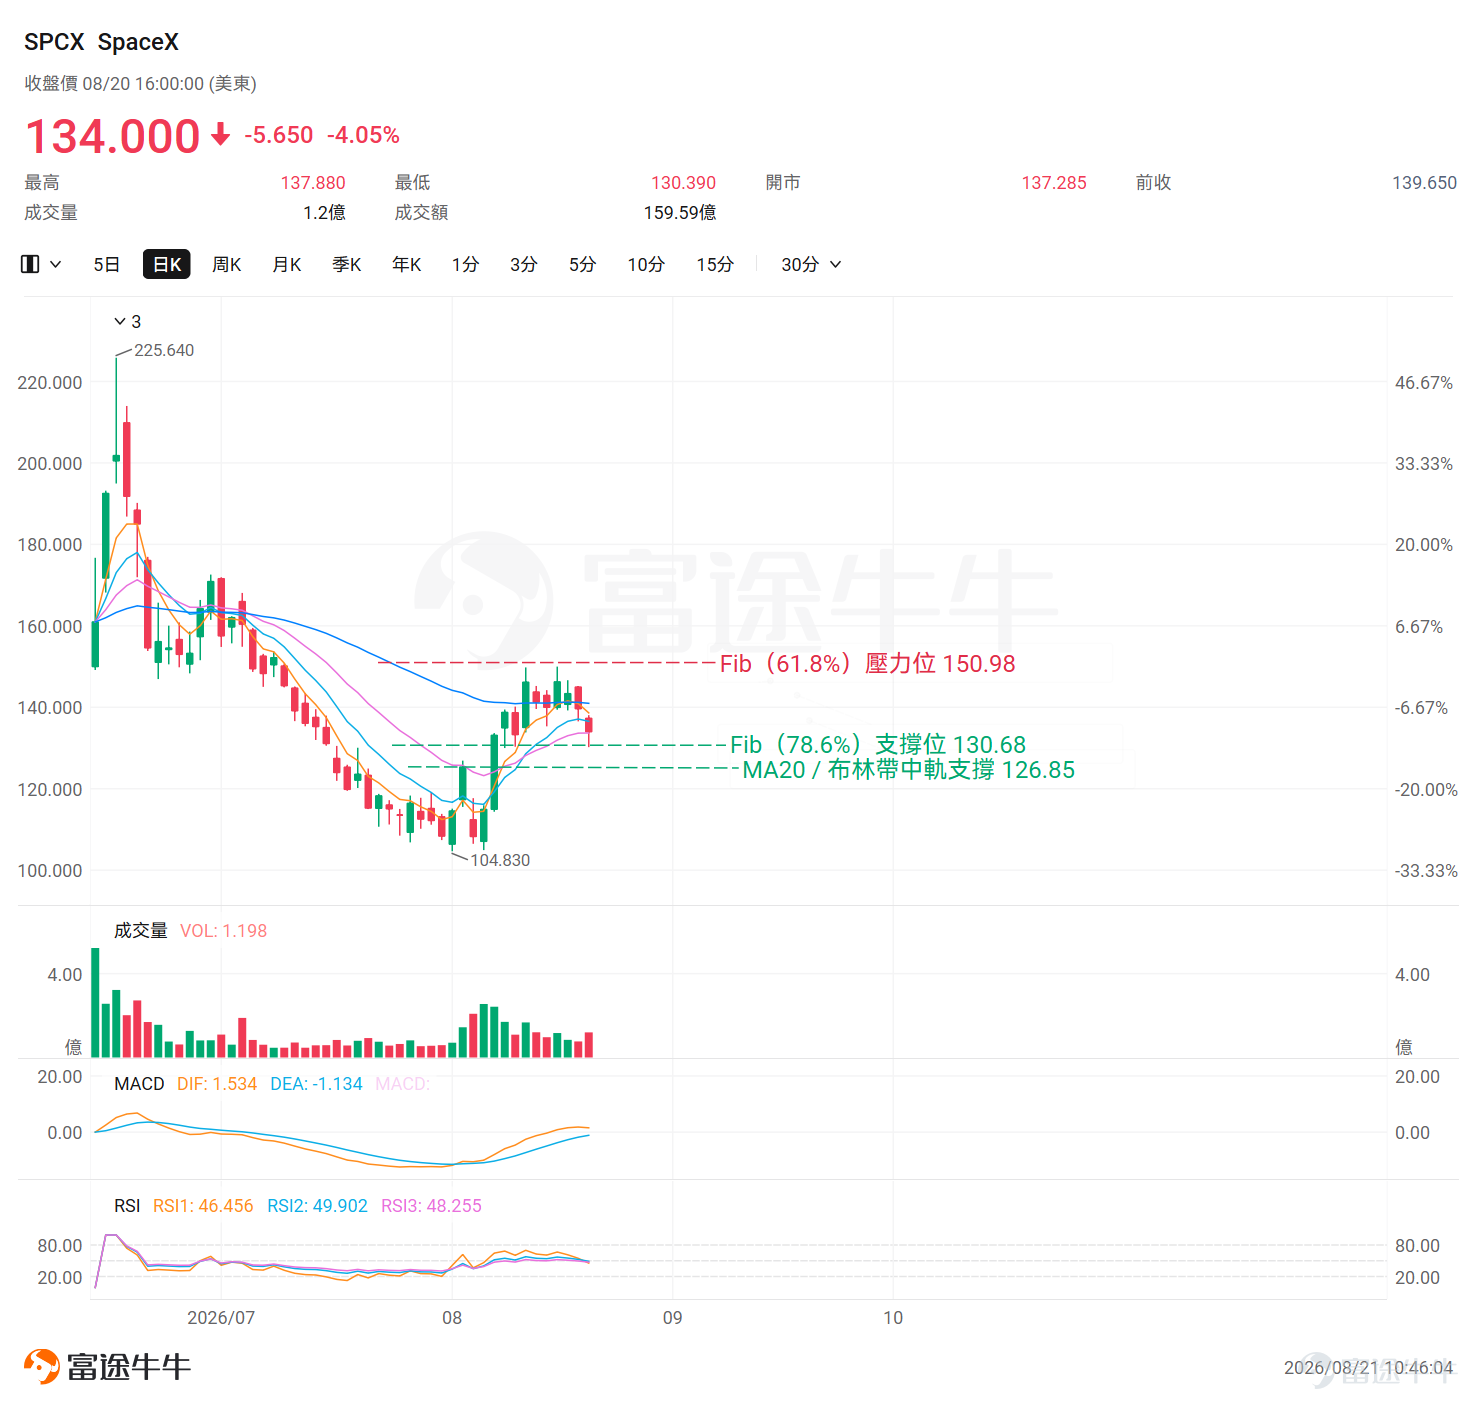
SpaceX's second wave of lock-up expirations is here; how should investors position themselves in spa

SpaceX's second round of restricted share lock-up expiration has taken effect. Can it replicate the upward trend seen after the first round?
$SpaceX (SPCX.US)$ Post-listingThe second tranche of restricted share unlock occurred on August 20, involving approximately 319 million shares, accounting for about 7% of the total restricted shares.On the day of the unlock, the stock price dipped to a low of $130.39 before recovering some losses, closing at $134. Looking back at the first unlock (August 6), SpaceX's initial share release did not trigger the sell-off feared by the market; instead, after three consecutive days of gains and just one day of consolidation, the price surged again to near the $150 psychological resistance level. This represented a cumulative gain of over 30% from the August 6 low within five trading days. Can SpaceX replicate the performance following the first unlock? Below, we will analyze the current key technical levels.
Recent stock price movement
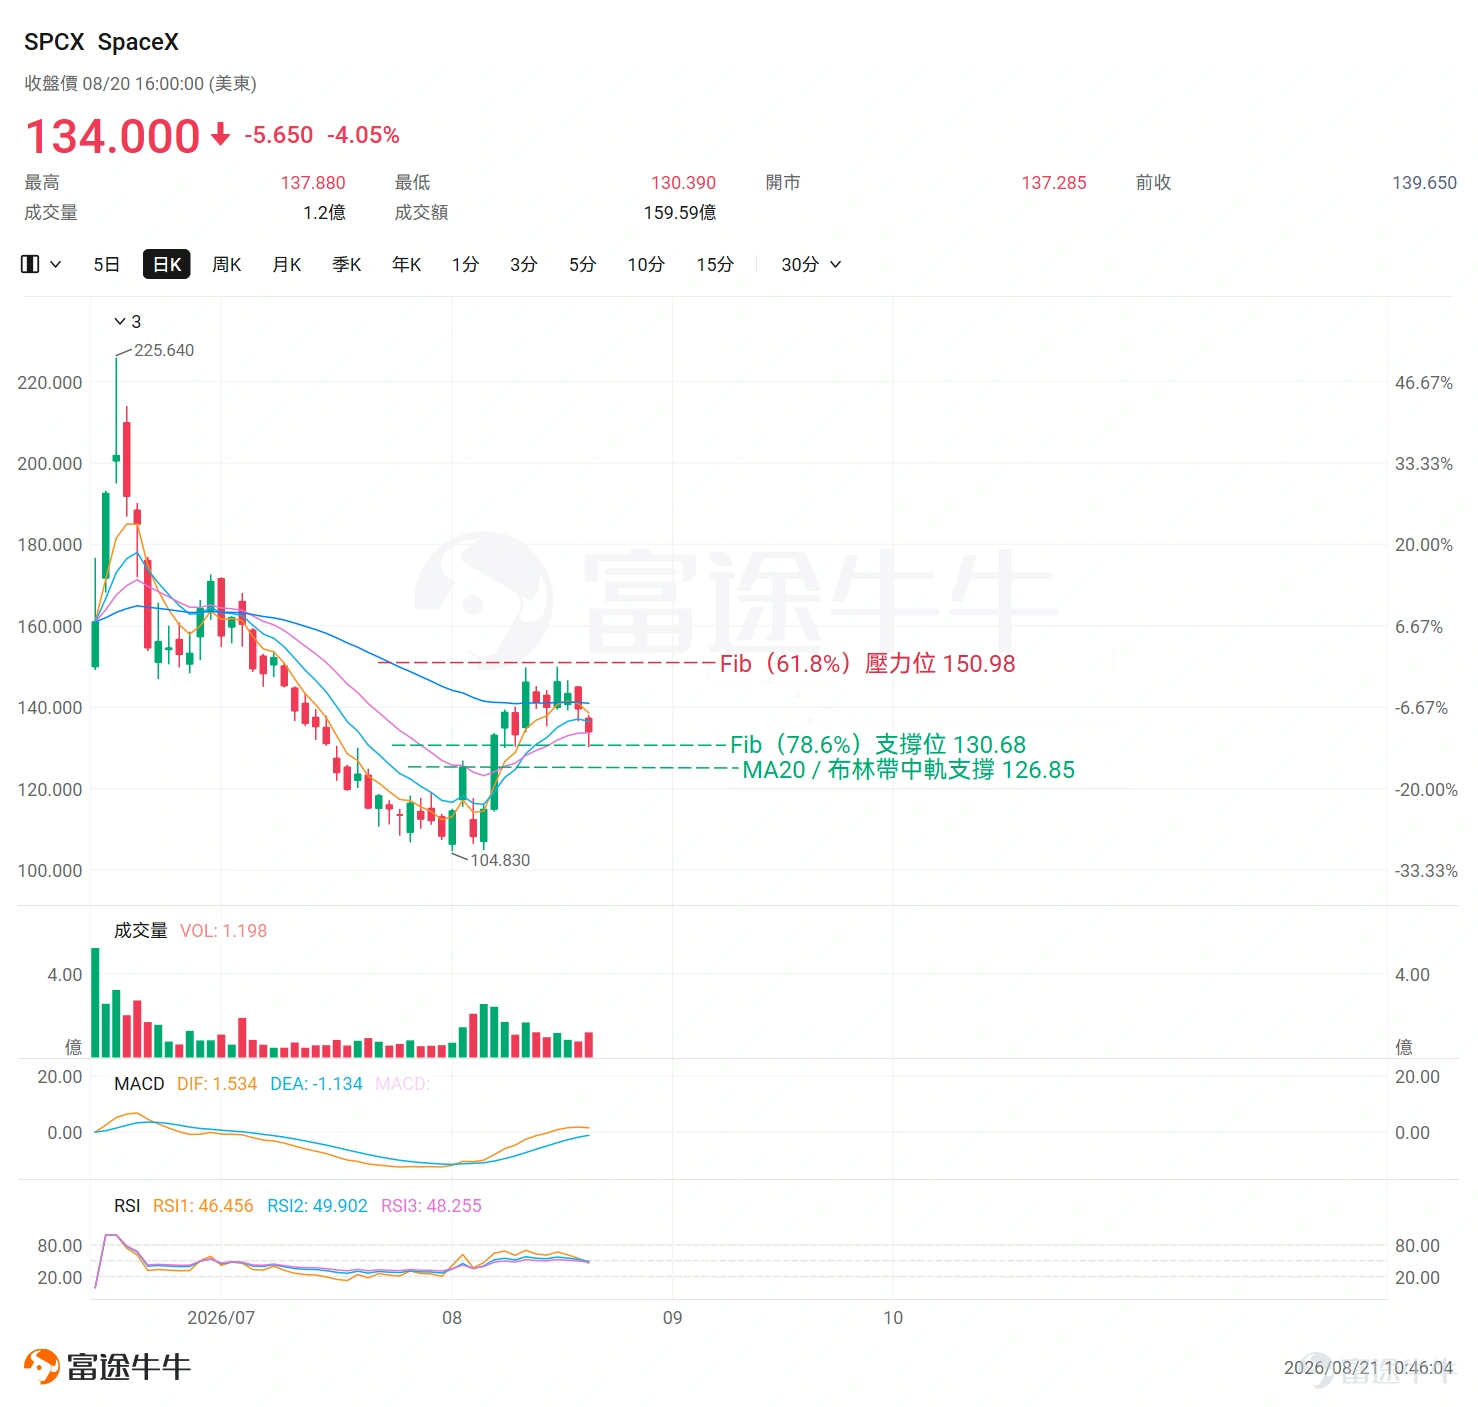
SpaceX is currently overallin a short-term oscillating uptrend, with a pullback and consolidation pattern observed at higher levels over the past four trading sessions.However, it is worth noting with caution that the current closing price of $134 has fallen back to near the 20-day EMA,with short-term momentum showing significant decay.Opened at $137.285 and closed at $134.0 on August 20, with short-term bearish momentum starting to build.Close monitoring is required to see if the price can stabilize within the key support range in the following session.
Key Technical Indicator Analysis
EMA Moving Averages:EMA5 is at $138.62, EMA10 at $136.55, and EMA20 at $133.68. The three lines remain in a bullish alignment, indicating that the upward momentum structure for the short-to-medium term has not yet been broken.
RSI:At 49.90, the indicator is in neutral territory, showing no overbought or oversold conditions and no significant divergence.
MACD:The MACD line (1.53) is above the Signal line (-1.13), confirming a golden cross with no divergence.
Bollinger Bands:The closing price of $134 lies between the middle band ($126.85) and the upper band ($153.93), with the stock price pulling back from highs and converging toward the middle band.
Fibonacci:The latest closing price of $134 is between the 78.6% Fibonacci level ($130.68) and the 61.8% level ($150.98)—with immediate support at $130.68 and resistance above at $150.98.
* Fibonacci retracement levels are automatically calculated based on the highest and lowest prices over the past 60 trading days, not manually selected swing points. Actual support/resistance effectiveness should be confirmed by market price action
Comprehensive assessment
On the support side,The nearest line of defense is at $130.68, corresponding to the 78.6% Fibonacci retracement level.If this level breaks,market attention will shift to the recent low of $130.39; further down lies $126.85, which corresponds to the Bollinger Bands' middle band as well as the MA20.The two factors create a certain level of resonant support.
On the upside, resistance lies at$149.80 represents clear resistance formed by the recent double top, while the nearby $150.98 corresponds to the 61.8% Fibonacci retracement level,Together, they form a dense resistance zone above; if the market rebounds and attempts to break through,the upper Bollinger Band at $153.93 will serve as the next layer of resistance reference.

Risk Disclaimer: The above content only represents the author's view. It does not represent any position or investment advice of Futu. Futu makes no representation or warranty.Read more

Comments (12)
to post a comment
36
37