Tesla Roadster release date set: Could this serve as another catalyst for the stock price?

📌 US stocks are struggling to rise further; will they fall? NVDA bullish engulfing buy point, MU target 1091 | Demi Pre-Market
It’s the third day of consolidation at high levels. The purple bands on the Nasdaq’s monthly, weekly, and daily charts are all pointing upward, indicating the major trend remains intact. However, short-term momentum has stalled. What investors fear most right now isn’t a drop, but not knowing how to react if one occurs! Demi has broken down the key levels for several stocks—take a look!
#NVDA There is resistance at 231.36 above and strong support at 217 below (a level validated in the previous period). Watch for two scenarios: If a bullish engulfing candle closes above the recent consolidation bearish candle, look for entry opportunities near 231; if the pullback continues, wait for stabilization near 217. Don't guess the direction; let the price action speak.

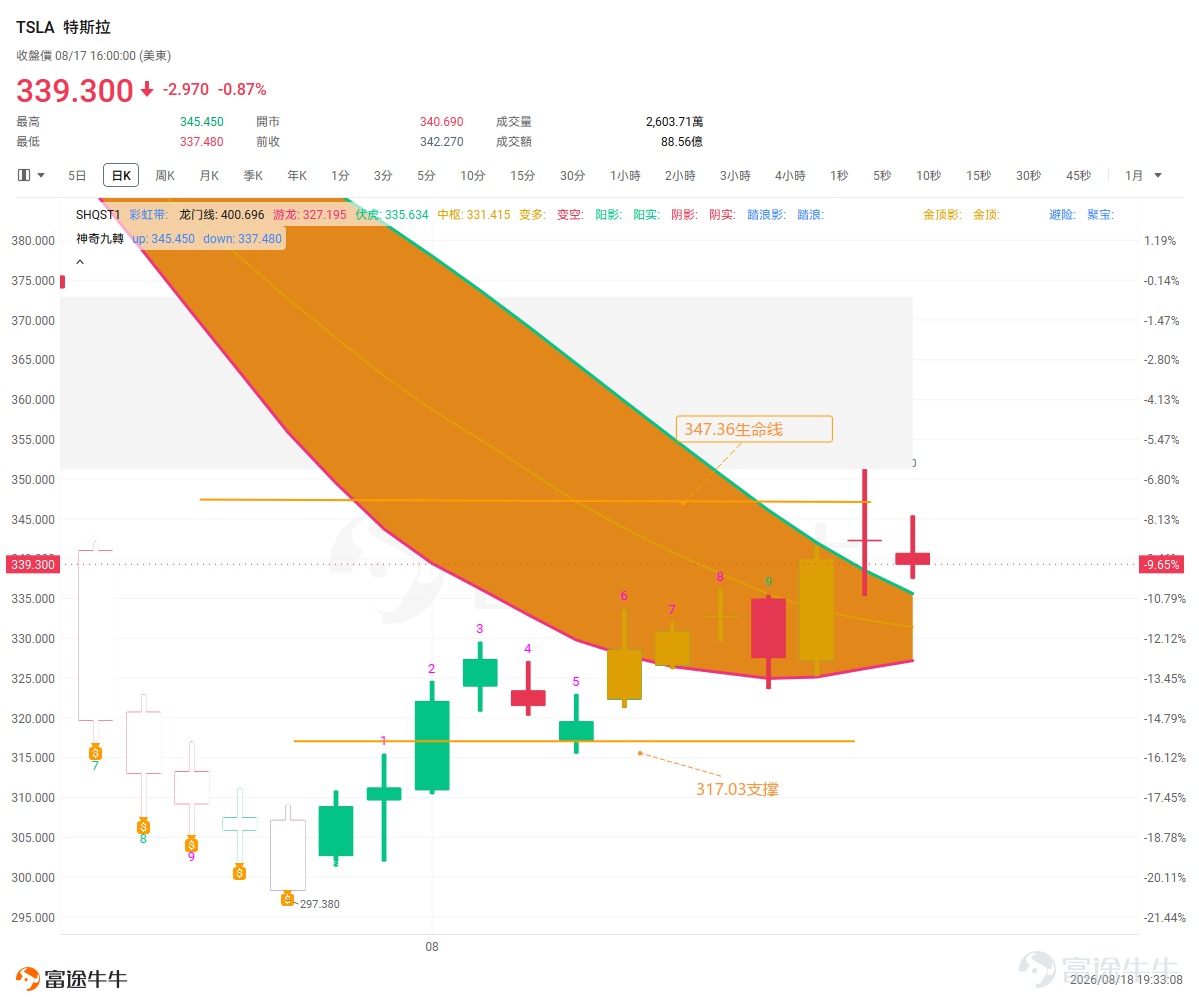
TSLA The 347.36 'life line' provided last time was breached intraday but failed to hold at the close, indicating the correction is not yet over. The good news is that the yellow band is narrowing rapidly, suggesting a potential trend change this week! Look for entry opportunities if it breaks above 347; if it continues downward, wait for support at 317.03!Demi will discuss the specific direction in Thursday's live stream.
MSFT The harami pattern played out as expected, closing lower. Pullbacks within the purple band present buying opportunities—near 469.4, you can enter directly if a bullish engulfing candle appears. If the drop is deeper, 427.07 is the second buy point, but this requires confirmation from trend-change signals.
MU The price has returned to the purple band with impressive upward momentum. Hold existing positions. There is resistance at 1,091.01; it may consolidate sideways or gap up directly. Reduce positions only when top-side pullback signals appear.
ORCL The 159.74 target from the previous update was hit precisely, pulling back directly to around 159. Set a stop-loss at 146.6; hold if it doesn't break. If it drops to around 135.02 and forms a bullish engulfing candle, you can buy back in.
This rally features a three-cycle resonance upward. The major trend remains intact. Consolidation at high levels is not scary; what is scary is not having a plan in advance on how to respond.
📌 Hit follow so you’ll be the first to see Demi’s next update!
Content Disclosure: Personal opinion
Risk Disclaimer: The above content only represents the author's view. It does not represent any position or investment advice of Futu. Futu makes no representation or warranty.Read more

Comments
to post a comment
11
1