SpaceX's second wave of lock-up expirations is here; how should investors position themselves in spa

SpaceX | Complete Analysis: Fundamental Logic + Candlestick Chart Resonance
⚠️ Risk Disclaimer: This content is solely a review of market logic and does not constitute investment advice. SPCX has a small float and extremely high volatility; please manage your position size carefully.
First, let's review the stock price structure:
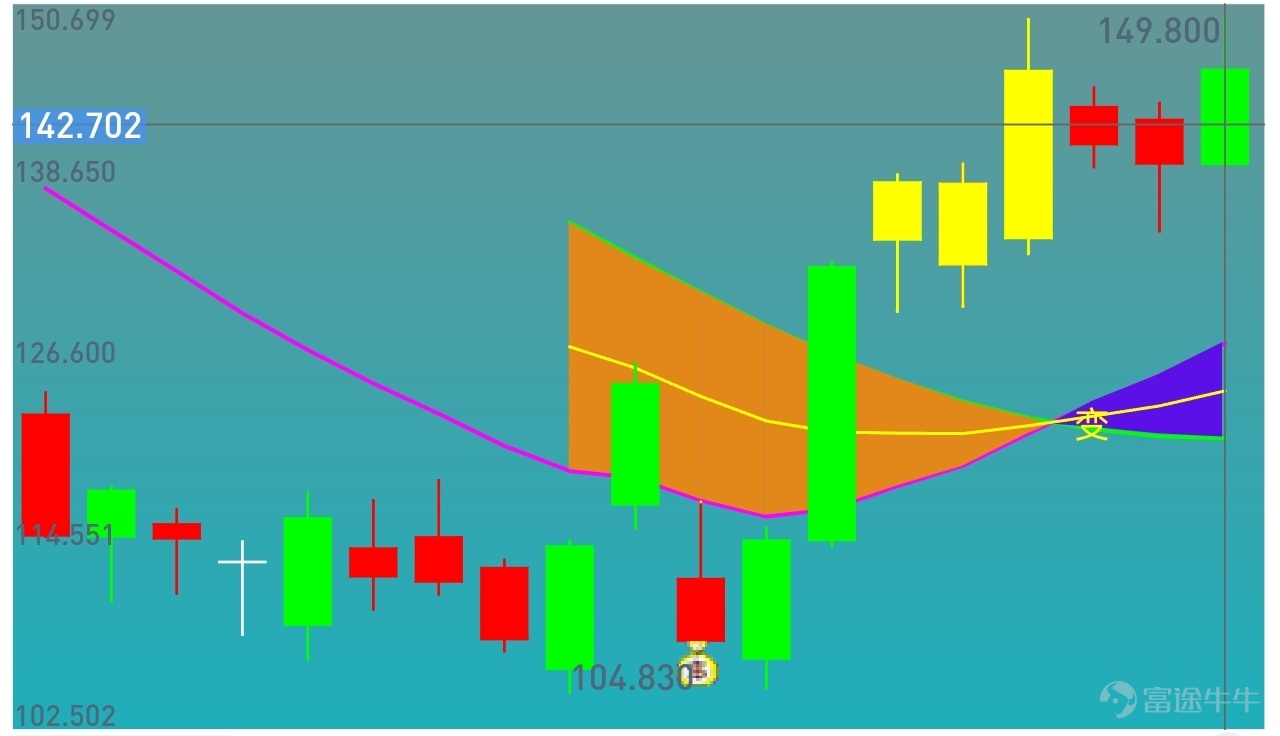
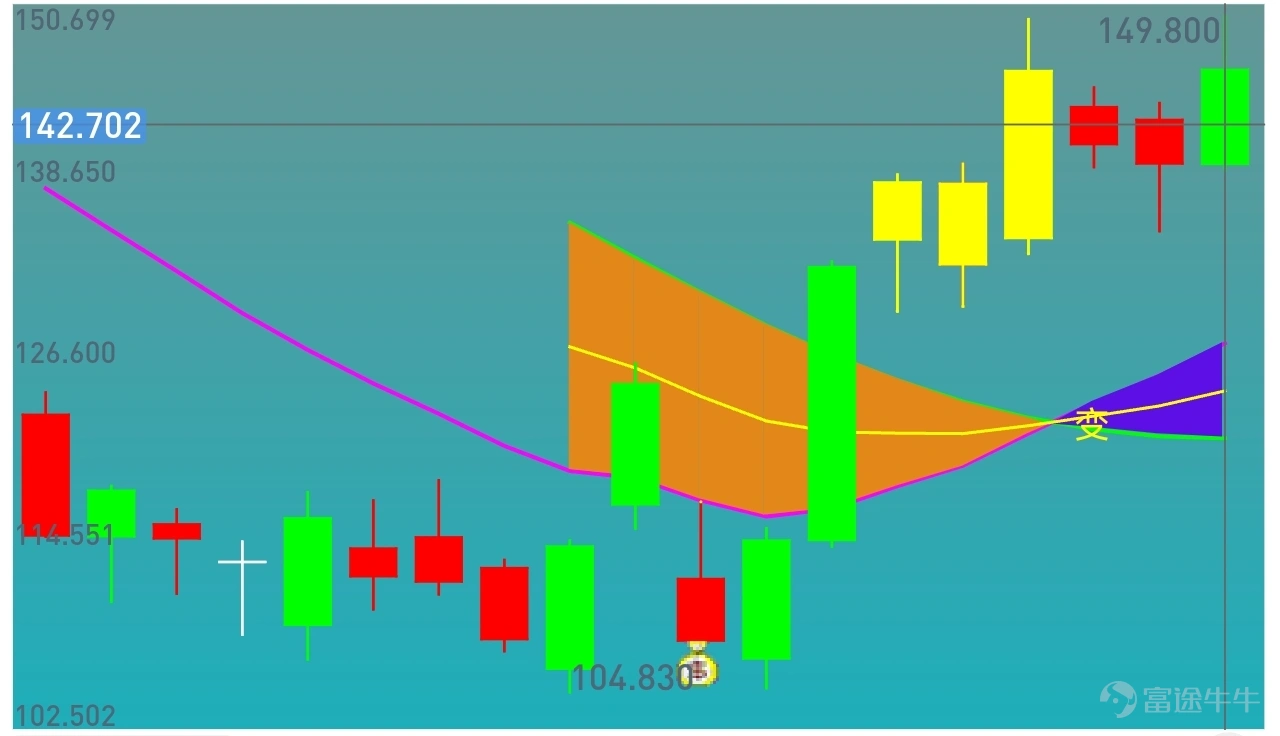
After listing, SPCX spiked and then retreated, undergoing a deep pullback from its highs. After bottoming out, it entered a phase of volatile consolidation and is currently trading within a rebound box following the decline.
Daily chart pattern: Trading within a consolidation range, with significant resistance from dense overhead trapped positions; support exists below. The characteristics are typical: news-driven pulse rallies without sustained unilateral trends, rising on positive news and falling on negative news, resulting in substantial volatility.
Volume characteristics: Volume surges and prices rally when positive news materializes; volume shrinks during news vacuums. Rally attempts often see stagnation amid heavy volume or pullbacks after highs.
Key price levels to watch:
✅ Support zone: $135–$138 (IPO price, institutional cost basis, key defensive level)
⛔ First resistance: $152–$156 (dense area of previously trapped positions, major short-term hurdle)
⛔ Strong resistance: $170. The rebound structure can only upgrade if prices hold above this level with significant volume.
⭕️ Three core fundamental logics directly correspond to market performance
1. Starlink (price floor, determines the lower bound support of the trading range)
Starlink is the only business consistently generating profits, truly acting as a cash cow.
In Q1 2026, Starlink revenue reached $3.26 billion with an operating profit of $1.19 billion. It has over 10,000 satellites in orbit, more than 9.2 million users, and coverage in 72 countries.
Market reflection:
Whenever the broader market plunges and tech stocks correct collectively, capital relies on Starlink's stable cash flow to absorb selling pressure near $135, defending the bottom of the trading range.
As long as there is no negative news regarding Starlink user data, ARPU, or overseas government contracts, the downside risk for a deep decline is effectively capped. Once positive business developments emerge, capital will revalue the company as telecommunications infrastructure, supporting a rebound in the stock price.
This is also the core underlying logic explaining why the stock price did not continue to hit new lows after this round of declines.
2. Starship V3 (a short-term pulse catalyst, causing significant intraday volatility)
The Falcon 9 rocket leads globally in reusability capabilities, and Starship V3 test flights are progressing steadily. The market is speculating on reduced satellite deployment costs, NASA deep-space orders, and defense aerospace contracts.
Market reflection:
Starship test flight windows and rumors of positive aerospace developments often trigger independent pulse rallies.
This primary theme operates independently of the AI sector's trends.
It frequently occurs that while NVIDIA and the computing power sector undergo corrections, SPCX rises independently driven by aerospace news;
Drawback: Purely event-driven; once positive news is realized, funds tend to take profits, leading to a spike followed by a pullback, making it difficult to sustain a major upward trend.
3. xAI computing power leasing (source of valuation elasticity, correlated with the AI sector, determining the height of the rebound)
xAI has been integrated into SpaceX, with the Colossus compute cluster leased long-term to Anthropic and Google, generating annualized rental income exceeding $26 billion. Wall Street’s pricing logic is shifting: from an aerospace manufacturer to an AI compute landlord plus space cloud provider, leading to a significant re-rating of its valuation.
Market Implications:
When the AI compute chain (NVIDIA and the compute leasing sector) strengthens collectively, capital tends to push up SPCX as a Musk-affiliated AI asset in tandem, testing the overhead resistance zone of 152–156.
⚠️ Common Pitfalls (frequently encountered in trading):
Not all compute capacity is leased out; Colossus 2 retains capacity for internal use to run Grok, and contracts include a 90-day termination clause.
Short-term traders are betting on cash flow expectations rather than requiring long-term locked-in orders. However, if the AI sector collectively retreats, this valuation logic will cool down rapidly, and rebound momentum will weaken accordingly.
Practical Summary Combining Technical Charts and Fundamentals
1. Do not blindly chase highs while the range-bound consolidation pattern remains intact.
The current price is in the middle of the trading range, offering an average risk-reward ratio.
If the resistance zone of 152–156 sees heavy volume but stagnant price action or long upper shadow candlesticks, a short-term pullback is highly likely.
Only with sustained heavy volume and a firm hold above 156 can we look to challenge the 170 level.
2. Market trends follow two distinct patterns; it is crucial to identify the underlying drivers.
• AI-led rally: A surge in the computing power sector → Bet on xAI computing power leasing, which offers the highest elasticity;
• Weak AI momentum: Short-term pulses driven by Starship aerospace news, with weak sustainability;
• Broad market systemic correction: Starlink earnings provide a floor, limiting downside risk, with support emerging at lower levels.
3. Key catalysts to monitor going forward (directly influencing the direction of K-line breakouts)
① Starlink's monthly user metrics and new overseas government contracts
② Progress in Starship V3 test flights and announcements of NASA aerospace orders
③ Overall sentiment in the AI computing power sector and the latest developments in computing power leasing businesses
④ Pace of lock-up expirations (changes in the float will alter the shareholding structure, posing potential volatility risks)
⚠️ Risk Alert: Computing power contracts contain termination clauses, making this a case of speculative hype;
Do not chase highs at elevated levels based solely on the AI narrative; focus on whether the resistance level at 156 can be effectively broken with increased trading volume.
$SpaceX (SPCX.US)$Risk Disclaimer: The above content only represents the author's view. It does not represent any position or investment advice of Futu. Futu makes no representation or warranty.Read more


Comments
to post a comment
7