Jensen Huang predicts sales will double next year, sparking a strong rebound in hardware stocks!

Sector Breakdown | AI Servers: Dell for Stability, Super Micro Computer for Elasticity
💡Core insight
The global server landscape has shifted from being dominated by traditional branded complete systems to...ODM Direct steadily accounts for half of total revenue, while JDM has become the mainstream model for top-tier CSPs in the AI era.OEMs are still primarily led by Dell, HPE, and domestic players like Inspur and Lenovo; white-label ODMs are dominated by ** contract manufacturers such as Quanta, Wiwynn, and Inventec. Due to the high density of optical modules, liquid cooling requirements, and rack-level complexity in AI servers, cloud providers and Nvidia are forced to engage in joint design with manufacturers starting from the chip stage.
Among key targets, Dell has the most complete business model and the highest order visibility, remaining favorable for the medium to long term, though its valuation is already significantly front-loaded. Super Micro Computer shows the strongest slope in orders and revenue growth with a relatively cheaper valuation, offering significant short-term elasticity but less long-term certainty than Dell. Lenovo is transitioning from a PC company to an infrastructure growth stock; while performance validation has been realized, short-term valuation appears overextended, suggesting continued consolidation in the near term.
▎ Classification of Server Manufacturers
Server manufacturers can be categorized into three types based on delivery models: OEM, ODM/ODM-Direct, and JDM.Understanding the evolution of these three models is a prerequisite for grasping profit distribution in the AI server supply chain and the strategic positioning of investment targets:Traditional enterprise procurement relies on branded complete systems and comprehensive after-sales services. Following the explosion of cloud computing, hyperscale customers shifted to direct procurement of white-label products to reduce costs. Meanwhile, AI rack-level systems have upgraded the contract manufacturing relationship to joint design involving chipmakers, cloud providers, and manufacturers.
OEM (Branded System Integrators)
OEMs sell standardized complete systems to end customers and provide a full suite of after-sales services, including hardware, BIOS, management software, and on-site operations and maintenance. Customers are not just buying a machine, but a bundled package of products and service capabilities from the brand. Among global leaders, $Dell Technologies (DELL.US)$Dell is the leader in the general-purpose server and enterprise market, with its flagship product being the PowerEdge series;$Hewlett Packard Enterprise (HPE.US)$HPE focuses more on enterprise-level solutions, hybrid cloud, and high-performance computing (HPC), corresponding to its ProLiant series.。
Among domestic and regional leaders in China,$LENOVO GROUP (00992.HK)$Lenovo combines traditional enterprise OEM business with its ThinkSystem/ThinkAgile operations catering to Tier-1 cloud providers;$Inspur Electronic Information Industry (000977.SZ)$Inspur is the market share leader for servers in mainland China, with significant advantages in the traditional enterprise and state-owned enterprise cloud sectors; $ZTE (00763.HK)$ ZTE and H3C are the primary OEM suppliers for domestic telecom operators, as well as the financial and government-enterprise markets.
ODM/ODM-Direct (White-Label)
In the ODM model, contract manufacturers independently design generic circuit boards and chassis architectures, selling directly to cloud providers or data centers and bypassing branded vendors. These are also known as white-box servers—lacking traditional brand logos—and are sold in bulk directly by third-party original design manufacturers according to demand. In the traditional IT era, enterprises mostly purchased servers from Dell or HPE because they required their hardware and software technical support;Following the boom in cloud computing, white-box servers rapidly became mainstream.。
There are two main drivers. First, hyperscale data centers such as AWS, Microsoft Azure, Google, and Meta purchase hundreds of thousands of servers annually. If they were to adopt traditional branded machines exclusively, the costs would be prohibitively high.White-box servers can help them save tens or even hundreds of billions of dollars in hardware expenditures.Second, the premium on branded machines includes operation and maintenance software, monitoring tools, and technical services. However, major tech firms possess top-tier engineering teams, as well as proprietary underlying operating systems and distributed monitoring and O&M systems, which can partially replace the software and after-sales services provided by brand vendors.
** contract manufacturers are the main force in the ODM-Direct segment.Quanta/QCT is the absolute global leader in white-label servers, with its subsidiary QCT specializing in providing standardized ODM white-label racks and server boards to Tier-2/Tier-3 clients. Wistron NeWeb Corporation (WNC), spun off from Wistron, is a pure-play ODM-Direct giant focused on cloud data centers, with the vast majority of its revenue derived from white-label/hyperscale procurement. Inventec is one of the world's largest suppliers of server motherboards, long providing standard board ODM services to major clients. Gigabyte, ASUS/ASRock, and Lieyun focus on high-density GPU workstations, SMBs, and customized ODM white-label servers.
JDM (Joint Design Manufacture)
With the widespread adoption of AI servers based on architectures such as Nvidia DGX/HGX/GB200, the form factor of white-box servers has undergone significant changes,and technical complexity has surged dramatically: featuring ultra-high-density 1.6T optical modules, complex copper cable topologies, power consumption exceeding 100kW per rack, and liquid cooling systems,These developments have gone beyond the simple design scope of traditional 'pure white-label contract manufacturing.'Cloud vendors and chipmakers (such as Nvidia) collaborate with white-box contract manufacturers on co-design starting from the chip R&D phase.This is currently the most mainstream model for AI servers and top-tier CSPs.: Clients (such as Meta, Google, Microsoft, and Nvidia) provide architecture, algorithms, and network topology requirements, while contract manufacturing giants handle engineering, board-level circuitry, and the implementation of data center liquid cooling and thermal management, jointly developing and sharing IP or proprietary designs.
Among the global top-tier JDM leaders,$Foxconn Industrial Internet (601138.SH)$/Hon Hai (Foxconn) is a giant in precision manufacturing and system integration, deeply involved in the JDM development of Nvidia DGX/HGX/NVLink rack systems, possessing vertical capabilities ranging from connectors and UBB/OAM boards to NVL72 rack-level complete units (L11/L12); Quanta is deeply engaged in the joint development of the Nvidia GB200 platform and Meta/Google architectures, serving as a core player in the JDM development of AI racks and liquid cooling systems; Wistron holds a core share in the JDM manufacturing of Nvidia's high-end GPU accelerator boards (UBB), while WNC collaborates closely with Microsoft and Meta on JDM architecture for the Open Compute Project (OCP). Domestically,$Unisplendour Corporation (000938.SZ)$/H3C is one of the few domestic vendors that combines traditional OEM channels with full-stack JDM customization for internet giants like Baidu, Alibaba, and Tencent, such as custom racks and liquid cooling systems based on OpenPaaS.
Market Share
In recent years, ODM Direct has steadily accounted for 50%–60% of global server revenue(exceeding 60% in some quarters), primarily driven by direct procurement from hyperscale clients such as Amazon, Microsoft, Google, and Meta from **/Mainland Chinese ODMs. IDC data shows that in Q1 2026, the overall ODM share50.2%, Dell accounts for16.5%(AI acceleration servers showed outstanding performance, with a significant recent increase in market share), Super Micro Computer at 7.6% and Lenovo at 4.6%. Within the ODM sector,Quanta's market share remains steady at 15%–25%,consistently ranking first,and is projected to account for 36% of total ODM shipments by 2026., with even more pronounced advantages in AI servers.
▎🔍 Key Investment Targets
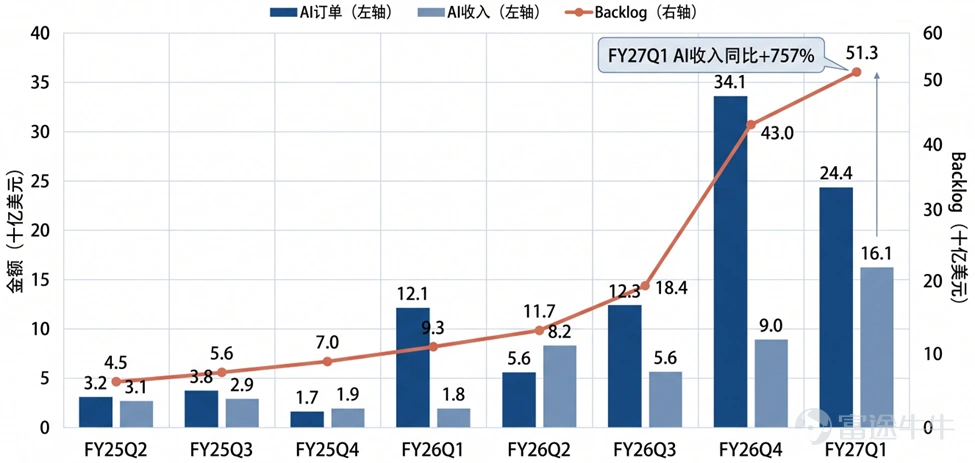
Dell is the company with the most complete business model, the highest order visibility, and the strongest ability to absorb component price increases.Its core advantage lies not just in AI servers, but in embedding them into a comprehensive enterprise infrastructure ecosystem encompassing traditional servers, storage, networking, maintenance, and support,thereby transforming low-margin single-unit sales into platform-based revenue.Server and PC revenues each account for approximately half of the total, with servers holding a larger share and experiencing rapid growth; PCs (CSG) remain the foundational business, but their growth rate is significantly lower than that of ISG. Server revenue in Q1 increased year-over-yearby +181%At the end of the period, the AI server backlog reached$51.3 billion;the midpoint of the 2026 AI server revenue guidance was raised from $50 billionto $60 billion,with traditional server growth expected to be slightly above 60%.This implies that Dell is not solely benefiting from the "AI volume ramp-up," but is simultaneously gaining from AI, traditional servers, and enterprise inference and agent-based AI infrastructure upgrades.
The second layer of advantage is service attachment: AI server gross margins are generally only in the low-to-mid single digits, whereas traditional servers, bolstered by software, services, and maintenance contracts, deliver profitability roughly twice that of AI servers. Dell's software and services revenue accounts for approximately 22%, significantly higher than Super Micro Computer's 1%–2%, supported by stronger team and channel capabilities.As the industry shifts from experimental phases to enterprise production deployment,Dell's advantage lies not in who delivers GPU boxes first, but in who can provide comprehensive solutions that are maintainable, scalable, operable, and auditable.
The third layer of advantage stems from supply chain management and price pass-through. Rising memory costs are a shared pressure across the hardware industry in 2026; HPE has warned of a potential 1–2 percentage point decline in PC margins. Dell, leveraging its procurement scale, supplier relationships, and pricing windows,Regarded as one of the OEMs best positioned to recoup approximately two-thirds of raw material cost increases within 90 days, in an environment where DRAM, NAND, and CPU supplies remain tight, this capability simultaneously determines gross margins and order lock-in.
In terms of valuation, the forward P/E ratio for the next fiscal year has risen from 14x in early May this yearto the current 21x, with the market having partially priced in the shift of AI orders, ASP increases driven by supply shortages, and traditional server demand exceeding expectations.However,We remain bullish on the medium to long term, especially as demand for CPUs continues to strengthen in scenarios such as AI inference and agents, while sustained growth in corporate IT spending will provide stronger growth momentum for Dell.。
Chart 1: Trends in Dell's AI Server Orders, Revenue, and Backlog
Source: Company financial reports
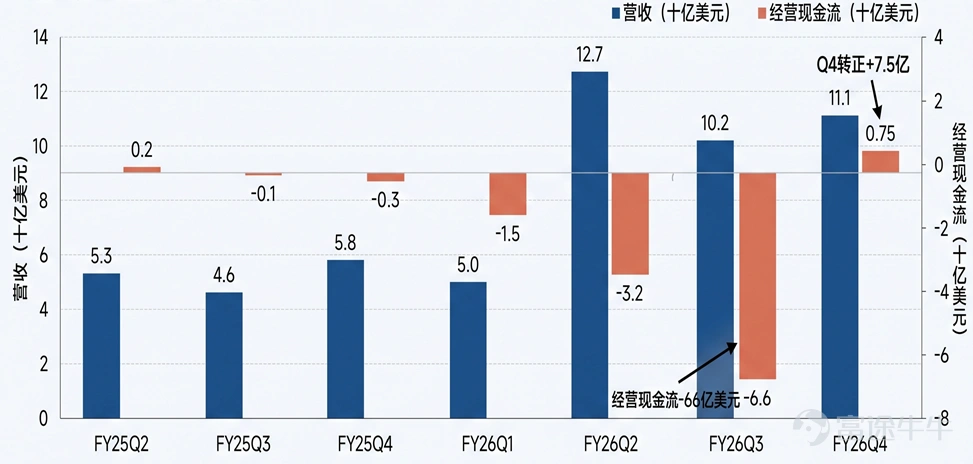
Judging by the slope of orders and revenue,SMCI is likely the strongest AI server manufacturer.Q4 revenue reached $11.12 billion, up 93% year-over-year; Non-GAAP gross margin was 17.6%, exceeding the previously guided range of 15%–17%. Q4 new orders exceededUSD 60 billion, pushing the backlog to a record high entering FY27; FY27 revenue guidance$65–72 billion, significantly surpassing the prior consensus estimate of approximately $54.4 billion. The current P/E ratio is around 10x and the P/B ratio is 2x,indicating reasonable valuation with strong short-term elasticity.。
Key long-term risks include three main points: First, significant pressure on cash flow and working capital, with ending inventoryrising to $12.9 billion, and total debt plus convertible bonds amounting to approximately $8.7 billion. Larger orders require upfront component procurement and inventory tie-up, which may not necessarily translate into higher shareholder returns; second, dilution is a real concern. The company has issued $4.2 billion in mandatory convertible preferred shares and raised up to $7 billion in June for component procurement. Relative to a market cap of approximately $20 billion,future EPS growth must outpace equity expansion to truly create value;third, there is opacity regarding order quality and fulfillment. The $60 billion in orders is not entirely composed of non-cancellable, firm commitments. Delays by some customers in power supply, cooling, and networking infrastructure have already impacted revenue recognition.While the order backlog is substantial, there remains significant uncertainty regarding revenue recognition timing, gross margins, and working capital requirements. Its long-term visibility is inferior to that of Dell.
Chart 2: Super Micro Computer's Quarterly Revenue vs. Operating Cash Flow
Source: Company financial reports
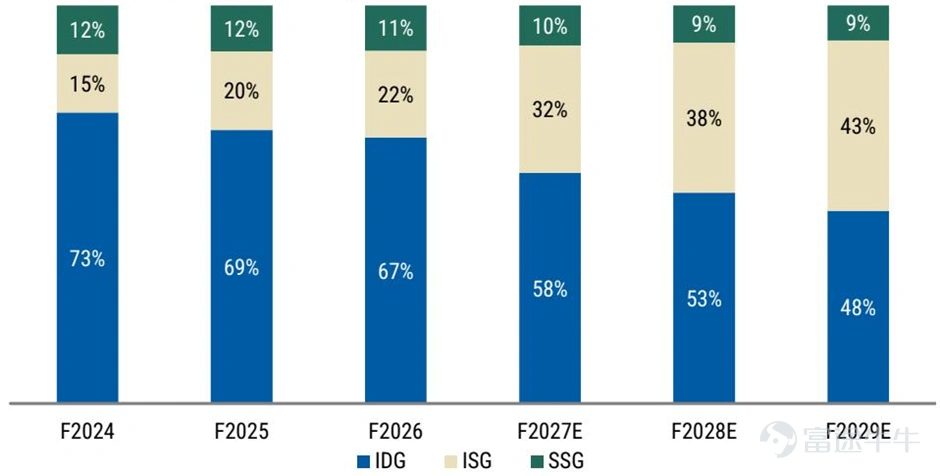
Among Lenovo's three major business segments, IDG (PCs and other smart devices) contributed 71% of revenue in the last fiscal year, leading in global market share; ISG (servers and software) accounted for 23%; and SSG (IT and operations services) made up 12%, boasting the highest operating margin of over 20%. The market has long viewed it primarily as a PC company, but by 2026, Lenovo is increasingly resembling a portfolio asset combining a "PC cash flow platform," an "ISG high-growth engine," and an "SSG high-margin sticky business."The primary investment value lies not in PCs, but in ISG's transition from scale growth to profit realization, thereby reshaping the group's earnings structure and valuation framework.ISG's revenue share is expected to rise from 22% in FY2026to 43% in FY2029,with its profit contribution moving from near break-evento approximately 41% of the group's total profits,,the valuation anchor will gradually shift from "PC OEM" to "infrastructure growth stock."。
Chart 3: Revenue Contribution by Lenovo's Business Segments
Source: Company financial reports, Bloomberg
Strong latest quarterly performance: IDG operating margin stabilized at 7.1%, global PC market share reached 24.2%, widening the lead over the second-place competitor; ISG revenue hit a new quarterly high, with operating margin improving from -2.0% in the same period last yearto +9.1%, AI server project backlog increased to$54 billion,, up 157% quarter-over-quarter; the company is advancing GB300 deployment and accelerating the commercialization of Vera Rubin rack-level solutions; SSG's operating marginrose to a new high of 24.2%, continuing its transition toward high-value, recurring revenue.
Lenovo has shifted from an "expectations gap trade" to a "performance validation trade" around its earnings report. Since FY27 Q1 results and the AI order backlog significantly exceeded expectations, the bullish thesis remains intact, although short-term overextension has increased markedly. The current P/B ratio has reachedsevenfold, significantly higher than peers, with sideways movement expected in the near term.
💡Peer Comparison
Super Micro Computer is relatively cheaply valued but carries higher risk, presenting short-term trading opportunities.Dell's fundamentals remain among the strongest, but its valuation and expectations are already significantly priced in. Going forward, it is more of an asset that requires sustained earnings beats to continue rising.
⚠️Risk Warning
- Component price increases exceeded expectations
- AI capital expenditure fell short of expectations
[Investment Advisory Information]
Yang Yi, Licensed Representative, CE No.: BUR210
Disclaimer
This report is prepared by Futu Securities International (Hong Kong) Limited (“Futu Securities”). Without the prior written consent of Futu Securities, this report and the information contained herein may not be (i) reproduced, photocopied, or stored in any form, or (ii) directly or indirectly distributed or forwarded to any other person for any purpose. The information in this report is derived from sources that Futu Securities believes to be accurate and reliable at the time of publication; however, this report is not intended to contain all information necessary for investors and may be subject to delays, obstacles, or interruptions. Futu Securities makes no express or implied warranties or representations regarding the sufficiency, accuracy, completeness, reliability, or fairness of such information or opinions. Accordingly, Futu Securities and its affiliates (collectively, the “Futu Group”) shall not be liable for any type of loss (including but not limited to any direct, indirect, or consequential losses) arising from any actions taken by third parties in reliance on the contents of this report. The views, recommendations, suggestions, and opinions expressed in this report do not necessarily reflect the positions of Futu Securities or its affiliates and are subject to change without notice; Futu Securities has no obligation to provide updates on such information or opinions. This report is provided for general informational purposes only and is intended for general review by clients of Futu Securities, without consideration of any specific recipient’s particular investment objectives, financial situation, or special needs. No information or opinion contained in this report constitutes or should be regarded as an offer, recommendation, or solicitation by any member of the Futu Group to purchase or sell any securities, related investments, or other financial instruments, nor shall it be construed as an offer or invitation to buy or sell securities. Any decision to purchase the securities mentioned in this research report should take into account existing public information, including any prospectus relating to such securities. The products mentioned in this report may not be suitable for all investors. Readers of this report should fully consider relevant factors and seek professional advice before making any investment decisions. This report is provided to a recipient on the basis that the recipient is deemed capable of independently assessing investment risks and exercising independent judgment in making investment decisions. In certain jurisdictions or countries, the distribution, issuance, or use of this report may contravene local laws, regulations, rules, or other registration or licensing requirements. This report is not intended for distribution to or use by any person or entity in such jurisdictions or countries. Investors in Hong Kong with any questions regarding Futu Securities’ research reports should contact Futu Securities directly. The Central Entity Number of the author’s license held with the Securities and Futures Commission of Hong Kong is disclosed next to the author’s name on the front page of the report. The analyst primarily responsible for preparing this report confirms that (i) the opinions expressed in this report accurately reflect his/her personal views on the listed corporations commented upon in this research report; and (ii) no part of the compensation he/she has received in the past, currently receives, or will receive in the future is directly or indirectly related to the specific recommendations or views expressed in this report. The analyst confirms that neither the analyst nor his/her associates have traded in the listed corporations and their related securities mentioned in the report within 30 days prior to the release of the research report and within three business days after its release. Neither the analyst nor his/her associates serve as senior executives of the listed corporations commented upon in this research report, nor do they hold any financial interests therein. In this report, Futu Securities does not hold any financial interest amounting to 1% or more of the market capitalization of the listed company, and has had no investment banking relationship with the company in the past 12 months. Employees of the Company are not employees of the listed company.
Risk Disclaimer: The above content only represents the author's view. It does not represent any position or investment advice of Futu. Futu makes no representation or warranty.Read more

Comments
to post a comment
3
6