
MicroStrategy sells Bitcoin without price drop; is the STRC rebound truly bullish?
Author: SpecialistXBT
A silent market is frightening.
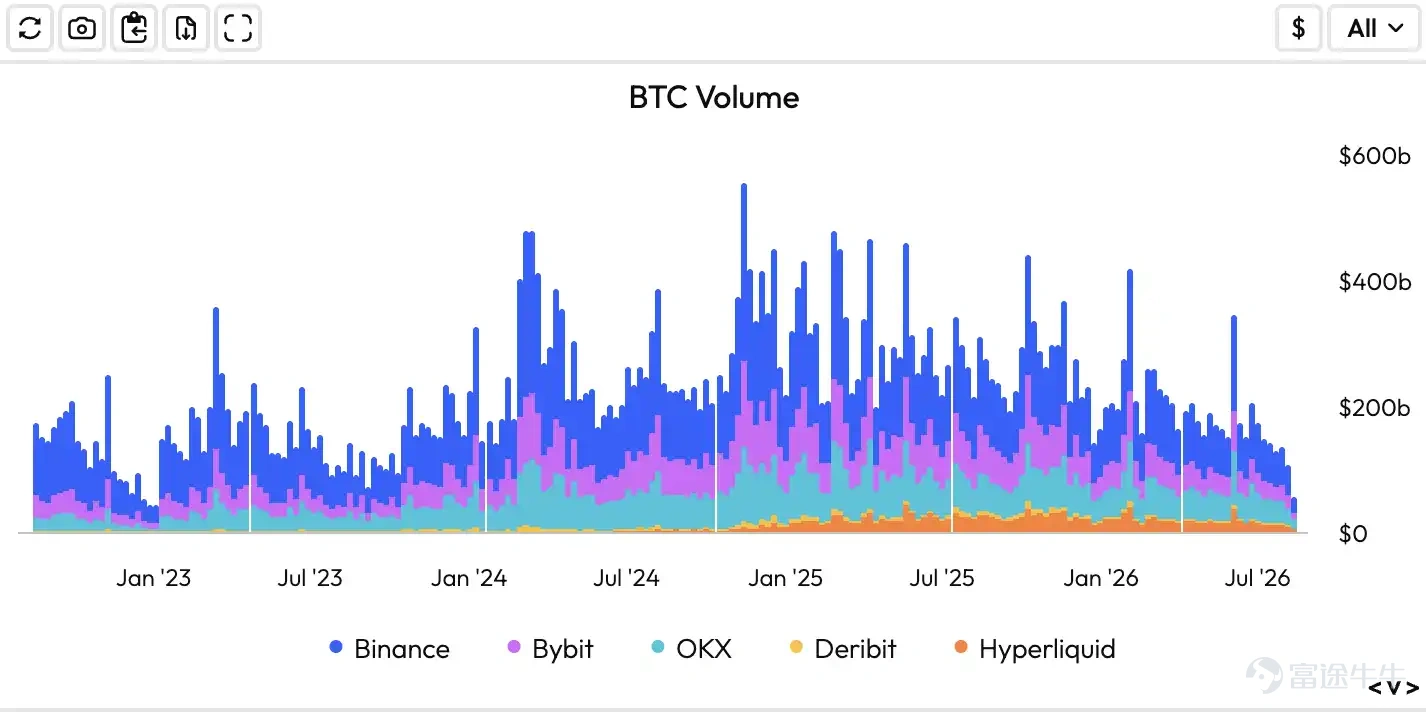
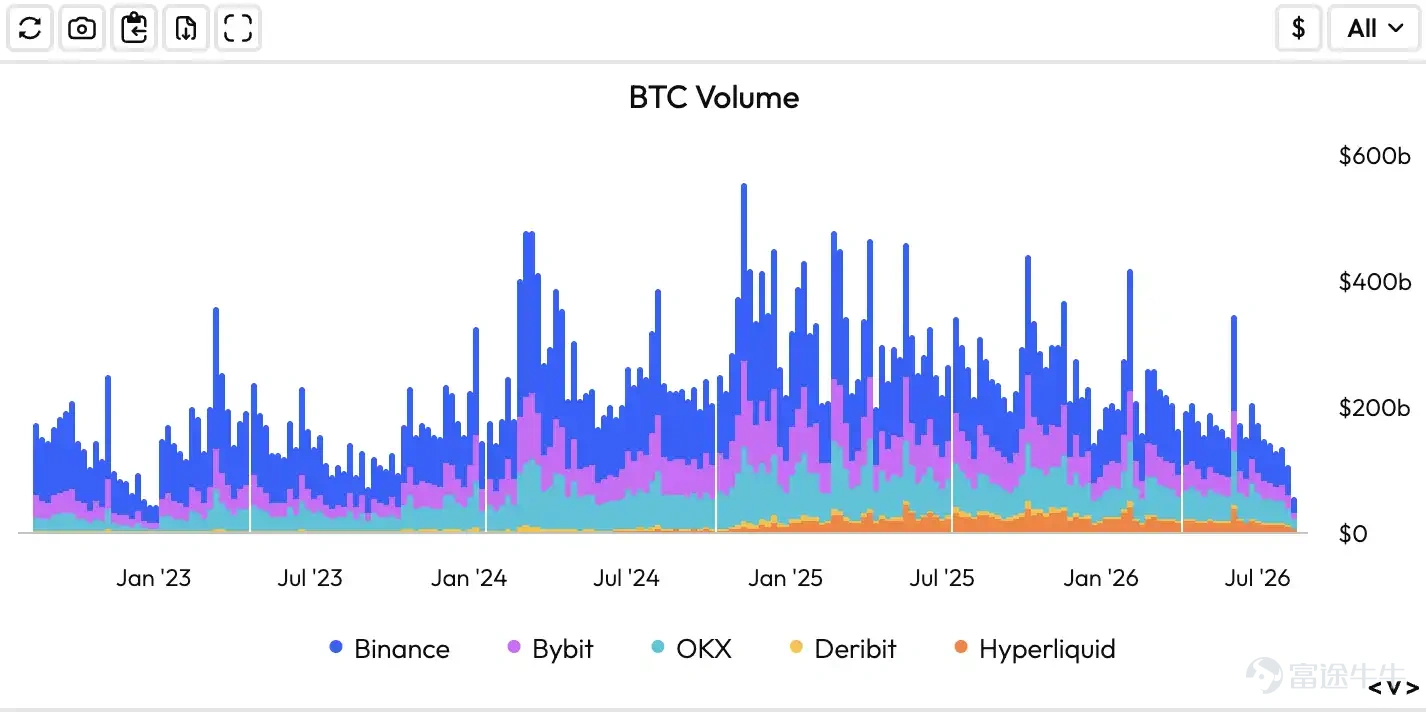
BTC weekly trading volume has dropped to its lowest level since 2023. Deribit's BTC Volatility Index (DVOL) also hit bottom last week.
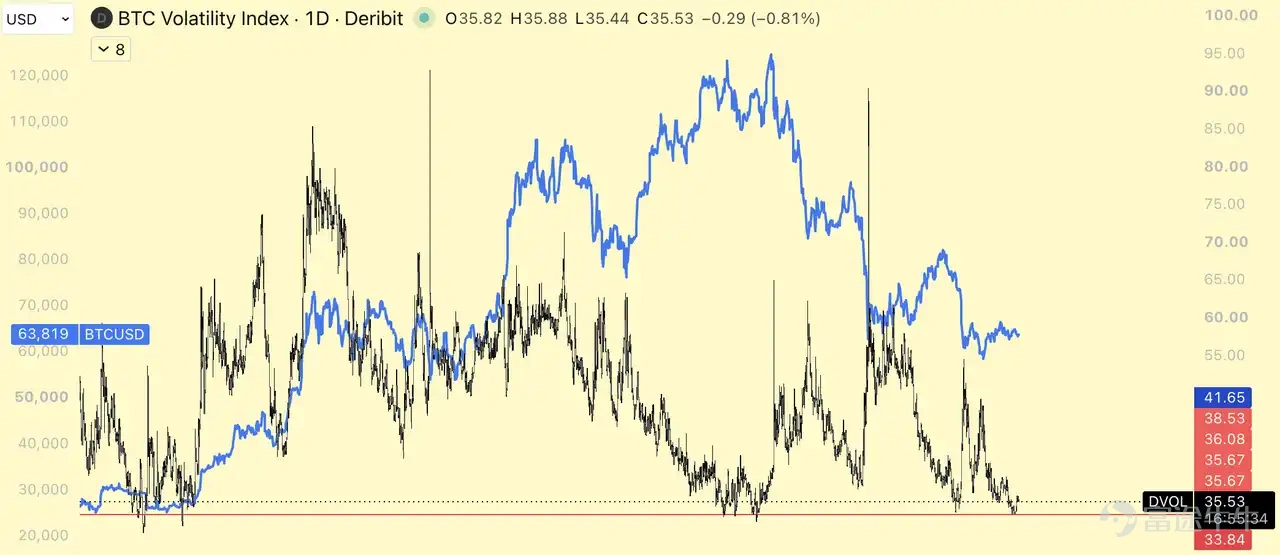
Liquidity is also insufficient. At 20:30 last night, when the CPI data was released, BTC quickly fell from $64,450 to $64,100, then rebounded to around $64,300 before declining again.
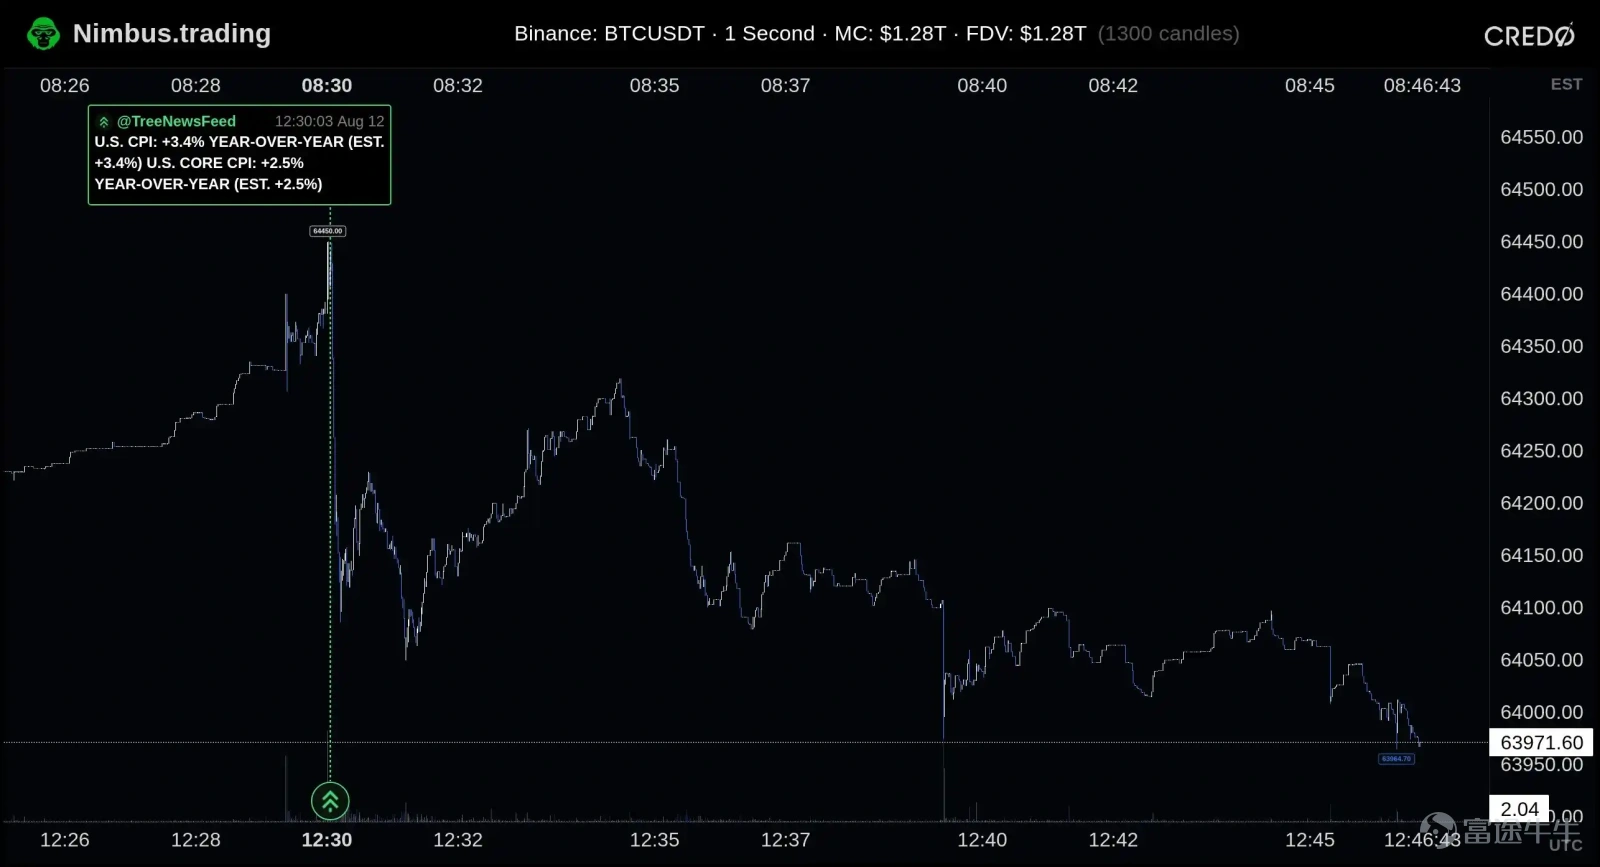
An hour later, when the US stock market opened, there were few BTC participants. Aside from brief capital flows driven by cross-market arbitrage, the market failed to establish a new direction. Current BTC prices are easily moved, but there are not enough traders willing to sustain the momentum.
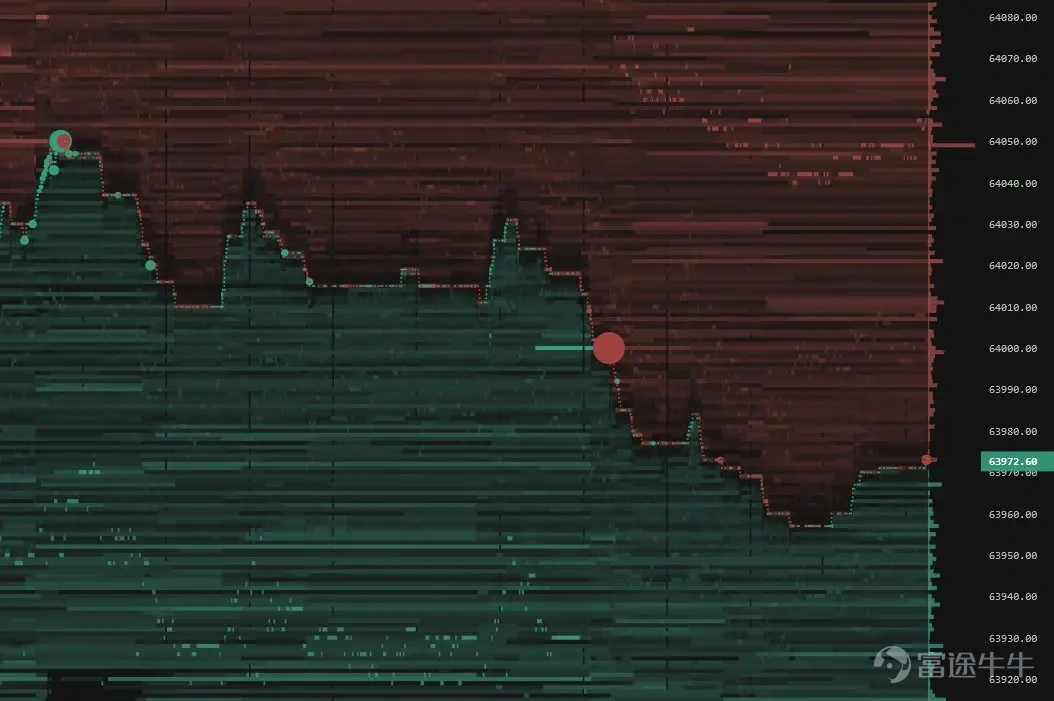
The market is lacking more than just bullish or bearish news.
It is lacking participants.
Let's take another look at the options data.
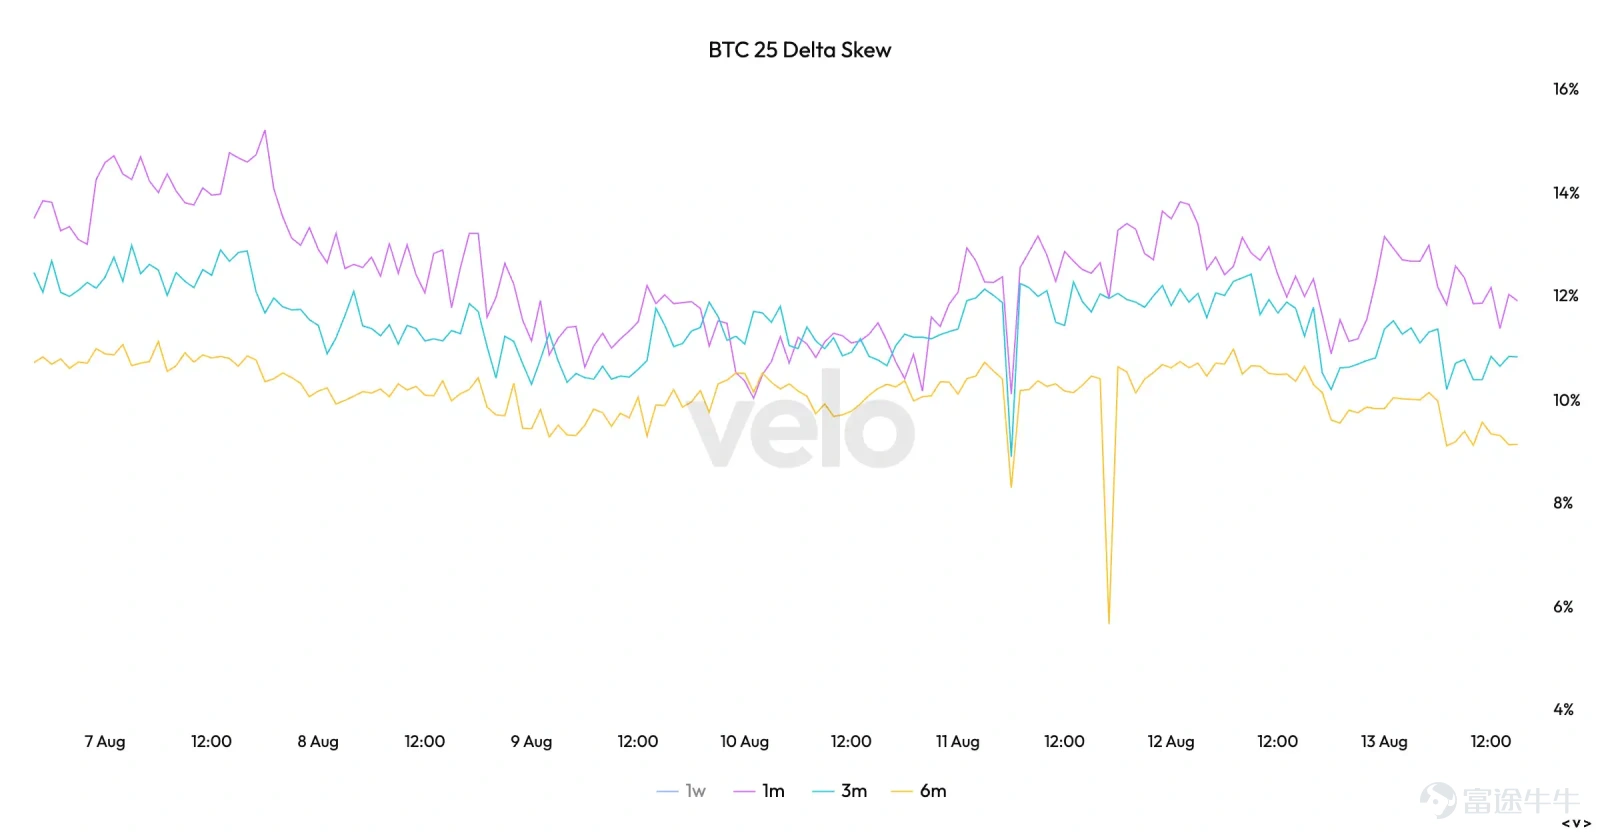
The BTC 25-delta skew measures the implied volatility difference between put and call options with similar deltas. The curves for one-month, three-month, and six-month tenors in the chart are all in positive territory, at approximately 12%, 10.7%, and 9.1%, respectively. The shorter the tenor, the higher the skew. Traders' demand for short-term downside protection is significantly higher than the pricing of longer-term risks.
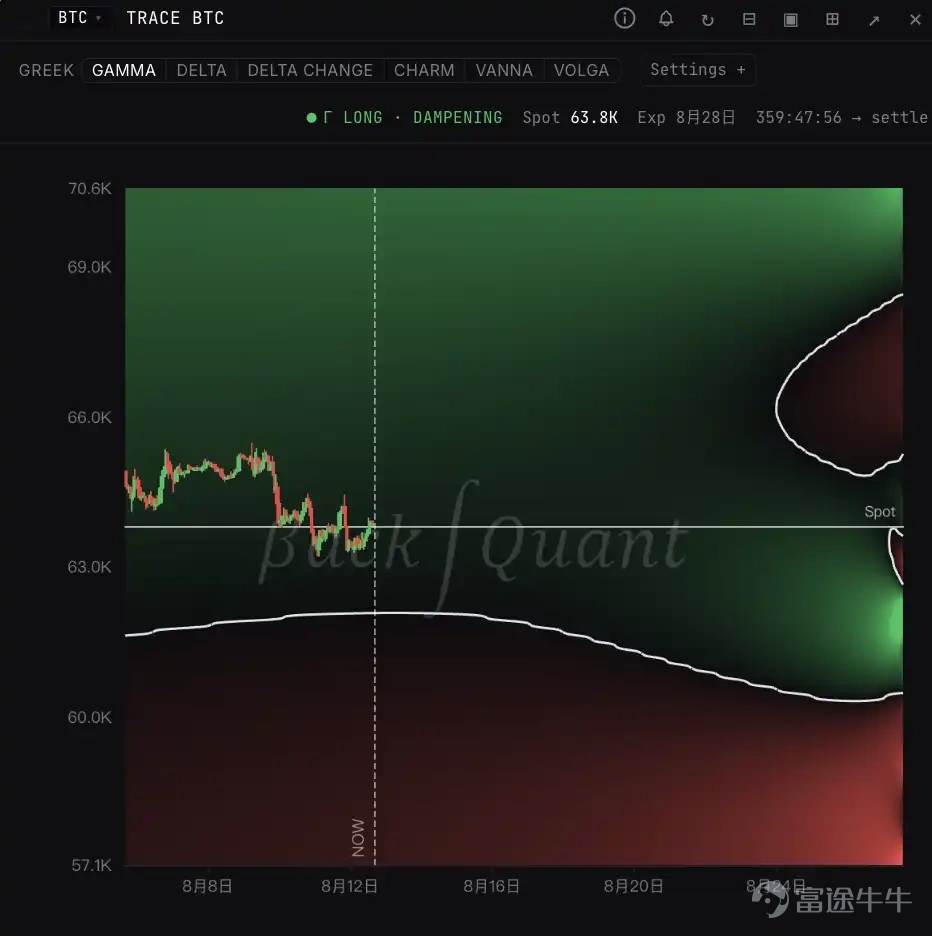
The aggregated gamma heatmap through month-end provides more specific price boundaries. Currently, the market remains in a long gamma zone where volatility is suppressed. Market makers buy on dips and sell on rallies, with their hedging activity pulling prices back into the range. The gamma flip zone is located near $61,000 to $60,000. As long as Bitcoin stays above this boundary, market maker hedging will absorb volatility; if prices fall below this boundary, positions shift to short gamma, forcing market makers to continue selling during declines, turning their hedging from a dampener into an accelerator.
Many traders are citing two developments to support their bullish view. Over the past month, Saylor sold hundreds of millions of dollars worth of Bitcoin in tranches, representing about 0.13% of Strategy's holdings, while the Bitcoin price remained roughly flat. On the other hand, STRC rebounded from lows near $73 to $95.45, just one step away from $100. With Saylor selling without crashing Bitcoin and STRC recovering most of its losses, the market naturally interprets this as bad news already being priced in.
The issue is that, given the current low-liquidity, low-volatility market environment, there is another explanation for these phenomena.
Large entities still have spot holdings to exit, but current trading volumes cannot absorb large sell orders. They have temporarily halted selling simply because the order book is too thin. Once STRC returns to $100, bringing fresh buying interest back to Bitcoin, it may provide these entities with their last chance to exit.
Positive news will improve selling conditions.
This narrative explains why Bitcoin consolidated during Saylor's minor sales and why downside pressure remains a risk even after he resumes buying. The key variable determining price is the size of Strategy's orders relative to potential market-wide selling. Looking solely at Saylor's buying or selling does not yield a complete answer.
A reasonable counterargument is: large entities have previously encountered volatility events and Strategy's buying power, so why didn't they complete their exits? Historical trends offer a pessimistic answer. In the previous cycle, after STRC restored cash flows and Strategy provided spot liquidity, Bitcoin subsequently experienced a rapid decline, settling near $59,000, followed by prolonged consolidation.
Furthermore, options positioning has designated the $61,000 to $60,000 range as a zone of amplified volatility. Once large spot sell orders push prices into the negative gamma region, the next bottom is likely to form.
Strategy recently increased its USD reserves by $650 million and repurchased $109 million worth of STRC. The company disclosed that these actions extended the USD reserve coverage period by 143 days to 2.7 years and narrowed STRC’s Bitcoin credit spread by 10 basis points. Including the previous week’s operations, the total buyback volume over two weeks amounted to approximately $190 million.
This capital injection pulled STRC back to $95, but it failed to address the most critical issue.
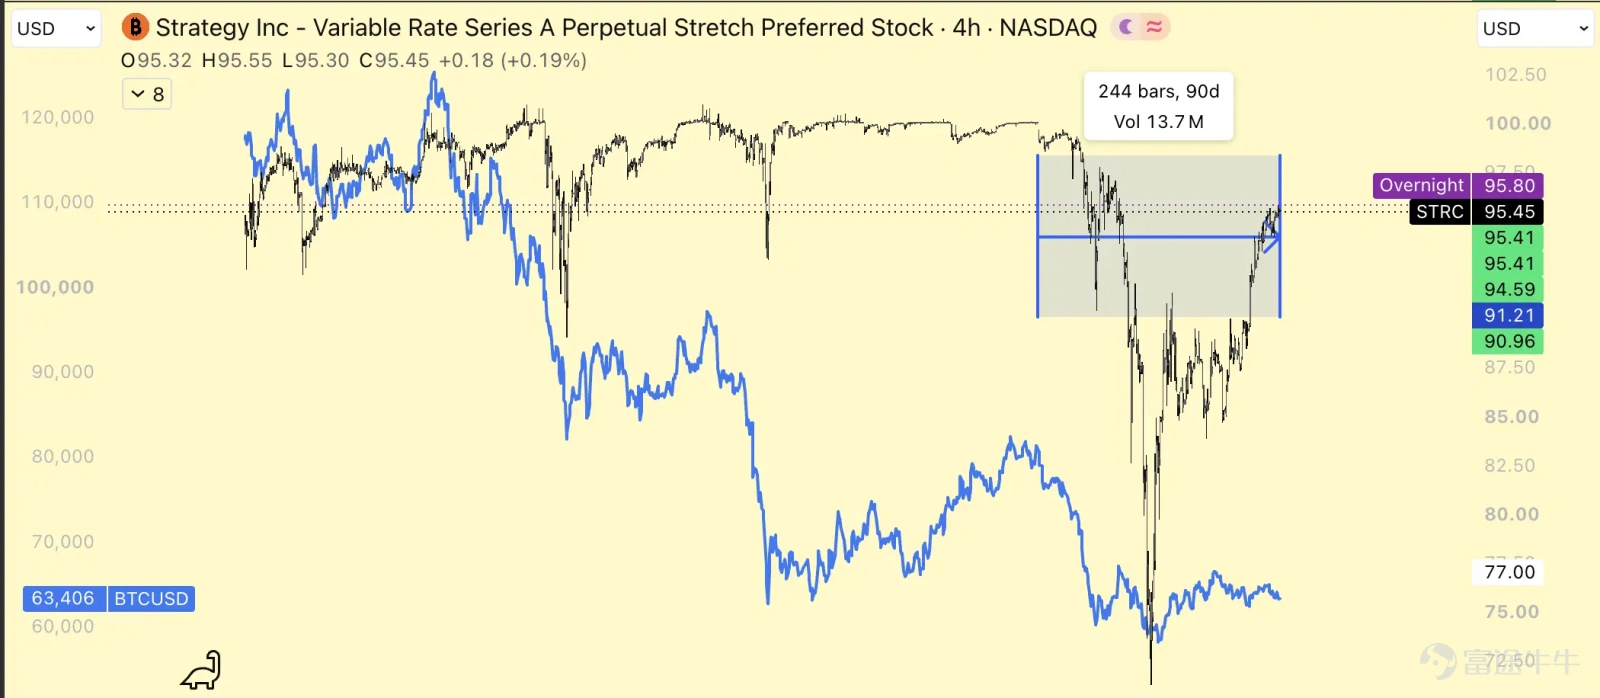
STRC must return to the $100 level.
Strategy will issue additional STRC shares at market price via an At-The-Market (ATM) offering near the $100 mark. This effectively signals to the market that the company will supply more new shares whenever the stock price approaches $100. Consequently, all holders who bought below $100 will tend to sell around $99.90; even if STRC reaches $100, it will be immediately pushed back below that level by such selling pressure. Short sellers can also sell borrowed shares around $99.90 and buy them back when the price falls again to $95, capturing a spread of approximately $5 per share.
The primary risk in this trade is that STRC breaks above $100 and continues to rise, forcing short sellers to cover at higher prices. However, Strategy’s own increase in supply near $100 actively caps this upside potential. The more the market believes the company will issue new shares at $100, the more willing traders are to sell early at $99.90, making it increasingly difficult for STRC to sustainably stand above $100.
As long as this rule remains unchanged, if the ~$190 million buyback still fails to push STRC back above $100, the market will continue to question the source of funds for future STRC purchases, raising concerns about Bitcoin liquidation. By simultaneously replenishing USD reserves and repurchasing STRC, the company has signaled that its current priority is repairing the financing side, with resuming net Bitcoin purchases taking a back seat.
Short selling is not a cost-free transaction. Short sellers must first borrow STRC and then sell it into the market. During the holding period, they must pay an annualized securities lending rate exceeding 50% and compensate for dividends of approximately 12%, resulting in a total annualized cost of over 60%. If the stock price stagnates near $100 for an extended period, these costs will erode profits over time.
Since STRC issues additional shares to dilute upside potential, short sellers rarely face losses from sustained price increases. If Strategy were to stop issuing STRC at $100, allowing the price to rise from $99.90 to $102–$105, short sellers would immediately incur paper losses of $2.10 to $5.10 per share. Some short sellers, seeking to limit losses, would be forced to buy back STRC, and their buying orders would further drive up the price, creating a short squeeze.
Securities lending fees determine how long short sellers can hold their positions, while Strategy’s issuance rules dictate whether they need to cut losses early. As long as STRC issuance begins at $100, it will attract short sellers to enter the trade.
The contradiction in capital allocation has not disappeared. Continuing to issue common shares when MSTR’s mNAV is below 1 dilutes the per-share value for common shareholders; meanwhile, repurchasing STRC without raising dividends or buying back MSTR provides more direct protection to preferred shareholders. The company sees a longer USD reserve coverage period and narrower Bitcoin credit spreads, while common shareholders are calculating who bears the cost of this repair.
Bitfinex Long positions typically move inversely to BTC prices. When BTC falls, large long positions on Bitfinex often increase; when BTC rises, these long positions gradually decrease. The market habitually treats this inverse relationship as a positioning indicator to observe whether large capital is accumulating BTC during price weakness.
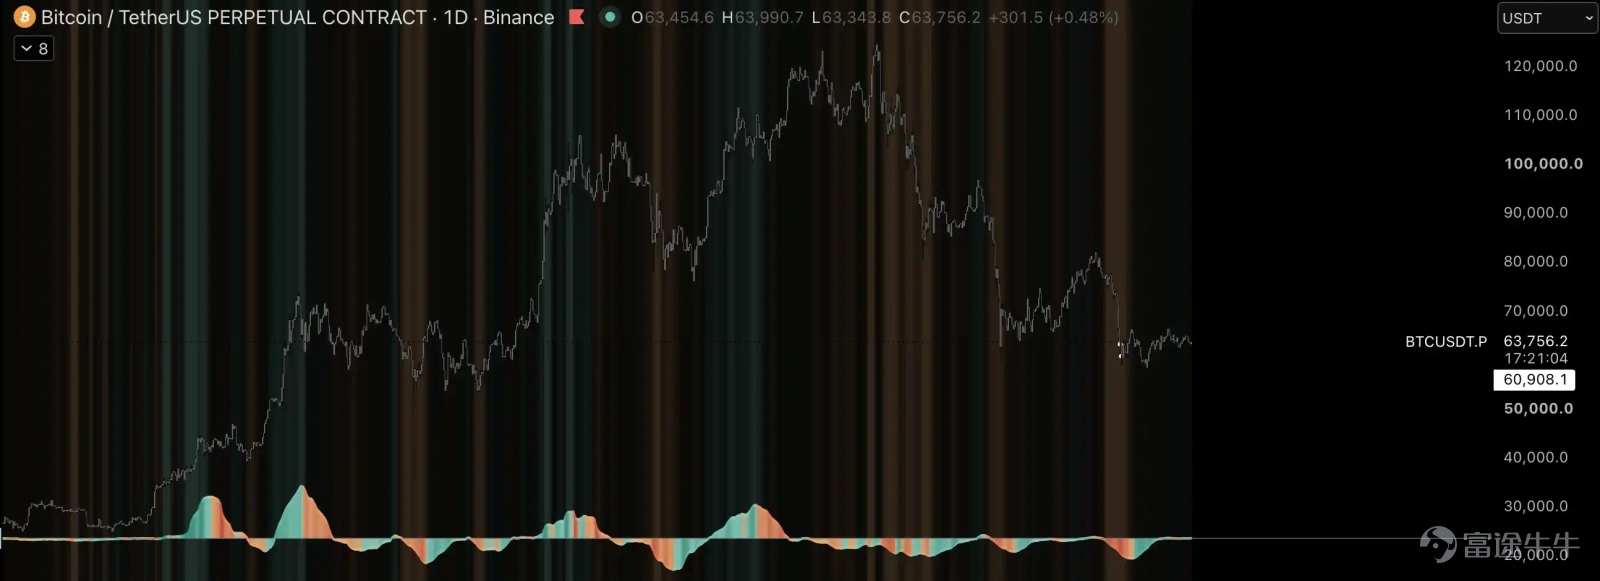
Bitfinex Long Change Rate (Reversal) Indicator
Recently, this indicator has failed. The change rate of Bitfinex Long positions has dropped to its lowest level since the end of the 2022 bear market. With BTC consolidating around $60,000, Bitfinex long positions have neither significantly increased nor exited, providing no directional clue for the next move.
BTC's 'savior' has turned into 'Satan'.
Risk Disclaimer: The above content only represents the author's view. It does not represent any position or investment advice of Futu. Futu makes no representation or warranty.Read more

Comments
to post a comment
2