Is the AI trading theme making a comeback? Japanese and South Korean stocks rebound strongly

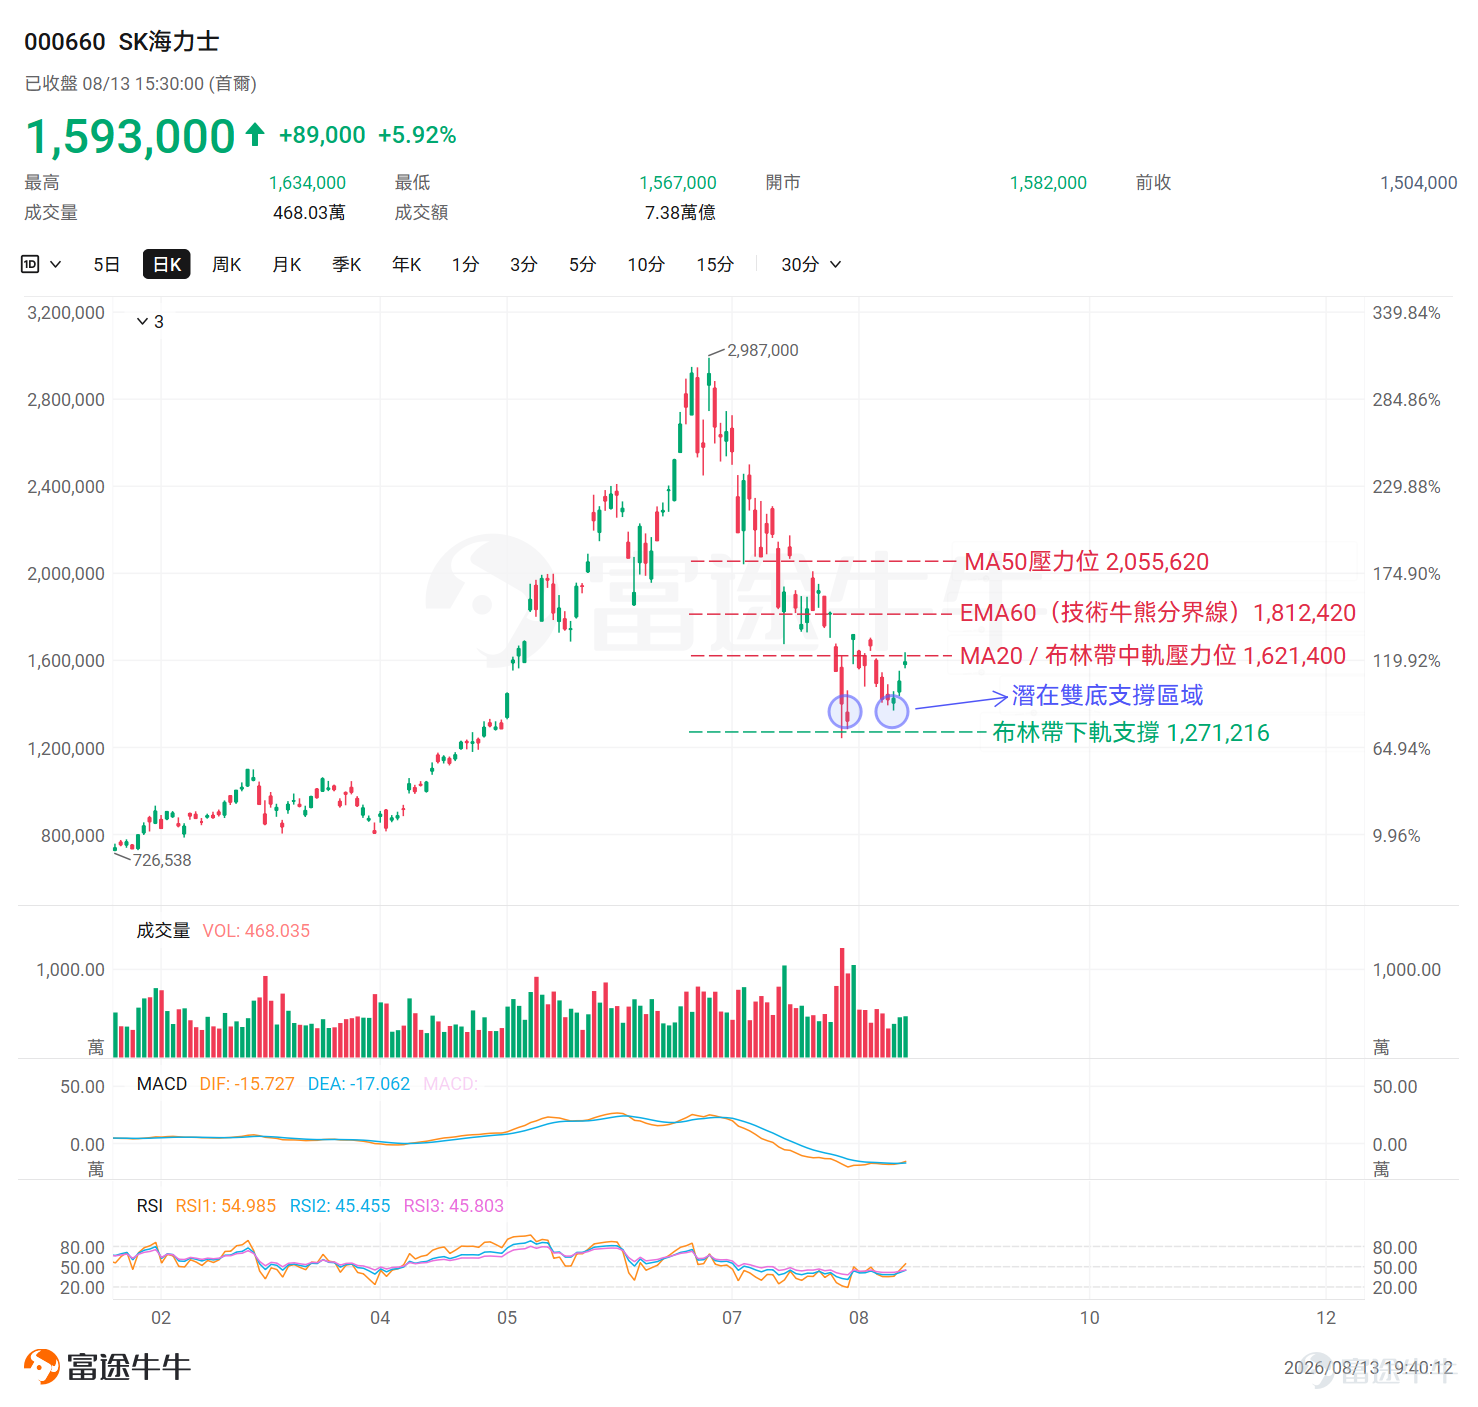
Technical Analysis Desk | SK Hynix posts three consecutive green candles; has a "double bottom support" formed?
This week $SK Hynix (000660.KR)$$SK hynix (SKHY.US)$The stock price has rebounded strongly from its lows,Market sentiment has shifted from pessimism to cautious optimism.
In terms of capital expenditure, SK Hynix announced plans to invest $720 billion to expand AI memory production capacity in South Korea and the United States, highlighting its long-term strategic layout in the High Bandwidth Memory (HBM) sector. Meanwhile, Singapore's sovereign wealth fund, Temasek, plans to make its first direct investment in the South Korean stock market,with SK Hynix being one of the targets.
Buoyed by multiple positive catalysts, SK Hynix's stock price, between August 11 and 13,closed higher for three consecutive days, accumulating a rebound of approximately 16% from the low of 1,373,000 KRW.Below, we analyze the recent trend and key technical levels from a technical perspective.
Recent stock price movement

SK Hynix's moving average structure remains in a bearish alignment (EMA60 > EMA20 > EMA10 > EMA5),The current stock price of KRW 1,593,000 remains in a technical bearish zone below the 60-day EMA (KRW 1,812,420), and the medium-term downtrend has not yet seen a fundamental reversal.
However, it is worth noting that the stock price has staged a continuous rebound from the low of KRW 1,373,000 on August 11. Combined with the price trends on July 30 and 31,this pattern suggests the formation of a "double bottom" support, indicating a phased recovery in short-term momentum.
Nevertheless, profit-taking pressure cannot be ignored, and the sustainability of the breakout momentum must be carefully assessed.
Key Technical Indicator Analysis
EMA Moving Averages: EMA5 = KRW 1,517,132.60, EMA10 = KRW 1,539,448.17, EMA20 = KRW 1,653,117.54, EMA60 = KRW 1,812,420.36; all lines are in a bearish alignment
RSI:RSI is at 45.46, within the neutral range (30–70). Although the stock price has rebounded quickly from the lows, the RSI has only recovered to around 45, indicating that while momentum has improved, it remains relatively weak; no significant divergence observed.
MACD:MACD line (-15.73) > Signal line (-17.06), forming a golden cross; however, both lines remain below the zero axis, characterizing this as a technical corrective golden cross within a bearish zone; no divergence observed.
Bollinger Bands:The closing price of KRW 1,593,000 is between the middle band (1,621,400) and the lower band (1,271,216); volatility has not yet converged.
Fibonacci:The current stock price is below the 78.6% retracement level (KRW 1,618,574) and the 50% retracement level (KRW 2,116,500).The nearest resistance level above is KRW 1,618,574 (78.6% retracement level), while the nearest support level below is KRW 1,246,000.
* Fibonacci retracement levels are automatically calculated based on the highest and lowest prices over the past 60 trading days, not manually selected swing points. Actual support/resistance effectiveness should be confirmed by market price action
Comprehensive assessment
For support, primary attention should be paid to KRW 1,567,000 (the intraday low on August 13, which also coincides with a recent high-volume consolidation zone).Once this level is breached, it may trigger short-term long stop-losses, at which pointsecondary support lies at KRW 1,420,000 (the bottom of the sideways consolidation from August 10 to 11).If the price continues to break lower,the lower Bollinger Band at KRW 1,271,216 will serve as the reference for extreme short-term support.
On the resistance side, the nearest significant resistance is concentrated at KRW 1,621,400 (where the 20-day Moving Average intersects with the middle Bollinger Band),acting as the first test for a short-term rebound; whether it can be effectively broken through will determine the subsequent market rhythm. A breakout couldlead to further testing of the swing high from July 31 at KRW 1,718,000.In the medium term,The KRW 1,812,420 level, where the 60-day EMA sits, is a key threshold for a shift in the bull-bear dynamic.
Finally, when discussing SK Hynix, we must mention another ticker: $CSOP SK Hynix Daily Max (2x) Leveraged Product (07709.HK)$ .It is not the underlying stock, but a 2x long leveraged ETF tracking SK Hynix,designed to amplify the daily price movement by two times. While this sounds straightforward, there is a structural pitfall often overlooked between this description and the actual holding experience.
So, how should leveraged ETFs be used properly? Next, I will briefly introduce this using 7709 as an example for fellow investors.
Ideal scenarios for leveraged ETFs: Early stage of a primary uptrend, with a clear trend where the underlying stock rises continuously immediately after purchase.
This is the most favorable environment for leveraged ETFs. Daily resetting generates compounding gains in line with the trend during a unilateral rise—Profits from the previous day serve as a larger principal base for leverage the next day, resulting in actual returns exceeding twice the gain of the underlying stock.
Example: If the underlying stock rises by 6.7% for three consecutive days, accumulating a 21% gain, the actual return on 7709 will exceed the simple calculation of 42% (21% x 2 leverage).The more sustained the trend and the more stable the daily gains, the more pronounced this excess compounding effect becomes.
Scenarios unsuitable for leveraged ETFs: High-level consolidation/choppy trading of the underlying stock; Underlying stock drops before rising after purchase; Long-term holding.
1. High-level consolidation and choppy trading of the underlying stock are scenarios where volatility decay is most concentrated and severe.Once the underlying stock oscillates back and forth, the ETF falls into a systematic cycle of "buying high and selling low," resulting in continuous value erosion—known in the industry as Volatility Decay, also referred to as Beta Slippage.This portion of the loss will not be automatically recovered even if the underlying stock eventually rises.
2. The underlying stock drops first and then rises after purchase (U-shaped trend).This is the most misleading scenario. Suppose the underlying stock falls from 100 to 70 and then rises back to 100, appearing flat on the surface; however, 7709 would drop from 100 to around 40 during this process. Even if the underlying stock fully recovers, 7709 would only rebound to approximately 56, resulting in a permanent loss of about 44%.The underlying stock has "broken even," but the leveraged ETF has not.
3. The longer the holding period, the greater the deviation of the leveraged ETF's performance from that of the underlying stock.Even if SK Hynix rises by 50% in a year, the actual return on 7709 is likely to be less than double that figure. This is not a flaw in product design, but an inherent characteristic of daily-reset leveraged instruments.
Therefore, before using a leveraged ETF, you must ask yourself one question:"Is the anticipated upside expected to materialize in the next few days, or will it require waiting?"
If it's the former—where there are clear catalysts and the trend has already started—a leveraged ETF can effectively amplify returns.
If it's the latter—where the outlook is bullish but the timing is uncertain, and the underlying stock may consolidate before strengthening—then holding the underlying stock directly is a more rational choice.Leveraged ETFs do not reward patience; they only reward precise market timing.

Risk Disclaimer: The above content only represents the author's view. It does not represent any position or investment advice of Futu. Futu makes no representation or warranty.Read more


Comments (9)
to post a comment
74
221