SpaceX's second wave of lock-up expirations is here; how should investors position themselves in spa

Technical Insights | After SpaceX’s sharp rally, the 'surge-and-pullback' pattern emerges—Is this a bottoming reversal or a bull trap?
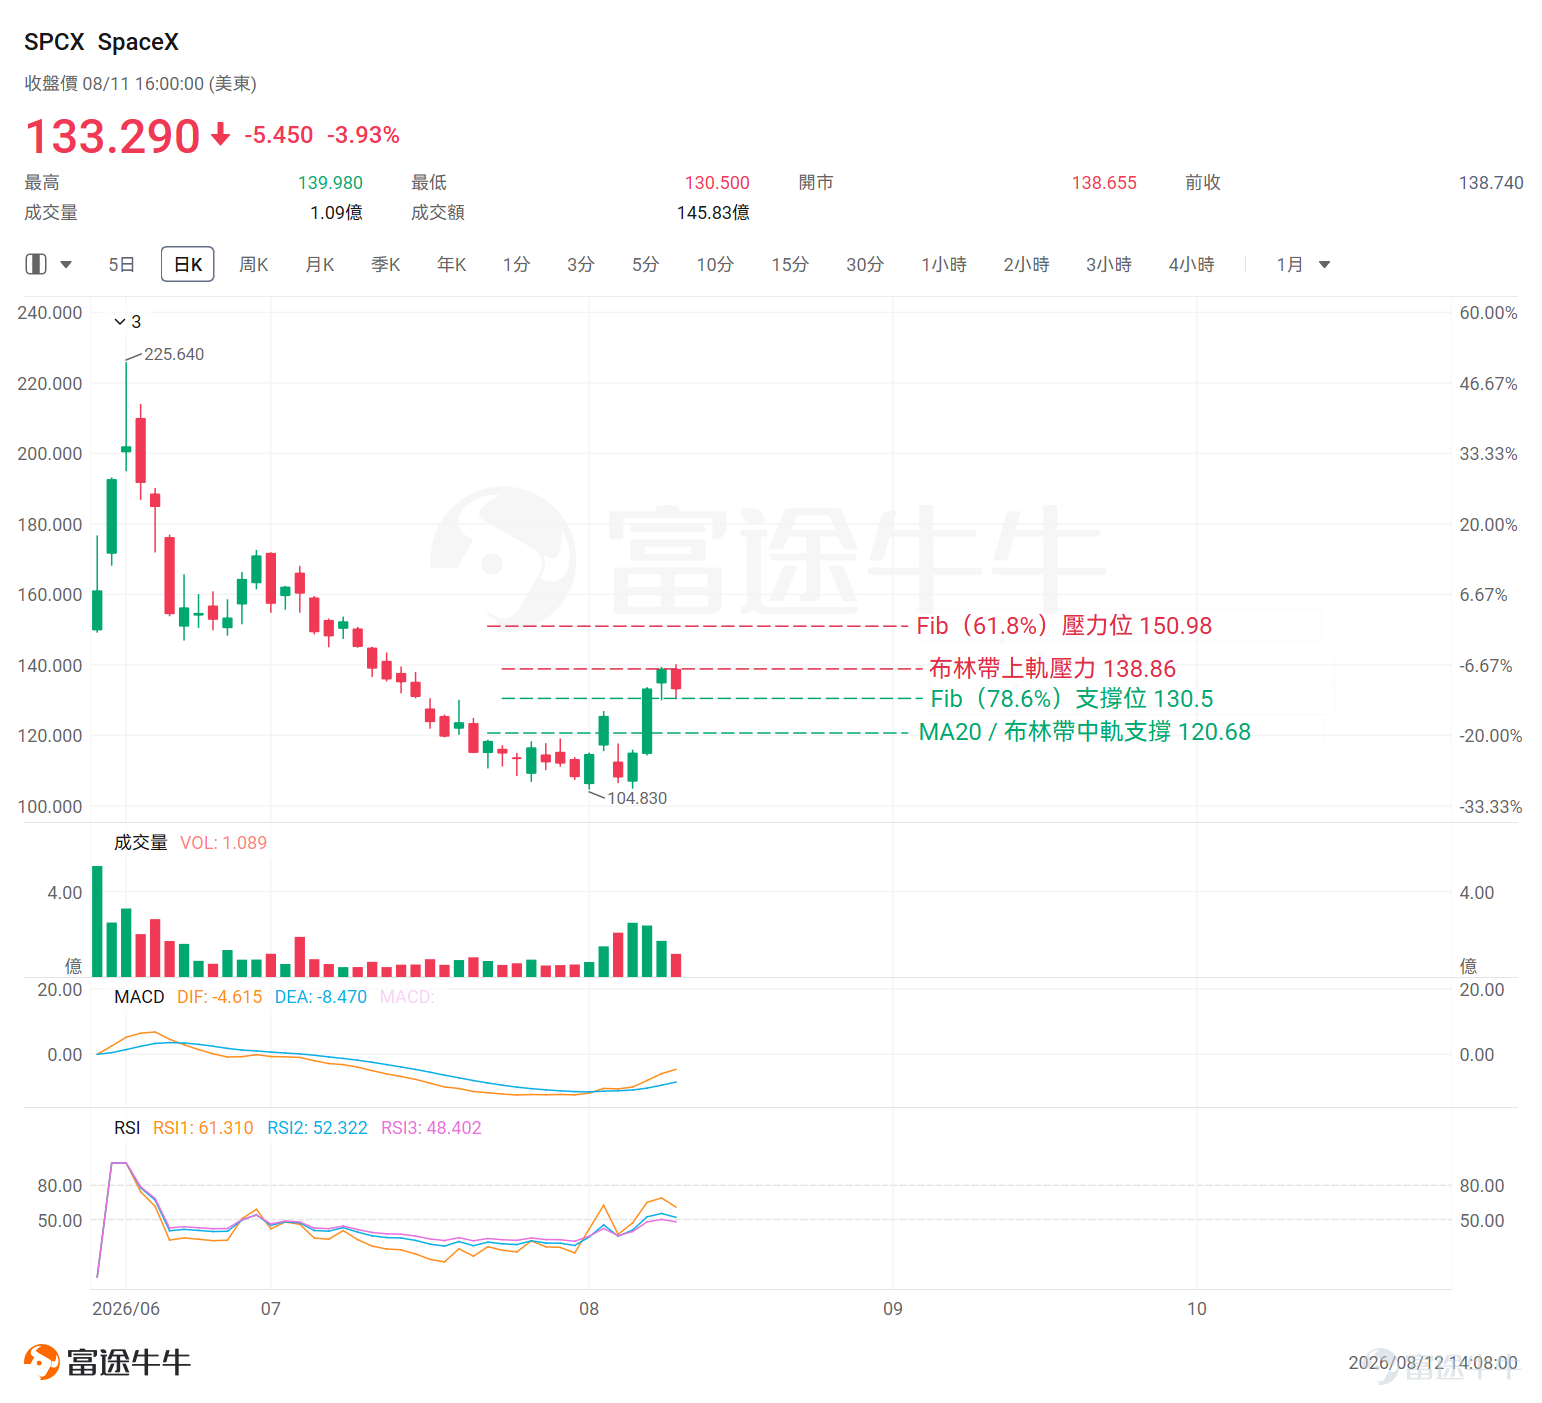
$SpaceX (SPCX.US)$ Recorded a net inflow of approximately $19 million on August 11. Notably,The stock price, after rebounding from a low of $104.83, rose sharply for several consecutive sessions, reaching an intraday high of $139.98 on August 11 before pulling back and closing at $133.29.Significant selling pressure suggests the market needs to carefully assess whether SpaceX can maintain its short-term bullish momentum or will enter a consolidation and pullback phase ahead of another wave of share lock-up expirations on August 20.
Below is a technical analysis of SpaceX’s recent price action and key levels.
Recent stock price movement
SpaceXThe short-term trend remains upward, but a high-rejection signal emerged on August 11.Recent momentum remains biased to the upside; however, note that the 10-day EMA is below the 20-day EMA, indicating that the short-term moving average structure has not yet fully aligned and remains in a transitional consolidation phase, introducing some uncertainty regarding momentum sustainability.
In terms of candlestick patterns, the stock opened at $134.95 on August 10, reached a high of $139.26, and closed at $138.74. On August 11, it opened higher at $138.65, hit a new recent high of $139.98 intraday, then retreated, ultimately closing at $133.29—forming a two-day pattern of 'rally-and-rejection' followed by a 'confirmation bearish candle.'Short-term correction pressure is now evident, and it is critical to watch whether the stock can hold above the $130.50 support level (the low of the August 11 lower wick).
Key Technical Indicator Analysis
EMA Moving Averages:EMA5 = $128.89, EMA10 = $124.69, EMA20 = $126.27; EMA5 > EMA20 > EMA10, with the 5-day EMA crossing above the other two EMAs, forming a golden cross
RSI:52.32, within the neutral zone (30–70), showing no overbought or oversold pressure and no clear divergence signals; momentum has recovered from recent lows into the neutral range but remains below overheated levels
MACD:MACD line (-4.61) > Signal line (-8.47), confirming a golden cross; the histogram has turned positive and is expanding, indicating strengthening momentum. However, it remains below the zero line, suggesting the overall trend is still in a weak-phase recovery with no divergence observed
Bollinger Bands:The closing price of $133.29 lies between the middle band ($120.68) and the upper band ($138.86). The bands are in a state of wide expansion, and the current price is contracting toward the middle band
Fibonacci:The current price of $133.29 is between the 78.6% retracement level ($130.68) and the 61.8% retracement level ($150.98)Near-term support at $130.68 (Fib 78.6%), with resistance above at $150.98 (Fib 61.8%)
* Fibonacci retracement levels are automatically calculated based on the highest and lowest prices over the past 60 trading days, not manually selected swing points. Actual support/resistance effectiveness should be confirmed by market price action
Comprehensive assessment
Regarding key support,$130.50 was the low of the lower shadow on August 11, serving as a key short-term support level. If this level is decisively broken with high volume, short-term momentum will be significantly impaired.Below this level,$125.33, the high from August 4, has now turned into support.If the stock price pulls back to this zone, it can be viewed as a test of medium-term support.$120.68 corresponds to the confluence of the 20-day EMA and the middle Bollinger Band. A break below this level would signal a significant weakening of the trend,which warrants close attention.
On the resistance side,$139.98 was the intraday high on August 11, forming near-term resistance at the recent top.If the stock rebounds in the short term, it must first overcome this prior high resistance to reestablish an upward trajectory. Above that,the Fibonacci 61.8% retracement level at $150.98 represents a key medium-term resistance, while $165.23 corresponds to a larger-scale upside target; together, they form medium-term resistance levels.

Risk Disclaimer: The above content only represents the author's view. It does not represent any position or investment advice of Futu. Futu makes no representation or warranty.Read more


Comments (9)
to post a comment
31
25