HK Stock Market Barometer | Revisiting the September 24 Rally! Is the National Day Trading Window Ab

Technical Intelligence Unit | Tencent reports earnings tomorrow! Will the stock price break below its medium-term support or bounce from the bottom?
CLSA expects Tencent's domestic gaming revenue to resume double-digit growth, with commercial services revenue accelerating to over 20%. Overall, the company presents a 'stable revenue but pressured profitability' outlook, with the scale of AI investment becoming a key focus of market speculation. Tencent’s AI-powered office product, WorkBuddy, has surpassed 20 million monthly active users and recently completed upgrades enabling seamless multi-device synchronization, signaling continued expansion in the AI office segment and sustaining market expectations for this business line.
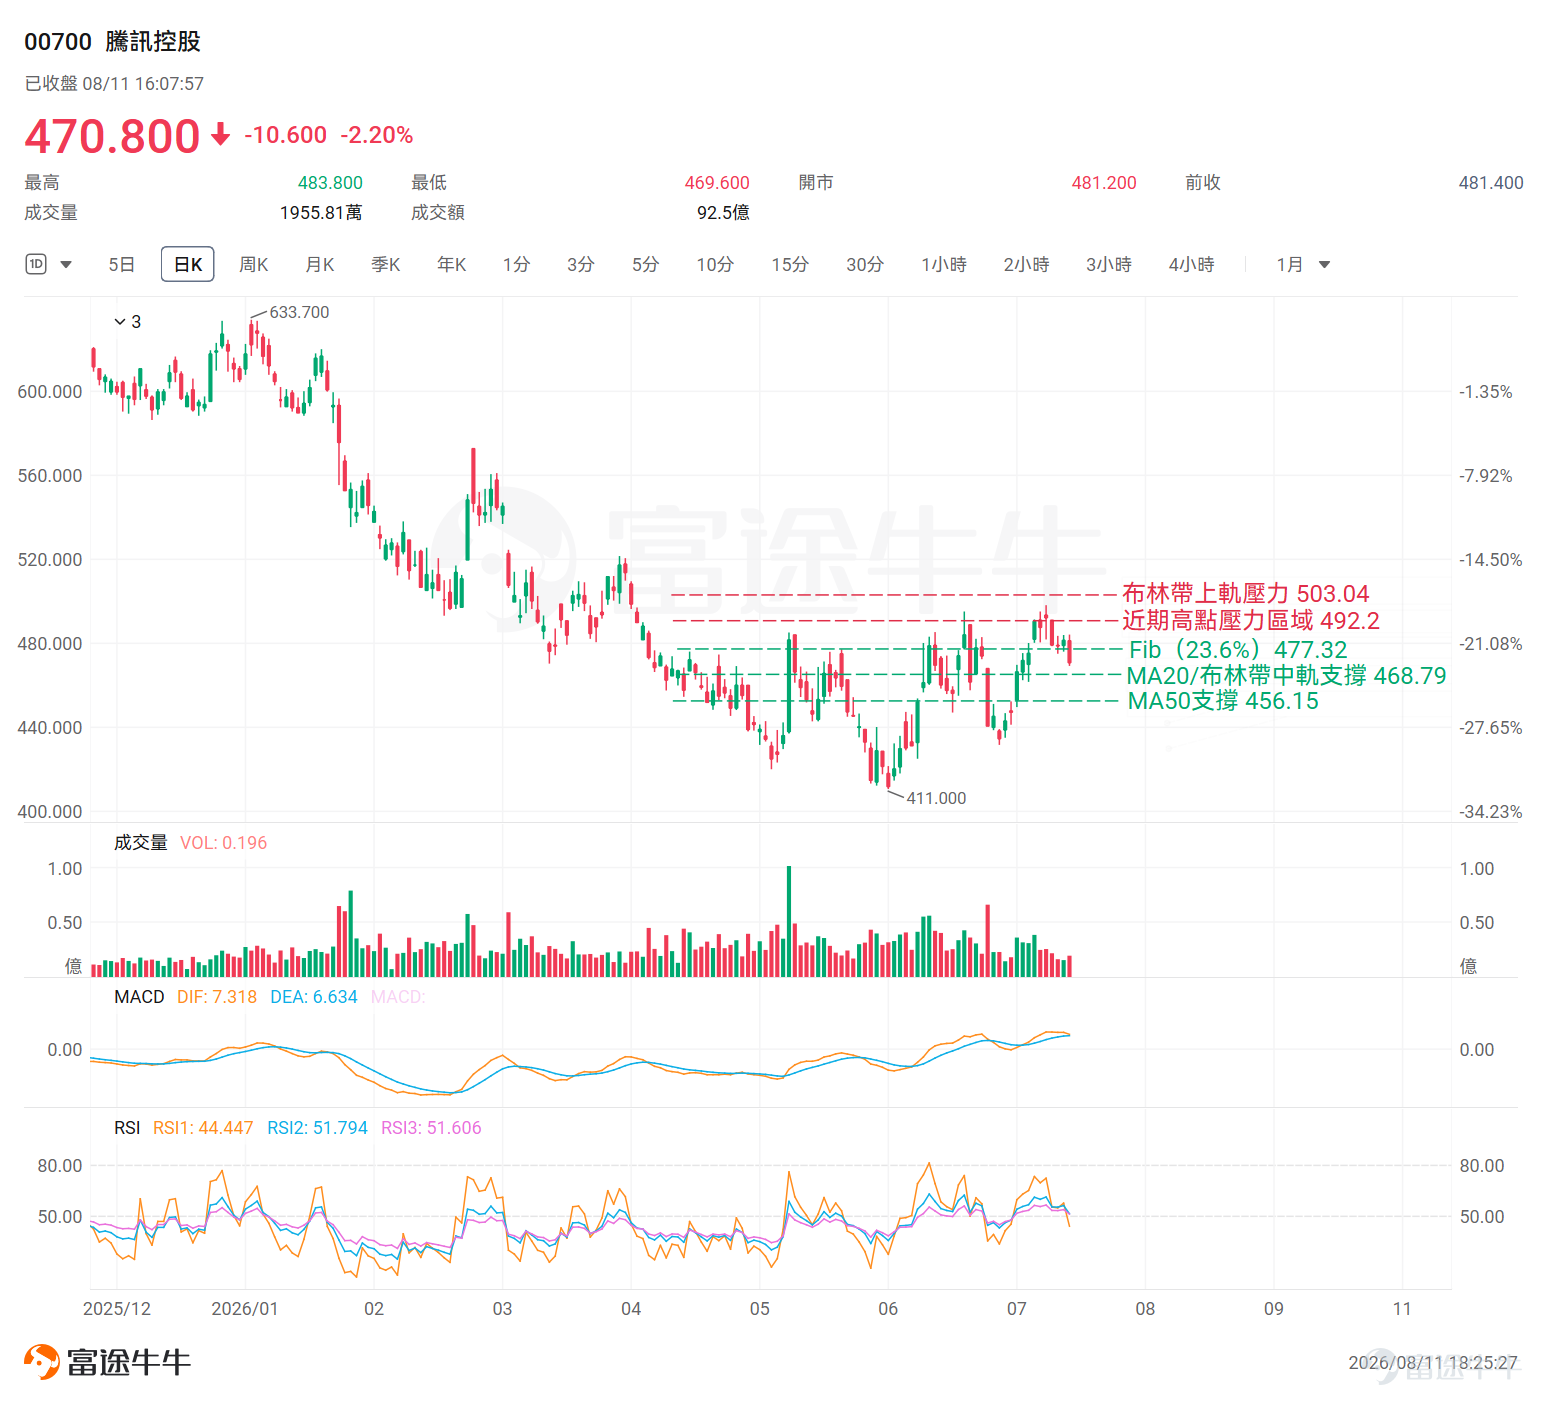
Tencent’s share price has been retreating from its recent high of HK$497.80, closing at HK$470.80 on August 11,and is now approaching the critical support level at the 20-day moving average (MA20).With earnings announcement imminent, market bulls and bears are intensifying their positions; the interplay between fundamental expectations and technical price action warrants close attention. Below, we systematically analyze Tencent’s current price structure and key technical levels.
Recent stock price movement

Tencent is currently ina transitional phase—maintaining a medium-term uptrend while undergoing short-term adjustment and facing downward pressure.In terms of moving average structure, the EMA5, EMA10, EMA20, and EMA60 remain in a well-defined bullish alignment, with the share price holding firmly above the EMA60 (HK$465.74).The medium-term uptrend remains intact.However, a large bearish candle on August 11 (opening at HK$481.20 and closing at HK$470.80) broke the recent consolidation range,shifting the short-term trend from a sideways pattern to one of clear downside pressure.
Overall, Tencentstill maintains its medium-term bullish structure, but short-term momentum has weakened significantly.Investors should closely monitor the interplay between subsequent closing prices and capital flow trends.
Key Technical Indicator Analysis
EMA Moving Averages:EMA5 = HK$477.54 / EMA10 = HK$475.62 / EMA20 = HK$469.65 / EMA60 = HK$465.74; today's closing price of HK$470.80 has fallen into the zone between EMA20 and EMA10. The bullish alignment remains intact, but the moving averages above now act as near-term resistance.
RSI:Current value is 51.79, within the neutral range with no overbought or oversold conditions; a weak bearish divergence signal is present and requires ongoing monitoring.
MACD:MACD line (7.32) > Signal line (6.63), golden cross remains intact above the zero axis, but the histogram has narrowed compared to its prior peak, indicating marginally weakening momentum.
Bollinger Bands:The stock price pulled back from above the middle Bollinger Band to near the middle band (HK$468.79); the effectiveness of this middle-band support is a key short-term focus.
Fibonacci:Current share price of HK$470.80 sits below the 23.6% Fibonacci retracement level (HK$477.32) and above the 38.2% level (HK$464.64); near-term support at HK$464.64, with resistance above at HK$477.32.
* Fibonacci retracement levels are automatically calculated based on the highest and lowest prices over the past 60 trading days, not manually selected swing points. Actual support/resistance strength should be confirmed by market price action.
Comprehensive assessment
Support Levels
HK$470.80 / HK$468.79:These correspond respectively to today’s closing price and the MA20/Bollinger Band middle line; this zone represents the most immediate short-term defensive support. A break below would weaken the technical structure.
HK$464.64:Corresponds to the 38.2% Fibonacci retracement level.
HK$454.40:Corresponds to the 50.0% Fibonacci retracement level, serving as the last line of defense for medium-term bulls
Resistance level
HK$477.32 to HK$479.20:The 23.6% Fibonacci retracement level overlapping with recent dense trading zones forms the key resistance to break for initiating a rebound
HK$503.04:Upper Bollinger Band, serving as a potential upside reference for medium-term targets

Risk Disclaimer: The above content only represents the author's view. It does not represent any position or investment advice of Futu. Futu makes no representation or warranty.Read more


Comments
to post a comment
7
9