Welcome Zone | Claim your 100,000 anniversary reward and kickstart your investment journey!

【Must-read for beginners】What on earth are CPI and PPI? Starting tomorrow night, three major economic data releases will hit the markets in quick succession—how will they impact your tech stocks?
Please note: from tomorrow (August 12) through August 14, global financial markets will face a three-day marathon of major economic data releases—the U.S. CPI, PPI, and retail sales data will be unveiled in quick succession!
Do you feel the same way every time you see terms like 'CPI beats expectations,' 'PPI surges,' or 'retail sales XX'? Do these technical terms instantly make you feel there’s a barrier, triggering your 'I don’t understand' mode?
But whenever these data points are released, do the movements in your stock holdings—and the broader market—suddenly seem unpredictable?
Of course they do! Because these three indicators aren’t just cold numbers—they directly and tangibly influence the performance of your tech stocks and Hong Kong-listed equities.
Don’t scroll away just yet! Today, we’ll break down this macro-level logic for making money and managing risk using plain, everyday language—you’ll grasp it instantly!
📌 Step 1: Plain English explainer—understand CPI and PPI in one minute
Don't memorize textbook definitions—you just need to understand it this way:
– CPI (Consumer Price Index):"How much more expensive has shopping become?"
It reflects price changes in everyday consumer spending—such as buying groceries at the supermarket, taking public transport, watching movies, or paying rent. The higher the CPI, the worse the inflation, meaning your money loses purchasing power.
– PPI (Producer Price Index):"How much more expensive has production become?"
It reflects factories' costs for raw materials (like steel, chips, and oil). If PPI rises, it means production costs are increasing—and soon these costs will be passed on to consumers, pushing CPI higher.
– Retail sales data:"Are people still spending like crazy?"
Strong retail sales data indicates people still have money in their pockets and are eager to spend.
📌 Step 2: The Four-Stage Macro Transmission Framework—Understand Where Money Is Flowing
How do these three data points progressively impact your holdings? Remember this golden transmission chain:
Employment & Consumption (Retail Sales) → Price Levels (CPI/PPI) → Fed Interest Rates → Tech Stocks/HK Equities
🔄 Scenario A: Data is too hot (inflationary pressure)
1. Strong employment and consumption: Everyone has a good job and high consumer confidence (retail sales beat expectations).
2. Prices rise: With more buyers, prices naturally increase (CPI and PPI go up).
3. The Fed holds steady or even hikes rates: To prevent runaway inflation, the Fed must maintain high rates (locking money in banks to cool down the economy).
4. Tech stocks and HK equities come under pressureHigh interest rates act as a 'tide receder' for the stock market, pressuring tech stocks due to higher valuations and borrowing costs; capital also flows more easily back to the U.S., causing capital outflows from Hong Kong equities.
🔄 Scenario B: Cooling data (inflation under control—the most ideal scenario)
1. Moderate employment and consumptionThe economy isn’t overheating.
2. Prices ease backInflationary pressures ease (CPI and PPI decline moderately).
3. The Fed sends clear signals of rate cutsWith inflation tamed, the Fed can confidently cut rates to stimulate the economy.
4. Tech stocks and Hong Kong equities enter a macro 'tailwind phase':Rate cuts don’t guarantee indiscriminate market rallies (stock prices ultimately depend on companies’ earnings and EPS performance), but they undoubtedly create a favorable environment for valuation expansion and recovery. Meanwhile, as HKD rates follow USD rates lower, some capital may shift from risk-off assets like time deposits back into the Hong Kong equity market, which offers compelling valuation appeal.
🔍 Deeper Insight: After the data release, is the market reaction just a 'passing breeze' or a 'major turning point'?
Many beginners ask: 'I understand the logic, but how fast does the market react after data is released? Can I still act in time? Is this just a brief fluctuation, or a leading indicator of future direction?'
Here, we break down two key dimensions for you:
1. Speed: Short-term reactions are 'as fast as lightning' ⚡
In today’s financial markets, economic data is transmitted and initially reflected in prices almost instantaneously. The moment CPI or PPI data is released, quantitative trading algorithms and short-term capital immediately trigger sharp market volatility. In fact, investor sentiment and market momentum often dominate short-term index movements even faster than the actual impact of the data itself. Therefore,ordinary beginners should never try to 'bet' on the immediate price movement right at the data release,because it’s extremely difficult to outpace high-frequency algorithmic trading.
2. Depth: Medium- to long-term trends often signal a 'cyclical inflection point' 🔄
Although short-term volatility can be intense, from a medium- to long-term perspective,sustained fluctuations in the data often foreshadow potential investment turning points.Mainstream institutional analysis points out that current economic data volatility—such as cooling inflation or shifts in manufacturing sentiment—is signaling the direction for future market structural adjustments. For instance, once a clear downward trend in inflation is established, the Federal Reserve’s policy pivot—from hawkish rate hikes to dovish rate cuts—will serve as the 'tipping point' confirming a medium- to long-term bull market. Sectors representing advanced productivity and demonstrating resilience, such as cutting-edge technology and semiconductors, will be the first to stand out following this market restructuring.
Amid rapidly shifting macroeconomic data and market inflection points, the best strategy for beginners is certainly not 'going all-in on a single stock,' but rather adopting an 'offense-and-defense-balanced' allocation using ETFs. We’ve covered this approach in detail in our previous article—interested fellow investors can check it out here:
📌 Beginner’s Guide: How to Easily Understand Macro Data Using 'Futubull'?
When economic data is released, an overwhelming flood of information hits all at once—how should beginners respond quickly?
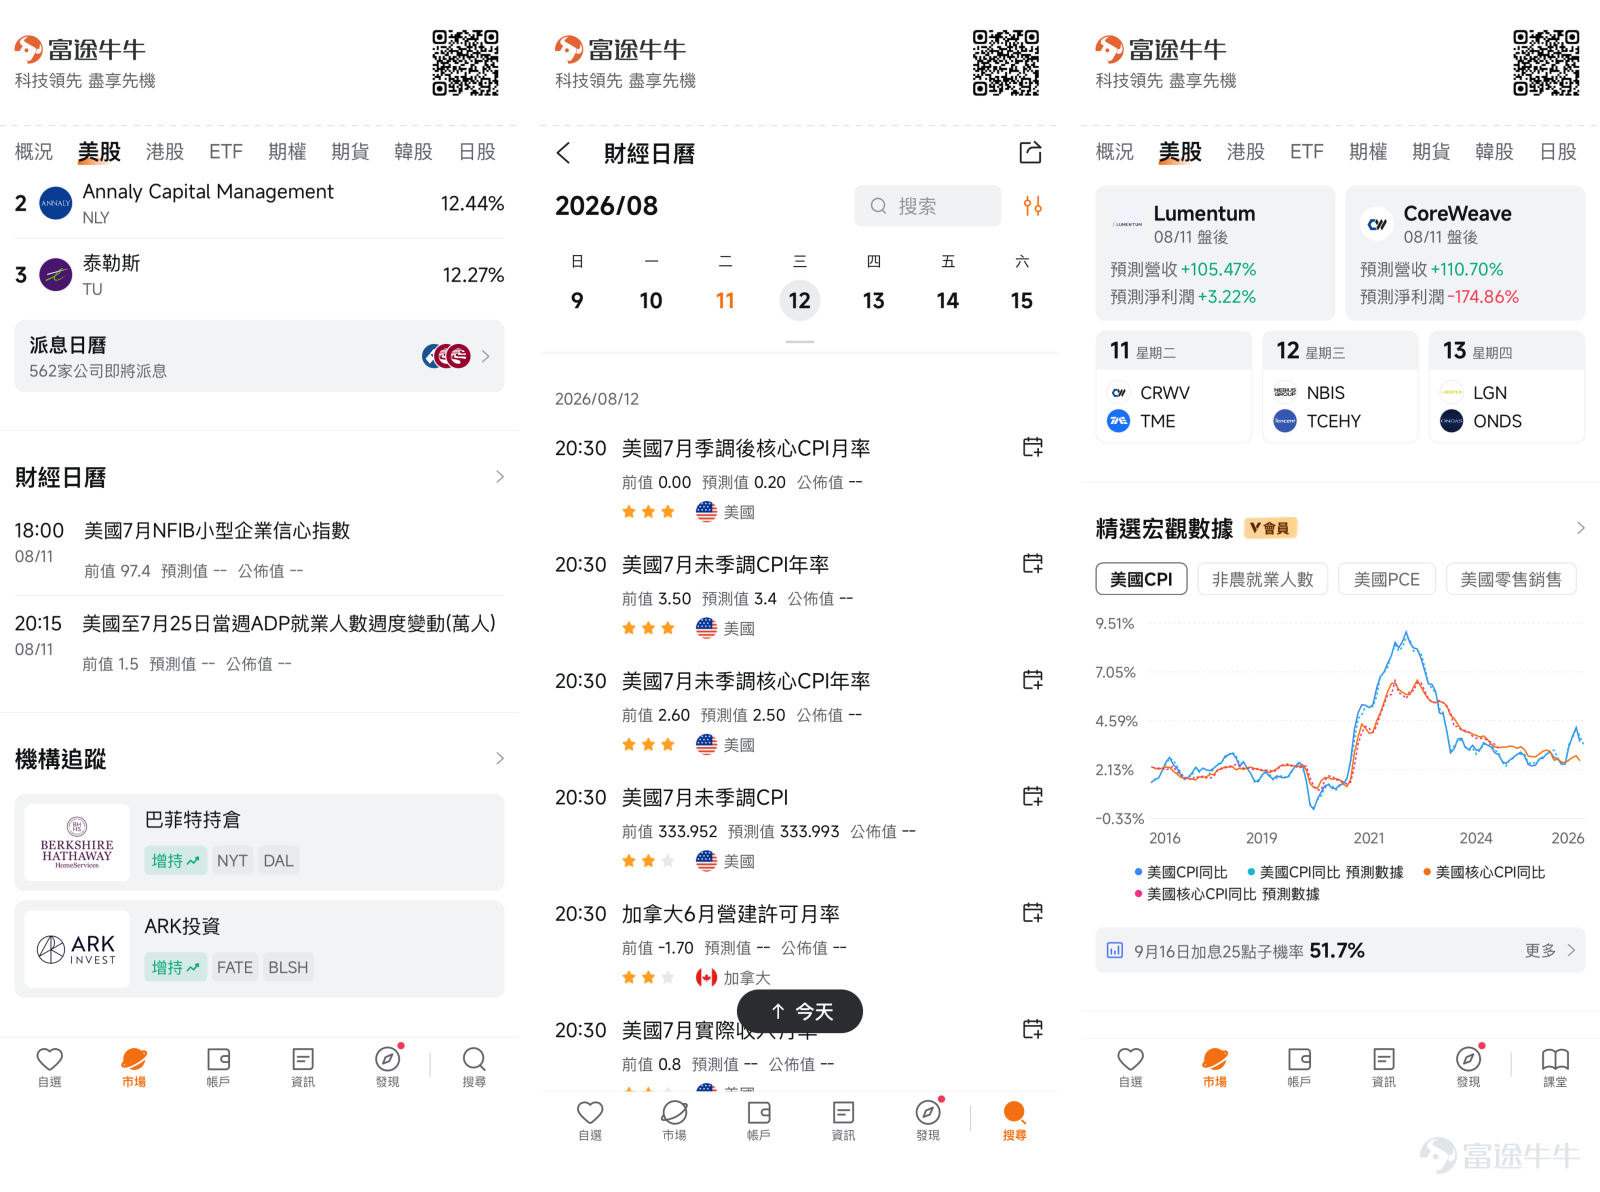
🛠️ Step 1: Set an Alarm and Bookmark the 'Economic Calendar'
– Navigation Path: Open the Futubull App → Tap 'Markets' → Select 'US Stocks' → Scroll down to findEconomic Calendar。
– Get clear visibility on release times for CPI, PPI, and retail data. Set reminders with one click to receive real-time updates as soon as the data drops!
📈 Tip #2: Make the most of 'Featured Macro Data'
– Navigation Path: Open the Futubull App → Tap 'Market' → Select 'US Stocks' → Scroll down to find 'Featured Macro Data'。
– Here you can intuitively view key macroeconomic indicators such as US CPI, non-farm payrolls, US retail sales, and Fed rate decision probabilities (e.g., likelihood of a rate cut). Combine these metrics with expert commentary and related news to gather timely analytical insights and stay ahead of market movements.

🤖 Tip #3: Summon 'Futubull AI' to simplify the complex
Before and after key data releases, the internet is flooded with dense, professional analyses—difficult to understand and too time-consuming to collect and verify. What should you do?
– Just summon your personal 【Futubull AI】!
◦ You can ask it directly:“Is tonight’s CPI data bullish or bearish?”、“How will this PPI data impact tech stocks?”
◦ Futubull AI will automatically filter out obscure academic jargon and summarize the core market logic for you in the clearest, simplest language—helping you quickly seize investment opportunities amid macroeconomic volatility!

💡 Summary:
Macroeconomics isn’t just lofty academic theory—it’s closely tied to every investment you make. Once you grasp this transmission logic—‘employment → inflation → interest rates → stock market’—you’ll be able to face the barrage of the three major data releases calmly and strategically position your trades in the Futubull app like a pro, starting tomorrow!
Risk Disclaimer: The above content only represents the author's view. It does not represent any position or investment advice of Futu. Futu makes no representation or warranty.Read more


Comments (2)
to post a comment
37
80