Is the food delivery war coming to an end? Meituan's Q2 profits exceed expectations

Decoding Star Stocks' Earnings | SMIC Reports Q2 Results on August 13! Learn Step-by-Step How to Read the 'Semiconductor Bellwether'
After market close on Thursday, August 13,$SMIC (00981.HK)$ it will release its Q2 2026 earnings results.
SMIC is listed on both the Hong Kong Stock Exchange and the STAR Market, and is one of the most representative wafer foundry companies in the Hong Kong market. Unlike Tencent, its earnings report doesn't break down into diverse segments like gaming, advertising, or payments—but for investors, this simplicity comes with a unique 'decoder ring' specific to semiconductor companies:
Is capacity utilization full? Are wafers selling at high prices? Is gross margin improving? And how much is the company spending to further expand capacity?
These metrics not only determine SMIC’s quarterly profitability but also reflect the current state of domestic wafer foundry demand and the broader semiconductor cycle.
Therefore, using SMIC’s upcoming Q2 results as a case study, this article will walk you through—from scratch—how to analyze a wafer foundry company’s earnings report.
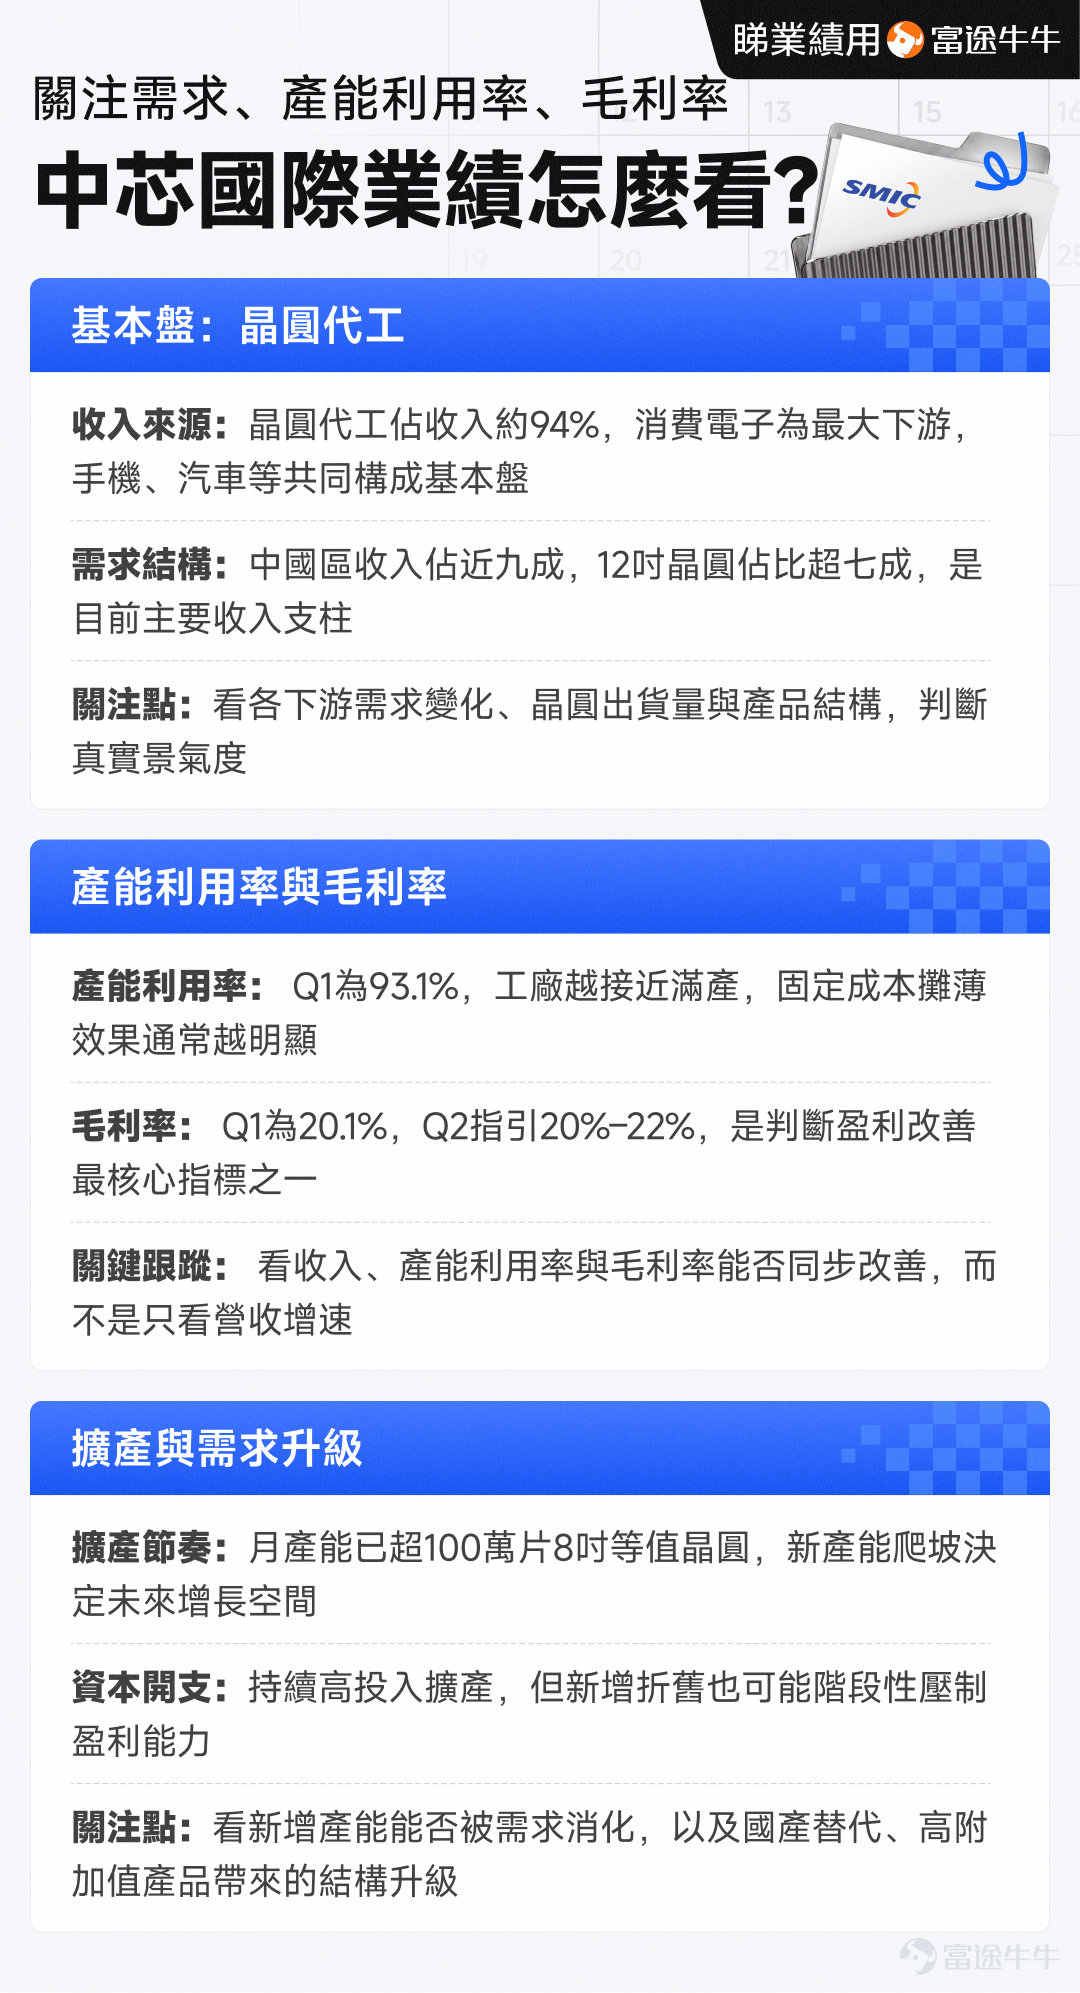
Main revenue breakdown: Who exactly buys SMIC's wafers?
The first step in analyzing a company is still to answer the same question:Where does the revenue come from?
SMIC's core business model is providing foundry services—manufacturing chips for fabless semiconductor companies.
Fabless chip design companies provide the design blueprints to wafer fabs, and SMIC handles the actual chip manufacturing, charging based on the number of wafers and agreed pricing.
In Q1 2026, 93.9% of SMIC’s revenue came from wafer foundry services. By end-market application, consumer electronics accounted for 46.2%, smartphones 18.9%, industrial and automotive 14.0%, computing and tablets 13.6%, and connectivity & IoT 7.3%.
That is to say,Currently, SMIC’s largest source of demand isn’t smartphones alone, but the broader consumer electronics segment.
Breaking it down further by wafer size, in Q1 2026, 12-inch wafers contributed 76.4% of revenue, while 8-inch wafers accounted for 23.6%. By region, revenue from China reached 88.9% of the total.
Putting these figures together gives a clear picture of SMIC’s current fundamentals:The Chinese market is the dominant driver, 12-inch wafers are the core revenue contributor, and consumer electronics remains the largest downstream demand source.
Looking at wafer foundry earnings, the first key metric is: capacity utilization
One of the biggest differences between wafer foundries and typical internet companies is:Building a fab is extremely expensive.
Once facilities, lithography machines, etching tools, and thin-film deposition equipment are purchased, depreciation must be recorded regardless of whether there are orders today.
Therefore, for wafer foundries, if a production line runs at full capacity every day making chips, fixed costs can be spread across more wafers; if a large amount of equipment sits idle, the same depreciation expense must be absorbed by fewer products, naturally reducing profitability.
This is why 'capacity utilization' matters so much.
In Q1 2026, SMIC’s capacity utilization was93.1%, higher than 89.6% in the same period last year.
Beginners can simply think of it as:The higher the capacity utilization, the busier the factory typically is.The first key figure to look at in this Q2 earnings report is:Can capacity utilization return toward the 95% range?
If revenue surges and utilization rises in tandem, it indicates demand is genuinely strengthening; if revenue growth mainly comes from pricing or product mix while utilization declines, the underlying implication is entirely different.
The second key figure: gross margin, which is more important than revenue alone
For wafer foundry companies, higher revenue doesn't necessarily mean higher profitability.
Because revenue can be roughly understood as:Shipment volume × wafer price.
However, the actual gross profit retained is influenced by multiple factors, including capacity utilization, product mix, average selling price, and depreciation costs.
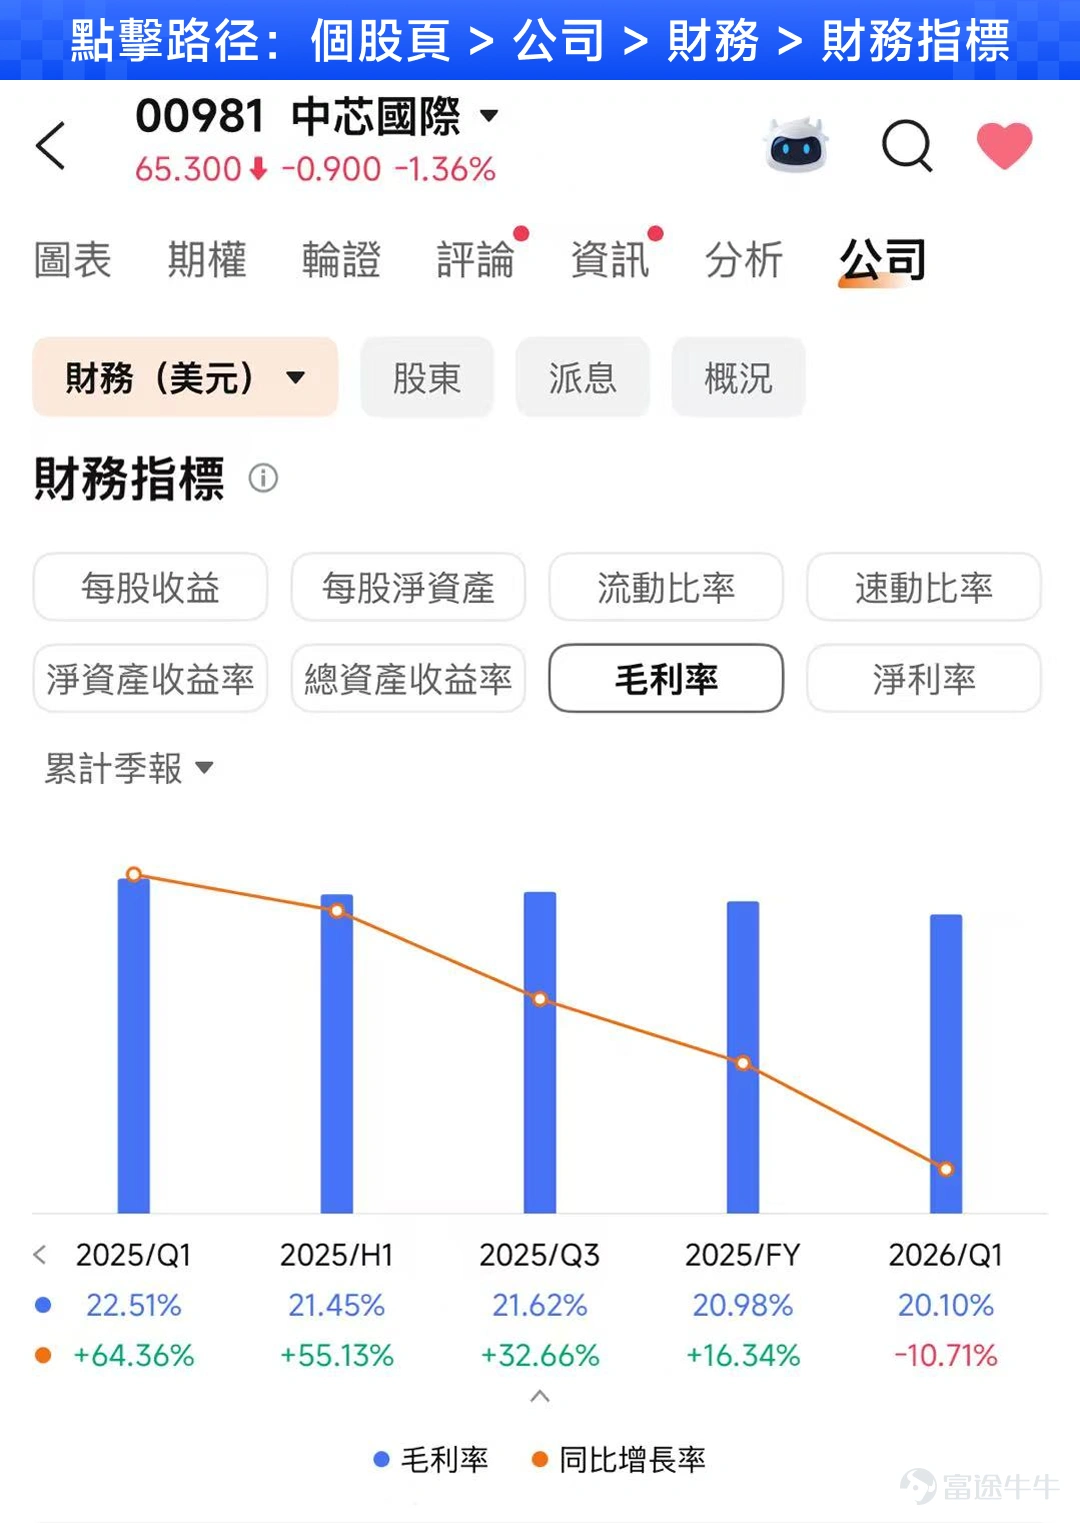
In Q1 2026, SMIC reported revenue of$2.505 billion, an 11.5% year-over-year increase; gross margin was20.1%, compared to 19.2% in the previous quarter. The company explicitly stated that the sequential improvement in gross margin for the quarter was primarily driven bychanges in product mix and higher average selling prices.。
More importantly, the company had already provided Q2 guidance last quarter:Revenue is expected to increase 14% to 16% sequentially, with gross margin projected at 20% to 22%.
Based on Q1 revenue of approximately $2.505 billion, this implies Q2 revenue should fall within the range of$2.856 billion to $2.906 billion.
Therefore, after this earnings release, a very straightforward way to assess performance is:First, check whether revenue falls within the company's own guidance range, and second, verify whether gross margin holds within the 20% to 22% range.
Only when both metrics are met can the company be said to have basically fulfilled its 'commitment' for last quarter.
Conversely, if revenue is strong but gross margin is significantly below expectations, we need to ask: Was it due to higher depreciation, a worse product mix, or pricing pressure?
This is why you can't just focus on the top-line revenue when reviewing semiconductor earnings reports.
The third key figure: capital expenditures—spending today, with impact seen only tomorrow.
There’s another extremely important metric in wafer foundry reporting that beginners often overlook:Capex, or capital expenditures.
Building a wafer fab requires massive equipment investment, so SMIC spends heavily each year on capacity expansion.
In Q1 2026, SMIC's capital expenditures were approximatelyUSD 1.563 billion, compared to approximately USD 2.408 billion in the previous quarter.
More importantly, understand the underlying financial logic:When you buy equipment today, cash goes out immediately; once the equipment is put into use, depreciation expenses are gradually recognized over many future years.
This often leads to an apparently contradictory situation for wafer fabs: strong demand, rising revenue, and aggressive capacity expansion—but once new capacity comes online, depreciation increases in tandem, temporarily weighing down gross margins.
That’s also why SMIC’s performance shouldn’t be judged solely by 'how much it earns this year,' but also by:How much is invested today and how much effective capacity and revenue that investment will generate in the future.
Financial expectations: In addition to 'consensus estimates,' investors should also closely watch SMIC’s own 'company guidance.'
Performance shouldn’t be judged by absolute figures alone, but rather byactual results vs. market expectations. Currently, market consensus expects Q2 2026 revenue to be approximately$2.824 billion。
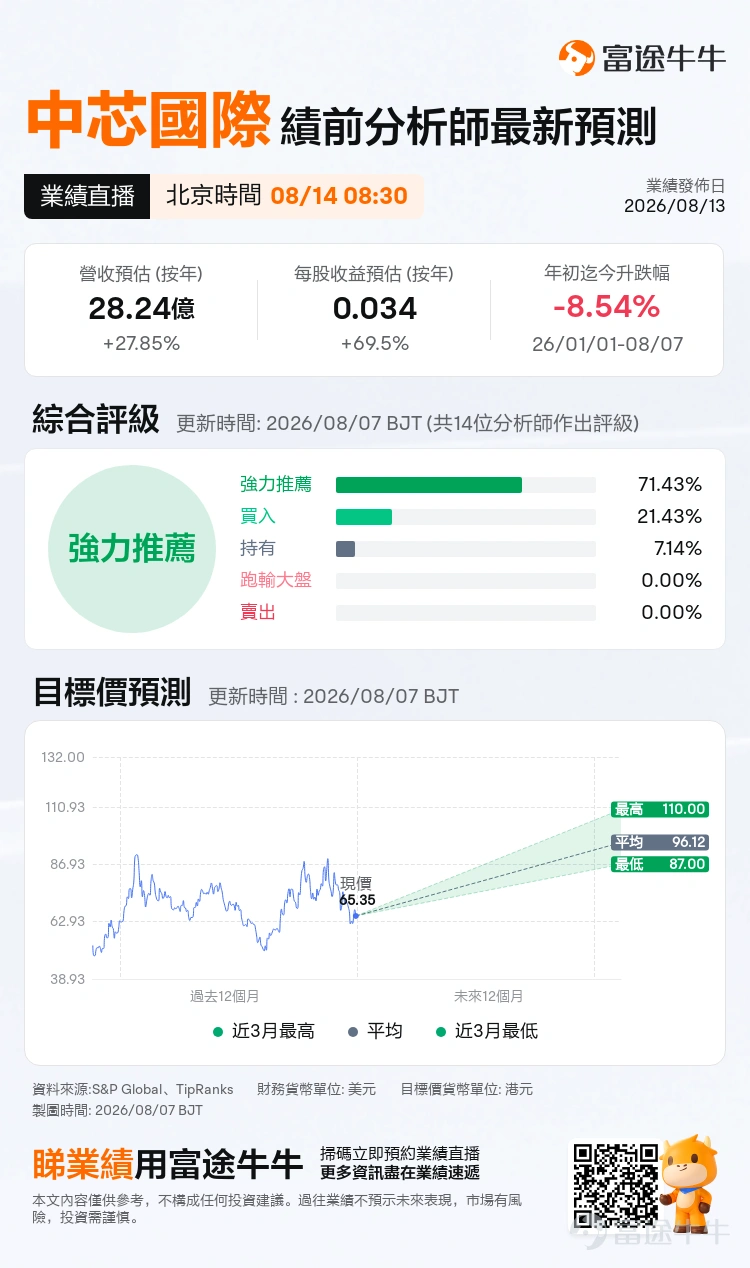
But here arises an excellent learning opportunity for beginners: the company itself provided Q2 revenue guidance last quarter, forecasting a sequential increase of 14% to 16%, corresponding to approximately$2.856 billion to $2.906 billion. In other words,the market’s consensus estimate is slightly below the company's own guidance.
For SMIC, however, another figure may be even more important:Q3’s new guidance.
Because stock prices trade on future expectations. No matter how impressive Q2 revenue turns out to be, if management suddenly signals weakening Q3 demand, declining utilization rates, or margin pressure, the market may still react negatively.
Conversely, even if current-quarter earnings are mediocre, the share price could rally in anticipation of improvement if the new guidance is significantly raised.
This is the key point to understand during earnings season:Earnings reports reflect the past; meeting expectations generally ensures a baseline outcome, but forward guidance is what the market truly values.
SMIC's earnings report actually serves as an excellent 'introductory guide to semiconductor financial statements':Break down revenue by segment to assess demand trends, check capacity utilization to gauge how busy the fabs are, examine gross margin for profitability quality, review Capex for future capacity, and then use market expectations and company guidance to determine whether it's a beat or a miss.
Once you master this framework, analyzing earnings from Huahong Semiconductor, Taiwan Semiconductor, or even other capital-intensive semiconductor companies will become much easier.
Risk Disclaimer: The above content only represents the author's view. It does not represent any position or investment advice of Futu. Futu makes no representation or warranty.Read more

Comment (1)
to post a comment
6
16