
NIU Enterprises Releases Second Quarter 2026 Financial Results
— Revenue for the second quarter was RMB 1.4404 billion, an increase of 14.7% year-over-year
— Net loss for the second quarter was RMB 1.022 billion, compared to a net profit of RMB 59 million in the same period of 2025
Beijing, China – August 10, 2026 – NIU Technologies ("NIU" or the "Company") (NASDAQ: NIU), a global leader in smart urban mobility solutions, today released its unaudited financial results for the second quarter ended June 30, 2026.
Key financial highlights for the second quarter of 2026:
• Revenue was RMB 1.4404 billion, an increase of 14.7% year-over-year
Gross margin was 16.0%, compared to 20.1% in the same period last year
Net loss was RMB 102.2 million, compared to a net profit of RMB 5.9 million in the same period last year
Adjusted net loss (non-GAAP) was RMB 982 million, compared to an adjusted net profit of RMB 137 million in the same period last year
Key operational highlights for the second quarter of 2026:
Total vehicle deliveries reached 434,687 units, an increase of 24.2% year-over-year
Vehicle deliveries in China reached 402,202 units, an increase of 26.2% year-over-year
Overseas vehicle deliveries reached 32,485 units, an increase of 3.6% year-over-year
As of June 30, 2026, the company operated 4,570 stores in China
Dr. Li Yan, Chief Executive Officer of the company, stated: "In the Chinese market, we are advancing our smart mobility strategy by applying AI-powered riding features to a broader range of everyday riding scenarios, continuously enhancing the connected riding experience."
Regarding overseas markets, we remain committed to a prudent expansion approach, continuously refining our product portfolio to meet local demand and ensure stable global operations."
Second Quarter 2026 Financial Results
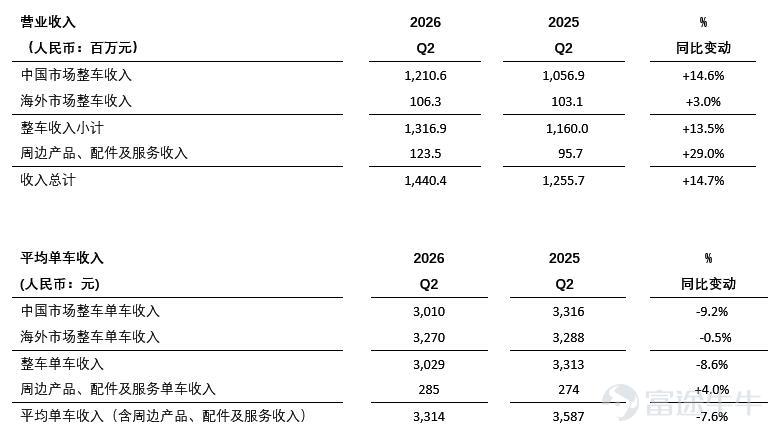
Operating revenueRevenue amounted to RMB 1.4404 billion, an increase of 14.7% year-over-year, primarily driven by a 24.2% increase in sales volume, partially offset by an 8.6% decline in average revenue per vehicle. The table below provides a breakdown of revenue and average revenue per vehicle:
• Revenue from vehicle sales in China was RMB 1.2106 billion, up 14.6% year-over-year, accounting for 91.9% of total vehicle revenue. The year-over-year growth was primarily due to a 26.2% increase in vehicle sales volume in China, partially offset by a 9.2% decline in average revenue per vehicle.
• Revenue from vehicle sales in overseas markets was RMB 1.063 billion, up 3.0% year-over-year, representing 8.1% of total vehicle revenue. The year-over-year growth was primarily driven by higher sales of electric motorcycles and electric mopeds in overseas markets.
• Revenue from accessories, peripherals, and services was RMB 1.235 billion, up 29.0% year-over-year, accounting for 8.6% of total revenue. The year-over-year growth was primarily attributable to increased revenue from Niu Technologies’ mobile app services and higher sales of accessories and peripherals in China.
• Average revenue per vehicle was RMB 3,029, down 8.6% year-over-year, primarily due to changes in the product mix in China.
Cost of RevenueCost of revenue was RMB 1.2100 billion, up 20.6% year-over-year, primarily due to higher sales volume. Average cost per vehicle (cost of revenue divided by vehicle sales volume for the period) was RMB 2,784, down 2.9% from RMB 2,866 in the same period last year, primarily due to changes in the product mix in China, partially offset by rising upstream supply chain costs.
Gross profit marginGross margin was 16.0%, compared to 20.1% in the same period last year. The decline in gross margin was primarily attributable to changes in the product mix in China and rising upstream supply chain costs, which exerted additional pressure on domestic gross margins. Additionally, lower gross margins from electric scooters in overseas markets also contributed to the decline.
Operating ExpensesOperating expenses were RMB 3.406 billion, up 28.6% year-over-year. Operating expenses as a percentage of revenue were 23.6%, compared to 21.1% in the same period last year.
· Selling expensesRMB 238.6 million (including RMB 10 million in share-based compensation expenses), an increase of 18.0% compared to RMB 202.2 million for the same period last year, primarily due to an increase of RMB 219 million in sales and marketing expenses in China (including quarterly allocations under the annual sales and marketing plan) and an increase of RMB 122 million in depreciation and amortization. Sales and marketing expenses accounted for 16.6% of revenue, compared to 16.1% for the same period last year.
· Research and development expensesRMB 51.5 million (including RMB 8 million in share-based compensation expenses), an increase of 17.8% compared to RMB 43.7 million for the same period last year, primarily driven by a RMB 44 million increase in design and testing expenses and a RMB 20 million increase in employee-related costs and share-based compensation expenses. Research and development expenses accounted for 3.6% of revenue, compared to 3.5% for the same period last year.
· General and administrative expensesRMB 50.5 million (including RMB 20 million in share-based compensation expenses), an increase of 165.2% compared to RMB 19.1 million for the same period last year, primarily due to a year-over-year increase of RMB 442 million in foreign exchange losses—this quarter recorded a foreign exchange loss of RMB 190 million, compared to a foreign exchange gain of RMB 253 million for the same period last year. General and administrative expenses accounted for 3.5% of revenue, compared to 1.5% for the same period last year.
Operating expenses excluding share-based compensationRMB 336.8 million, an increase of 30.9% year-over-year, representing 23.4% of revenue, compared to 20.5% for the same period last year.
· Selling expenses excluding share-based compensationRMB 237.6 million, an increase of 18.5% year-over-year, representing 16.5% of revenue, compared to 16.0% for the same period last year.
· Research and development expenses excluding share-based compensationRMB 50.7 million, an increase of 23.8% year-over-year, representing 3.5% of revenue, compared to 3.3% for the same period last year.
· Management expenses after deducting share-based compensationRMB 48.5 million, an increase of 205.9% year-over-year, representing 3.4% of revenue, compared to 1.3% for the same period last year.
share-based compensation expensesRMB 4 million, compared to RMB 79 million for the same period last year.
Income tax benefitwas RMB 9 million, compared to RMB 125 million for the same period last year.
net losseswas RMB 102.2 million, compared to net profit of RMB 59 million for the same period last year. The net loss margin was 7.1%, compared to a net profit margin of 0.5% for the same period last year.
Adjusted net loss (non-GAAP)was RMB 982 million, compared to adjusted net profit of RMB 137 million for the same period last year. The adjusted net loss margin was 6.8%, compared to an adjusted net profit margin of 1.1% for the same period last year.
Basic and diluted net loss per American Depositary Share (ADS)was RMB 1.26 (USD 0.19) in both cases.
Balance Sheet
As of June 30, 2026, the company’s cash and cash equivalents, time deposits, and short-term investments totaled RMB 14.758 billion. The company’s restricted cash amounted to RMB 2.179 billion, and short-term bank borrowings stood at RMB 2.200 billion.
Outlook
NIU Technologies expects its revenue for the third quarter of 2026 to be between RMB 1.863 billion and RMB 2.033 billion, representing a year-over-year increase of 10% to 20%.
The above guidance is based on information available as of the date of this earnings release and reflects the company's current preliminary expectations, which are subject to change.
Risk Disclaimer: The above content only represents the author's view. It does not represent any position or investment advice of Futu. Futu makes no representation or warranty.Read more
Comments (2)
to post a comment
1