13F機構持倉大公開!「聰明錢」在買什麼?

Buffett's successor's Q2 report card: bought $20 billion in stocks, earned $25.667 billion
On August 8, 2026, Berkshire Hathaway released its Form 10-Q filing for the second quarter and the first half of the year. $Berkshire Hathaway-A (BRK.A.US)$$Berkshire Hathaway-B (BRK.B.US)$
This marks the second major earnings report under Greg Abel’s full leadership as CEO and represents the end of Berkshire’s streak of 14 consecutive quarters of net stock sales.
In the second quarter, Berkshire recorded net stock purchases of $20 billion, including a $10 billion strategic investment in Alphabet through a private placement.
During the same quarter, share repurchases surged from $234 million in Q1 to $4.5 billion. Core operating profit came in at $12.983 billion, up 16.3% year-over-year, surpassing Wall Street’s prior expectation of $10.8 billion. Net income attributable to shareholders was $25.667 billion for the second quarter and $35.773 billion for the first half of the year.
Behind these figures lies a bigger question: now that Buffett has stepped into the role of chairman, can Berkshire continue to allocate its massive cash reserves and cash flows as effectively as it did over the past several decades? The Q2 earnings report provides the clearest answer yet.
01 The Cash Hoard Finally Moves
Berkshire has long held a substantial cash pile.
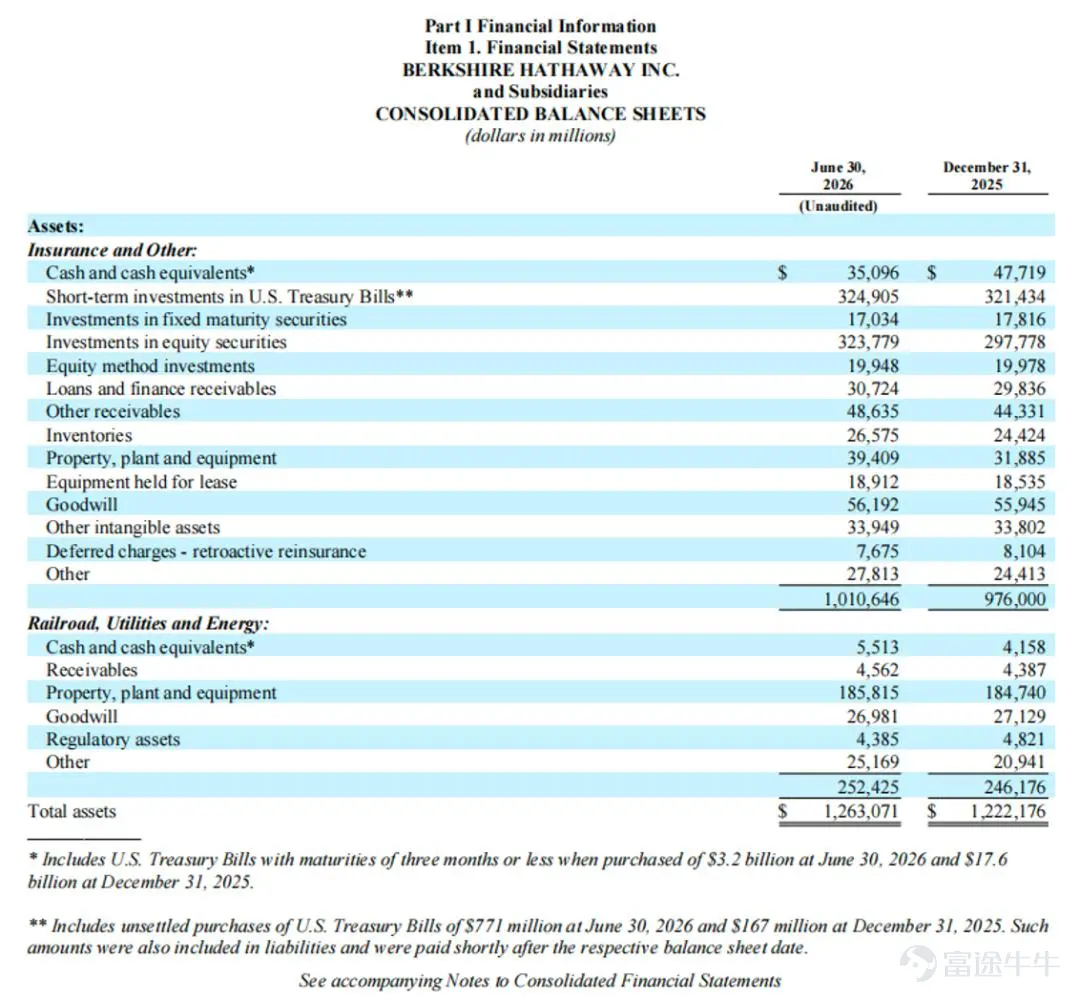
As of June 30, Berkshire held $35.096 billion in cash and cash equivalents and $324.905 billion in short-term U.S. Treasury securities. After subtracting $771 million in unsettled Treasury purchase payables, its net core liquid assets amounted to approximately $359.2 billion.
This figure marks a rare and significant decline from nearly $397.4 billion at the end of Q1, as funds were shifted out of interest-bearing Treasuries and into stocks and businesses.
The largest allocation in the quarter was Berkshire’s $10 billion strategic investment in Alphabet via a private placement.
At the time, Alphabet announced an equity financing plan totaling $80 billion, comprising a $30 billion underwritten public offering and a $40 billion ATM (at-the-market) program, to support its capital expenditures of $180–190 billion in 2026, primarily directed toward expanding AI computing infrastructure.
Berkshire Hathaway precisely timed its entry into this round, purchasing $5 billion of Class A shares at $351.81 per share and another $5 billion of Class C shares at $348.20 per share.
This was not an isolated purchase. Combined with consistent accumulation in the secondary market from Q3 2025 through Q1 2026, Alphabet has now become Berkshire’s fifth-largest equity holding, behind Apple, American Express, Bank of America, and Coca-Cola. Chevron, which had been steadily reduced, was the position displaced. These top five holdings now account for approximately 66% of Berkshire’s entire equity portfolio.
This investment breaks the long-standing stereotype that Berkshire avoids technology stocks with complex underlying business models. Abel’s rationale is straightforward.In the AI era, data centers, computing power, and foundational large models have evolved into new forms of public utilities essential to the modern economy.
Just as Berkshire heavily invested in BNSF Railway and Berkshire Hathaway Energy’s electric grid in earlier decades, its substantial stake in Alphabet’s AI infrastructure is fundamentally a bet on the foundational arteries of the digital economy for decades to come. Moreover, Alphabet’s debt-to-equity ratio of 0.16 and a reasonable forward P/E ratio of 23x–26x provide ample margin of safety.
Beyond the secondary market, Berkshire has also been active in acquiring control stakes in real-economy businesses. Following its January 2 completion of the $9.7 billion acquisition of OxyChem from Occidental Petroleum, it announced at the end of May that it would formally close on July 24 the all-cash acquisition of homebuilder Taylor Morrison Home Corporation for approximately $6.8 billion, or $72.50 per share.
This acquisition will be integrated into Berkshire’s existing building products segment, creating synergies with Clayton Homes and Johns Manville in procurement, building materials supply, and mortgage-related financial services.
Share repurchases are the other pillar. In Q2, Berkshire spent $4.5 billion repurchasing its own stock, with Class A shares bought back in the range of $716,000 to $733,000 per share and Class B shares between $476 and $488 per share.
Under Berkshire’s established policy, share repurchases may only proceed when both the CEO and Chairman Buffett agree that the stock price is conservatively estimated to be significantly below intrinsic value and that consolidated cash holdings remain no less than $30 billion.Share repurchases amounted to only $234 million in the first quarter, surging sharply to $4.5 billion in the second quarter, and this aggressive pace continued into July.
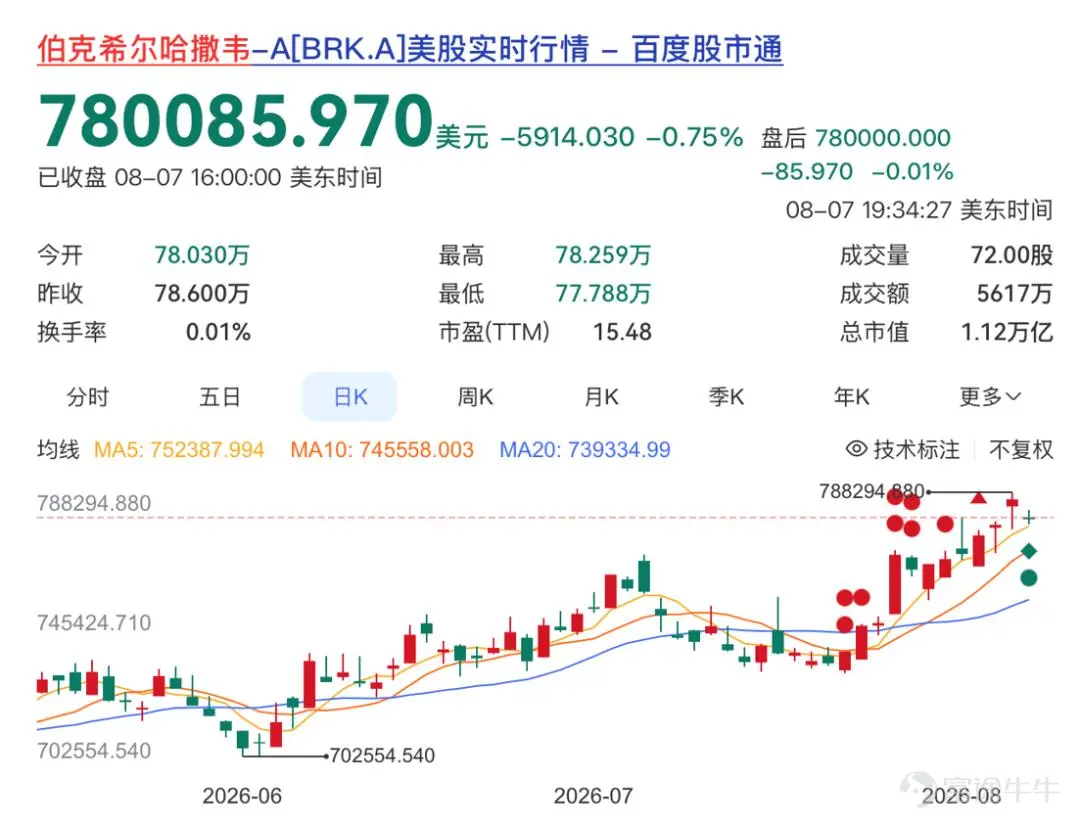
Against the backdrop of a current market capitalization exceeding $1.1 trillion and a price-to-book ratio of approximately 1.5x, this move effectively reveals management’s hand—they believe the stock is significantly undervalued. This mechanical-style buyback, backed by substantial cash flow, has objectively established an invisible support level for the share price in the secondary market.The market has dubbed it the 'Abel put.'
02 Chassis and Engine
Abel’s ability to execute so many large-scale capital allocation moves simultaneously in the second quarter was underpinned by strong performance across all business segments.
The Manufacturing, Service and Retail (MSR) segment was the biggest contributor to the earnings beat this quarter, reporting after-tax profits of $4.47 billion, a robust 24.1% year-over-year increase. Industrial manufacturing posted a 41.0% surge in pre-tax profit in the second quarter and a 32.2% increase for the first half of the year.
Precision Castparts benefited from the recovery in aerospace and industrial gas turbine demand, along with price increases passed through to customers, driving an 11.4% revenue increase in the first half of the year.
Lubrizol and IMC offset higher raw material and supply chain costs through price hikes, with IMC’s pre-tax profit soaring by 56.6%. OxyChem, which was consolidated on January 2, contributed $2.6 billion in revenue and $121 million in pre-tax profit in the first half of the year.
Within the retail segment, Pilot Travel Centers emerged as the standout performer, rebounding with a 143.7% jump in second-quarter profit to $290 million, driven by gains from fuel-price derivative contracts and improved gross margins following last year’s restructuring and asset disposals.
TTI saw first-half revenue surge by 26.5% as customers accelerated purchases amid concerns over supply chain disruptions. NetJets recorded 15.5% growth, driven by higher flight hours and increased pricing.
On the building products side, Clayton Homes saw a slight decline in home sales revenue due to high interest rates, but its financial services segment benefited from an average loan balance of $30.4 billion and higher interest rates, driving a notable increase in profits.
BNSF’s railway segment reported second-quarter after-tax earnings of $1.558 billion, up 6.3% year-over-year, with operating revenue rising 14.6% to $6.601 billion.
The recovery in freight volume was the key driver. Consumer goods shipments grew 9.3% in the quarter, supported by increased West Coast imports and tighter trucking capacity. Agricultural and energy products surged 11.5%, driven by strong grain exports and demand for petroleum fuels. Coal volumes continued to shrink by 7.9% due to lower natural gas prices and ongoing power plant retirements, though this was partially offset by higher per-car revenue and increased fuel surcharges. The release of operating leverage tells an even clearer story.
Fuel expenses soared 68.1% year-over-year to $1.173 billion due to higher oil prices and increased shipment volumes, while compensation and benefits—the largest cost component—rose only modestly by 1.9% to $1.398 billion, indicating improved underlying productivity. The effective income tax rate for the first half of the year increased by 2.9 percentage points year-over-year to 24.4%, partially dampening net profit growth.
BHE’s energy segment reported second-quarter net income of $891 million, a substantial 26.9% increase year-over-year.
The U.S. utilities segment saw its electricity margin rise by 8.1% in the second quarter and 5.4% for the first half of the year, driven by retail rate increases in certain jurisdictions, lower thermal generation costs, and production tax credits from renewable energy projects—which contributed $763 million in income tax benefits in the first half alone. The natural gas pipeline business posted a 26.4% increase in first-half net income, boosted by progress in rate cases and higher LNG demand stemming from colder weather.
However, BHE faces a looming threat: its subsidiary PacifiCorp is deeply entangled in litigation in Oregon and California related to the 2020 Santiam Canyon fires and the 2022 McKinney fire, with potential cumulative losses reaching $2.85 billion as of June 30.
In April this year, the Oregon Court of Appeals overturned the Phase I verdict in the James case, ruling that the trial court had committed prejudicial error in jury instructions. However, plaintiffs have appealed to the Oregon Supreme Court, with oral arguments scheduled for November, and PacifiCorp has already been required to post a $719 million bond.
In another antitrust lawsuit concerning real estate broker commissions, HomeServices’ previously agreed $250 million nationwide settlement remains within its four-year payment period; as of June 30, $130 million has already been paid, with the remainder pending final confirmation by the U.S. federal appeals court.
Nowhere is this more evident than in the insurance segment’s contrasting performance.
As of June 30, total insurance float rose to $177.5 billion, up $11 billion from the end of 2025, serving as Berkshire’s foundational ammunition for investing across market cycles.
However, on the income statement, underwriting profit for the second quarter declined 13.1% year-over-year to $1.731 billion, primarily dragged down by GEICO. Premium revenue totaled $11.291 billion, but the combined ratio deteriorated from 71.8% to 76.6%. Frequency of bodily injury claims rose 5% to 7%, while frequency of property damage and collision claims increased 3% to 5%. The average severity of bodily injury claims surged 10% to 12% year-over-year, and underwriting expenses jumped 27.3% year-over-year to $1.653 billion due to higher commissions and advertising costs.
These figures have sparked market concerns that GEICO is losing its pricing and customer acquisition edge in competition with Allstate and Progressive.
In contrast to GEICO’s weakness, BH Primary and BHRG performed strongly. The first half of the year saw no major catastrophe losses comparable to the $11 billion Southern California wildfires a year earlier, leading to a noticeable improvement in primary insurance loss ratios. BHRG recorded $913 million in pre-tax underwriting profit in Q2, with its property/casualty reinsurance loss ratio dropping sharply by 5.3 percentage points.
In Q2, BHRG also signed a ten-year quota-share reinsurance agreement with a wholly owned insurance subsidiary of Tokio Marine, generating $483 million in new premium revenue in a single quarter—demonstrating Berkshire’s ability to leverage its balance sheet to assume large-scale, customized global risks.
Insurance investment income fell 9.1% year-over-year in Q2 to $3.059 billion due to lower short-term interest rates, but thanks to its $324.9 billion Treasury securities portfolio, it still generated stable net investment income of $5.738 billion in the first half of the year.
03 $1.2873 trillion
Berkshire’s asset structure is becoming increasingly complex, and its reported net income fluctuates wildly because GAAP rules require unrealized gains and losses from equity investments to be directly reflected in the income statement—making traditional metrics like P/E or P/B ratios inadequate for assessing its true valuation.
Institutions like Chris Bloomstran’s Semper Augustus typically use a sum-of-the-parts (SOTP) approach to value Berkshire.
Break down each segment and value them separately.
Net cash and short-term Treasury securities amount to USD 359.2 billion, counted at par (1:1) as risk-free liquid assets. The fair value of publicly traded equity investments is USD 323.779 billion, and equity-method investments (primarily The Kraft Heinz and Occidental Petroleum) total approximately USD 19.948 billion, though this portion cannot be simply added together.
The historical cost of the equity portfolio is only USD 106.521 billion, with unrealized gains as high as USD 217.258 billion. Should these holdings be liquidated or reallocated in the future, taxes would be due by law. Accordingly, a deferred tax liability of approximately 21% must be applied to discount these unrealized gains. After accounting for this implicit tax drag, the net asset value of the publicly traded equity portfolio is approximately USD 278.155 billion. Adding the equity-method investments brings the total to roughly USD 298.1 billion.
On the wholly owned subsidiary side, BNSF reported net income of USD 2.935 billion in the first half of the year, annualizing to roughly USD 5.8–6.0 billion. Applying an 18–20x price-to-earnings (P/E) multiple—consistent with peers like Union Pacific—its standalone valuation ranges between USD 105–115 billion. Berkshire Hathaway Energy (BHE) posted first-half net income of USD 2.005 billion, annualizing to about USD 4.0 billion. Despite valuation pressure from wildfire-related litigation, applying the utility sector’s typical 15x P/E multiple yields a conservative valuation of USD 60–65 billion.
The Manufacturing, Service, and Retailing (MSR) segment contributed USD 7.669 billion in net income in the first half, annualizing to over USD 15 billion. Using a valuation range of 15–18x—aligned with diversified industrials and consumer goods sectors—its intrinsic value is estimated at USD 240–260 billion.
The insurance segment offers the greatest optionality. With USD 177.5 billion in float carrying a negative cost—assuming sustained long-term underwriting profitability—and an additional annualized franchise value of approximately USD 7 billion from underwriting operations, a blended valuation model combining P/E multiples and float discounting supports a total segment valuation of at least USD 220–250 billion.
Summing these segments conservatively and subtracting approximately USD 20 billion of non-operating, unsecured debt at the parent-company level yields an intrinsic value of roughly USD 1,287.3 billion—over USD 1.28 trillion.
Compared to a market capitalization of approximately USD 1.12–1.15 trillion as of early August 2026, the current share price remains in a discount range, implying a margin of safety of roughly 10% to 12%.
Some aggressive Wall Street analysts, using excess return models, have even projected upside valuations exceeding USD 1.5 trillion. This arithmetic underpins the rationale behind the USD 4.5 billion in share repurchases executed in the second quarter.
04 How the Market Views It
Beneath the financial statements and valuation models, global institutional investors trading Berkshire shares in the secondary market are effectively transacting on several layered narratives.
The most direct layer is the logic of a super-macro safe haven. Its $324.9 billion position in short-term Treasury bills constitutes the world’s largest private pool of risk-free capital. With 1.5-month T-bill yields around 3.8%, it generates over $12 billion annually in risk-free interest cash flow—hedging against economic slowdown while preserving the ability to pivot instantly and scoop up distressed assets during a market crash.
Digging deeper, it serves as a low-volatility proxy for AI infrastructure.
Traditional value-oriented institutions are often constrained by risk controls that prevent them from taking large positions in highly volatile, richly valued pure-play tech companies. However, by buying Berkshire Hathaway, they effectively gain indirect exposure to Alphabet’s AI computing infrastructure and Apple’s consumer electronics ecosystem—all wrapped in the armor of Berkshire’s AAA-rated balance sheet. Berkshire is increasingly becoming a low-beta (0.61), high-margin-of-safety proxy for technology.
At an even more fundamental level, it represents confirmation of a smooth transition between old and new growth engines.
Since Abel fully assumed leadership, the market’s biggest uncertainty has been whether the company would fall into decision-making paralysis without Buffett’s historic aura.
The series of moves in Q2 has alleviated those concerns. Acquiring Taylor Morrison and OxyChem strengthened its economic moat, participating in Alphabet’s share placement signaled commitment to the tech-driven future, aggressive share buybacks boosted earnings per share, and the decisive exit from inefficient holdings like Chevron demonstrated disciplined capital allocation. Wall Street is voting with its capital in favor of this combination of fiscal discipline and bold execution.
Another layer reflects a delayed catch-up trade driven by inflation resilience.
In the first half of 2026, Berkshire’s stock declined by 1.8%, significantly underperforming the S&P 500’s 10.7% gain—primarily due to the drag from its massive cash pile and the ‘bloodsucking’ effect of the tech rally.
Yet, from BNSF’s ability to pass through fuel surcharges to IMC and PCC maintaining margins through price hikes amid rising raw material costs, Berkshire’s portfolio companies have demonstrated strong pricing power. Investors are betting this fundamental resilience will eventually drive the stock price toward its sum-of-the-parts intrinsic value.
Berkshire has now passed the most sensitive phase of its leadership transition. Through a string of actions in Q2, Abel has proven that this capital deployment machine does not rely on any single individual’s flashes of insight but is instead built on systems and capital. Risks, however, have not disappeared.
PacifiCorp’s wildfire litigation could result in cumulative losses of $2.85 billion; the James case won’t see its next round of oral arguments until November, and of HomeServices’ $250 million settlement, $120 million remains unpaid—these legal costs will continue to erode BHE’s free cash flow.
The rising combined ratio at GEICO reveals potential lags behind peers in telematics-based pricing and underwriting discipline. If this float engine doesn’t turn around soon, it risks losing market share over the long term; meanwhile, the macro environment of high interest rates and weak consumer spending is already showing pressure in retail and certain manufacturing segments.
However, as long as the float system remains intact, the flywheel—comprising float generation, capital reallocation, and cross-sector cash flow reinvestment—can keep turning, and large-scale share repurchases will continue to provide a floor for the stock price amid macroeconomic volatility.
Abel’s approach differs from Buffett’s later years not in principle, but in speed.
The rule requiring both CEO and chairman approval for buybacks remains unchanged, and the rationale behind purchasing Alphabet still follows the same infrastructure-moat logic used when building major positions in BNSF and BHE. The only difference is that cash, which had remained idle for several quarters, is now being deployed incrementally to buy stocks, real estate developers, and chemical plants.The market’s vote of confidence in him reflects precisely this execution capability: adhering strictly to established rules while accelerating pace.
Risk Disclaimer: The above content only represents the author's view. It does not represent any position or investment advice of Futu. Futu makes no representation or warranty.Read more
Comment (1)
to post a comment