US Stock Market Talk | The Fed Resumes Rate Hikes After a Three-Year Pause! Is a New Shift Ahead for

This rally in US equities isn't what you think|Valuation vs. Earnings
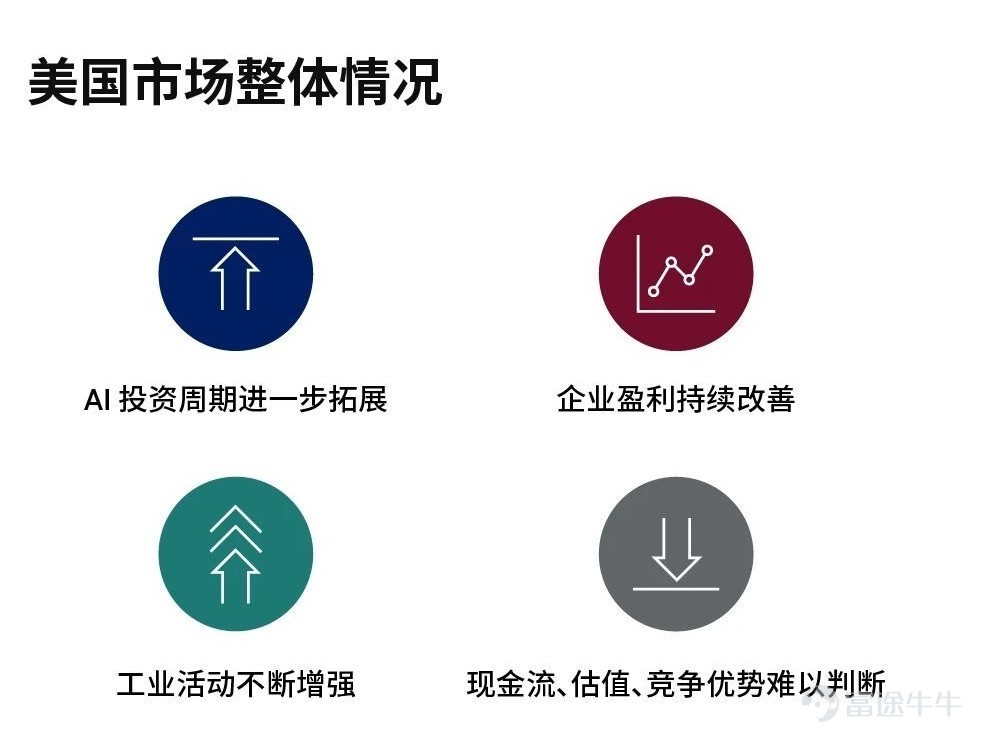
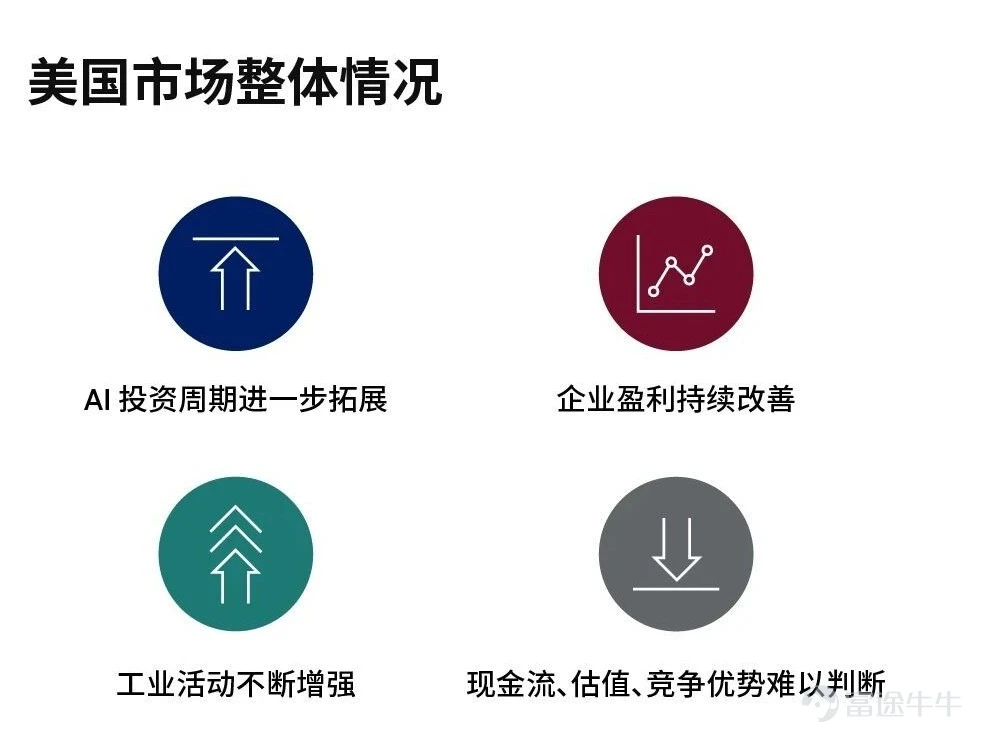
Corporate earnings continue to improve, industrial activity is strengthening, and the artificial intelligence (AI) investment cycle is expanding further. At the same time, future cash flows, competitive advantages, and valuation levels are becoming increasingly difficult to assess.
⭐️ The positive fundamental thesis remains intact
Strong earnings growth:There is a common misconception in the current market that stock price gains are primarily driven by valuation expansion. In fact, just over a year ago, the market broadly expected S&P 500 constituents to deliver earnings per share of approximately USD 265 this year; that forecast has now risen to nearly USD 340—an increase of almost 30%. The S&P 500 has climbed from around 6,000 to above 7,400 points, yet its forward price-to-earnings ratio has actually declined.¹
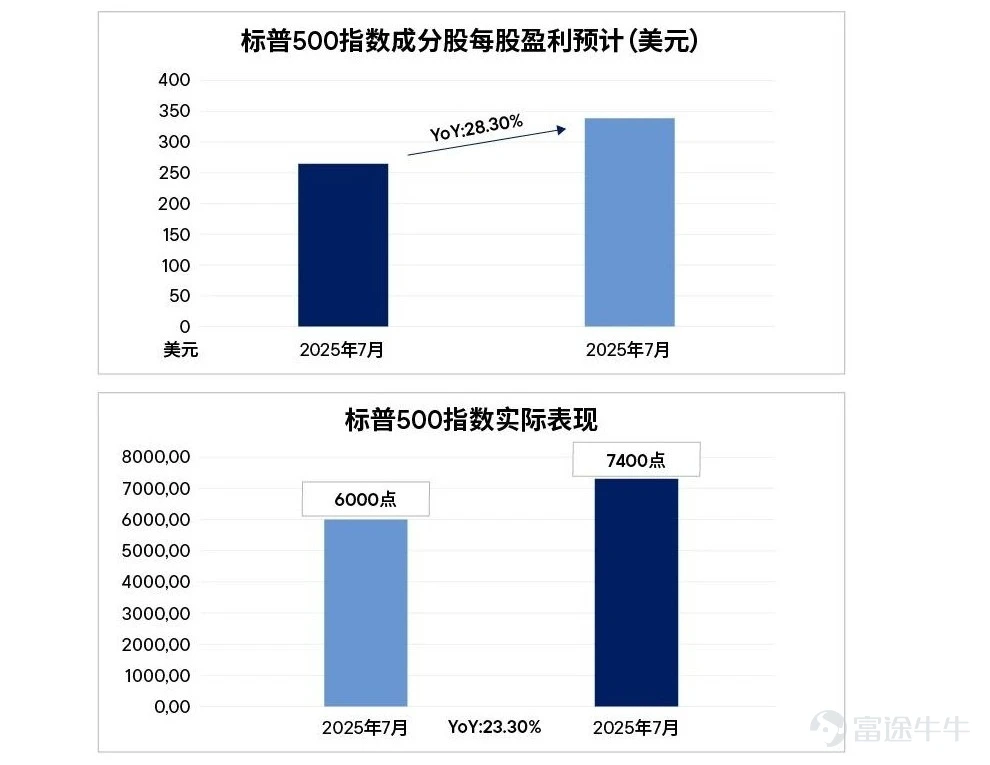
This point is critical. Investors are not simply paying higher prices for the same level of earnings; rather, earnings growth itself has been the core driver behind the market’s rise. Meanwhile, the U.S. macroeconomic environment exhibits the following characteristics:
🔹 U.S. consumers remain resilient²
🔹 Industrial activity continues to strengthen³
🔹 The AI investment cycle is broadening into the wider economy⁴
Going forward, opportunities will come alongside uncertainty. In short, several key points stand out:
🔵 AI-related spending is boosting capital expenditure
🔵 Cyclical risks in the semiconductor sector remain
🔵 AI is reshaping competitive dynamics
🔵 Long-term earnings visibility is declining
🔵 Key resource bottlenecks weigh on earnings outlook⁵
We believe this signals that future market movements could become more volatile, market divergence may intensify further, and market reactions could turn sharper when corporate earnings fall short of expectations.
⭐️ Historical Mirror
The 1990s offer a relevant precedent: strong investment booms rarely unfold smoothly. Investors often recall the eventual bursting of the dot-com bubble but tend to overlook the years-long expansion that preceded it. Over the entire decade, the S&P 500 delivered cumulative total returns of 430%, with annual returns exceeding 20% for five consecutive years from 1995 to 1999.⁶
At the same time, that period also witnessed the Asian financial crisis, the Russian ruble crisis, Y2K concerns, and multiple episodes of significant market volatility. During the 1990s, the CBOE Volatility Index (VIX) averaged in the low-to-mid 20s, whereas the current decade has seen a relatively milder average, hovering in the teens.⁷
Today’s innovation-driven market rally may last longer than skeptics anticipate and could continue generating substantial returns. Although many investors believe market conditions resemble those of a bubble, the timing of any potential turning point remains uncertain. We think this expansion cycle still has room to run. This implies investors face a choice: either accept heightened interim volatility or risk missing out on potential gains by staying on the sidelines.

Copyright © 2026. Franklin Templeton. All rights reserved.
The issuer of this document is Franklin Templeton Investments (Asia) Limited.
The commentary, opinions, or projections contained herein are based on or derived from public sources believed by the firm to be reliable. The firm does not guarantee their accuracy. This document provides general information only. Any views expressed reflect those of Franklin Templeton’s individual portfolio management teams as of the publication date and may differ from the views of other portfolio management teams, affiliated investment managers, or the firm as a whole. Any securities mentioned (if any) are for illustrative purposes only; portfolios may not hold the referenced securities at any given time. Such references do not constitute recommendations to buy, sell, or hold any security. This document should not be regarded as investment advice.Investing involves risk. Past performance referenced herein does not indicate future results.
The underlying assumptions and views expressed herein are subject to change without notice. The firm does not guarantee that the projections contained in this document will materialize. Franklin Templeton and/or its affiliates, officers, or employees shall not be liable for any direct or indirect losses you may incur as a result of your use of this document or any information, opinions, or projections contained herein. This document has not been reviewed by the Securities and Futures Commission of Hong Kong or the Monetary Authority of Macao.
Franklin Templeton and/or its affiliates, officers, or employees shall not be liable for any losses arising from the use of this document or its contents. This document may not be reproduced, distributed, or published in any form without the prior written consent of Franklin Templeton.
Risk Disclaimer: The above content only represents the author's view. It does not represent any position or investment advice of Futu. Futu makes no representation or warranty.Read more


Comments
to post a comment
2