
Non-farm payroll data to be released tonight at 20:30! Will expectations for rate cuts reignite?
United StatesThe latest July nonfarm payrolls report will be released tonight at 20:30—forecasting 80,000 new jobs and an unemployment rate steady at 4.2%.Overall, the outlook is weak, with multiple institutions predicting the data will fall short of expectations.
Moreover, whether it’s the July ADP employment report—showing only 44,000 new positions, significantly below the market’s prior expectation of 75,000—or the ISM Services Employment Index, which plunged sharply from 51.2 to 47.4, re-entering contraction territory, this week’s series of newly releasedleading indicators consistently confirm that the labor market is clearly weakening.
Adjustment of the Federal Reserve's policy framework
Compared to previous non-farm payroll reports, this release is exceptionally significant—it isthe first critical test point to verify whether the market’s current interpretive logic will shift.Over the past 40 years, the 'jobs put' has served as an implicit floor for U.S. equities: weakening employment → the Fed is obliged to cut rates → risk assets rally.The trading logic that 'bad news is good news' lies at the heart of this transmission mechanism.
However, in his remarks during the July 29 FOMC meeting, Warsh made no mention whatsoever of employment-related objectives—the Fed may subsequently advancea new framework with 'price stability' as its sole mandate, abandoning the old 'dual mandate' framework that targeted both 'maximum employment and price stability.'Under the new framework, weakening employment no longer automatically triggers rate-cut expectations. The May non-farm payroll report already offered a preview—strong employment = persistent inflationary pressure = further delay in rate cuts.More detailed analysis >>
The direction of the unemployment rate is also a key variable to watch tonight.Against the backdrop of Chair Powell having clearly abandoned forward guidance on the interest rate path, every data gap is being amplified and interpreted by the market.
Recent performance of major US stock indices
From a technical perspective,major US indices are currently in a high-level sideways consolidation pattern,awaiting the non-farm payroll data to determine the next directional move.
![United StatesThe latest July non-farm payroll report will be released tonight at 20:30—forecasting 80,000 new jobs added and the unemployment rate holding steady at 4.2%.Overall, the outlook is weak, with multiple institutions predicting the data will fall short of expectations. Moreover, whether it's the July ADP employment report—showing only 44,000 new positions, significantly below the market’s initial forecast of 75,000—or the ISM Services Employment Index, which plunged sharply from 51.2 to 47.4 and re-entered contraction territory, this week’s series of newly releasedleading indicators consistently confirm that the labor market is clearly weakening. Federal Reserve Policy Framework Adjustment Compared to previous non-farm payroll reports, this release carries exceptional significance—it marksthe first critical test point for validating whether the market’s current interpretive framework will shift.Over the past 40 years, the 'jobs put option' has been an implicit floor for US equities: weakening employment → the Fed is obliged to cut rates → risk assets rally.The trading logic that 'bad news is good news' lies at the core of this transmission chain. However, in his remarks at the FOMC meeting on July 29, Warsh did not mention employment-related objectives at all—the Fed may subsequently move forwardwith a new framework centered on 'price stability' as its 'sole mandate,' abandoning the old 'dual mandate' framework that targeted both 'maximum employment and price stability.'Under this new framework, weakening employment no longer automatically triggers expectations of rate cuts. May’s nonfarm payrolls data already offered a preview this year—strong employment = persistent inflationary pressure = rate cuts pushed further out.[Share Link: More detailed analysis >>] The trajectory of the unemployment rate is also...](https://nnqimage.futunn.com/sns_client_feed/999991/20260807/web-1786080675291-Peb4gRo1H9.png/big?area=2&is_public=true&imageMogr2/ignore-error/1/format/webp)
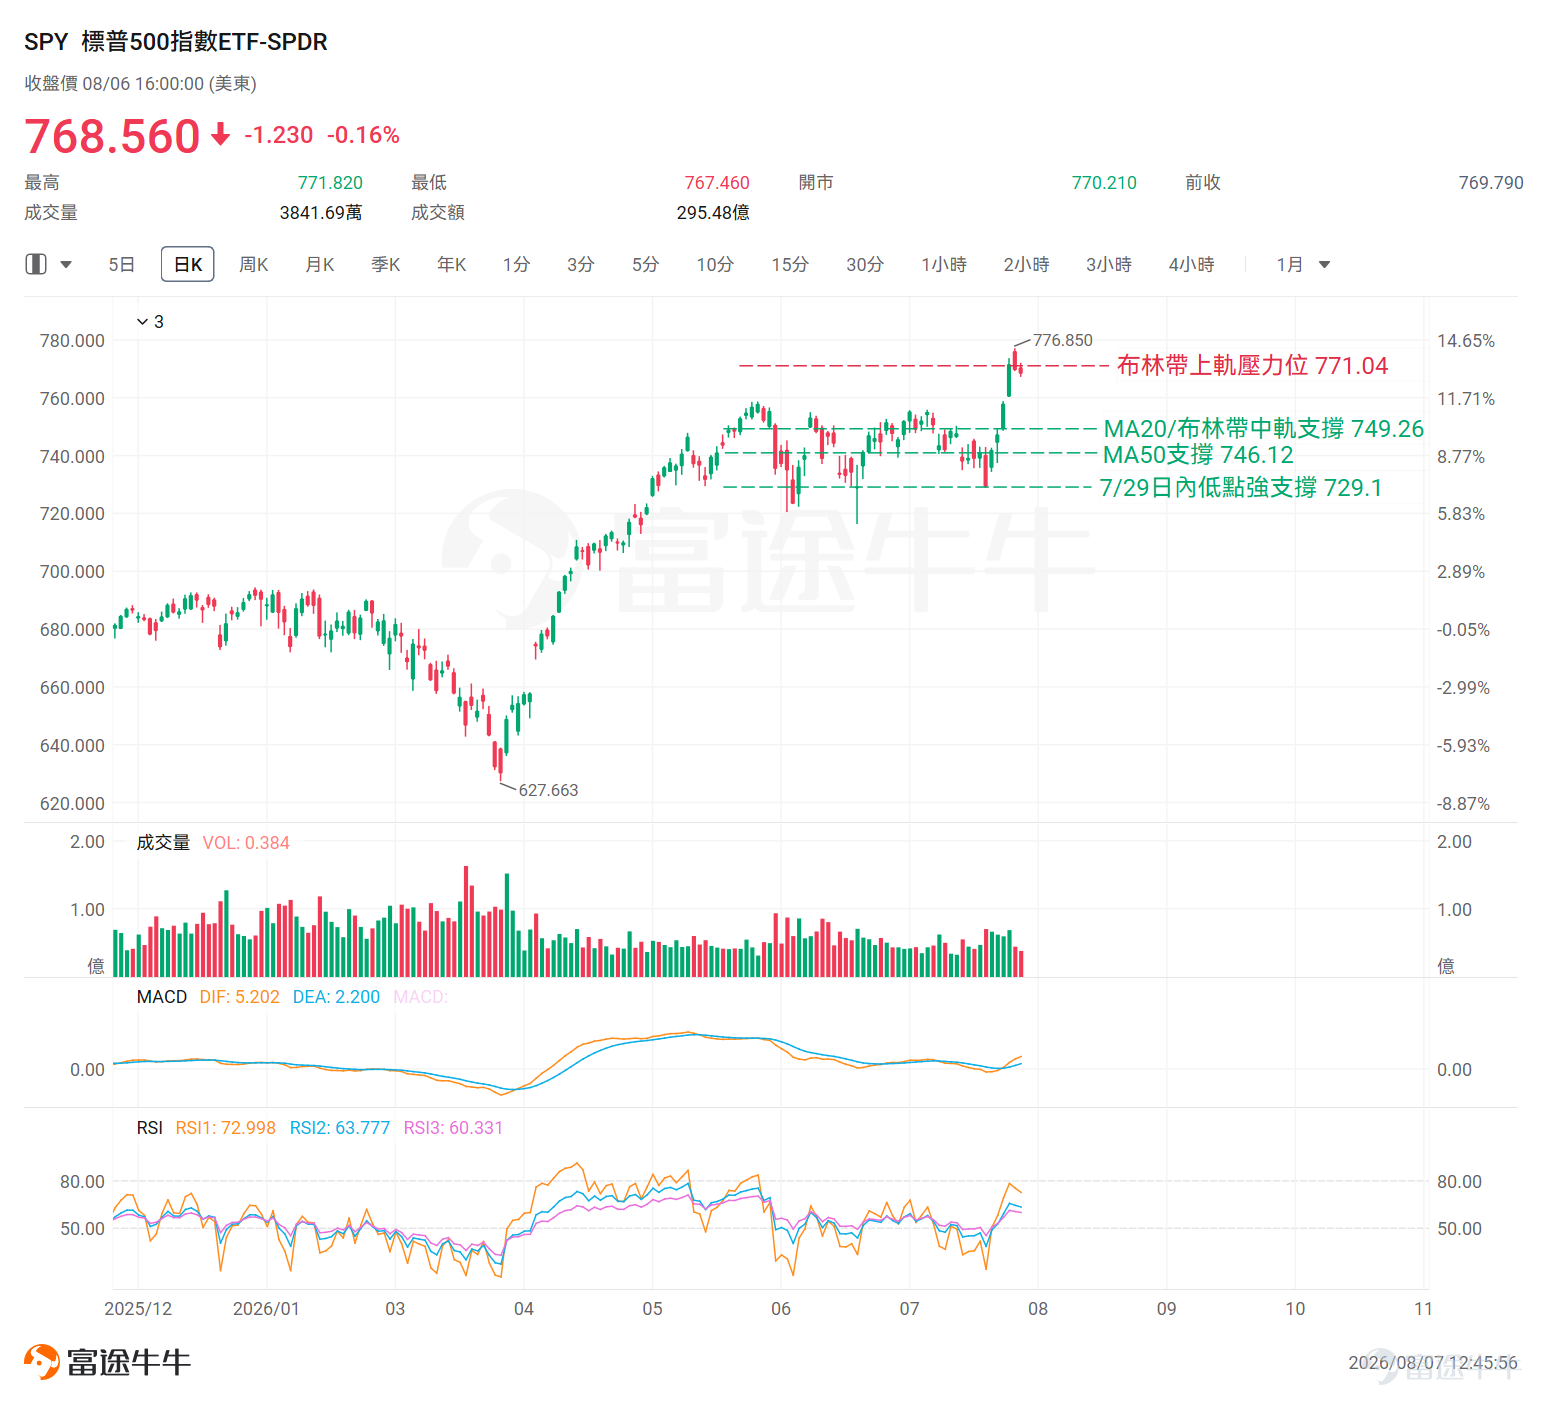
at$SPDR S&P 500 ETF (SPY.US)$ and $Invesco QQQ Trust (QQQ.US)$ Take SPY as an example. After reaching a new all-time high,it has continued its upward trend, with the price stabilizing above both short- and medium-term moving averages.The 20-day moving average ($749.26) and the 50-day moving average ($746.12) are both trending upward, forming a bullish alignment. Since the low established on July 29, the index has recorded multiple consecutive bullish candles,indicating significant upward momentum.The current price is trading between the middle Bollinger Band at $749.26 and the upper band at $771.04.The price is relatively high and has entered the upper Bollinger Band resistance zone.
On the support side,$769.51 is the low of the lower shadow on August 5, forming the nearest near-term support level.If the stock price breaks below this level, it could be seen as one confirmation signal that a pullback from the high has begun; further attention should be paid tothe dual support provided by the 20-day moving average at $749.26 and the middle Bollinger Band.—if the price falls below this level, the short-term trend structure will weaken significantly, further testingthe intermediate-term support at the 50-day moving average of $746.12becomes increasingly likely.
On the upside, resistance lies at$773.41 was the high on August 4 and serves as a key near-term resistance level.If the stock price can effectively break through and firmly hold above this level on higher volume, attention should turn to whether it can challengethe August 5 intraday high of $776.85. The upper Bollinger Band at $771.04 acts as dynamic resistance.
![United StatesThe latest July non-farm payroll report will be released tonight at 20:30—forecasting 80,000 new jobs added and the unemployment rate holding steady at 4.2%.Overall, the outlook is weak, with multiple institutions predicting the data will fall short of expectations. Moreover, whether it's the July ADP employment report—showing only 44,000 new positions, significantly below the market’s initial forecast of 75,000—or the ISM Services Employment Index, which plunged sharply from 51.2 to 47.4 and re-entered contraction territory, this week’s series of newly releasedleading indicators consistently confirm that the labor market is clearly weakening. Federal Reserve Policy Framework Adjustment Compared to previous non-farm payroll reports, this release carries exceptional significance—it marksthe first critical test point for validating whether the market’s current interpretive framework will shift.Over the past 40 years, the 'jobs put option' has been an implicit floor for US equities: weakening employment → the Fed is obliged to cut rates → risk assets rally.The trading logic that 'bad news is good news' lies at the core of this transmission chain. However, in his remarks at the FOMC meeting on July 29, Warsh did not mention employment-related objectives at all—the Fed may subsequently move forwardwith a new framework centered on 'price stability' as its 'sole mandate,' abandoning the old 'dual mandate' framework that targeted both 'maximum employment and price stability.'Under this new framework, weakening employment no longer automatically triggers expectations of rate cuts. May’s nonfarm payrolls data already offered a preview this year—strong employment = persistent inflationary pressure = rate cuts pushed further out.[Share Link: More detailed analysis >>] The trajectory of the unemployment rate is also...](https://nnqimage.futunn.com/sns_client_feed/999991/20260807/web-1786080675236-htaqcM0wQ5.png/big?area=2&is_public=true&imageMogr2/ignore-error/1/format/webp)
QQQ continues to trade in a generally bullish consolidation pattern, facing near-term pressure to digest recent gains at elevated levels.The stock price of $714.65 has moved above both the 20-day moving average ($700.46) and the 50-day moving average ($714.42), forming a bullish alignment of moving averages. The Bollinger Bands are continuing to widen, indicating heightened recent volatility.
On the support side,The 50-day moving average at $714.42 serves as the nearest dynamic support level currently.If the price falls below $714.42, further observation will be warranted.Watch whether the Bollinger Band middle band at $700.46 can provide effective follow-through support. A break below this middle band would significantly weaken the intermediate-term trend structure.
On the upside, resistance lies atThe recent high-volatility resistance zone lies between $723.85 and $725.66.The lower end of this range corresponds to the August 4 closing high and represents a key short-term resistance area to monitor. If the price can decisively break above and hold above this zone, upside continuation potential should be considered.The upper Bollinger Band at $734.71 acts as a significant intermediate-term resistance level,serving as a critical test for the current upward move.
Summary
The real focus of tonight’s nonfarm payroll data isn’t the headline number itself, but ratherHow the market interprets it. It is a pivotal moment confirming the shift from the old to the new Fed policy framework under Chair Warsh—If robust employment data continues to weigh on equities, the answer will become clearer;If markets revert to the old playbook, then the signal on July 29 is more likely just a hawkish stance within the cycle,rather than a structural overhaul, potentially reigniting expectations for rate cuts.
Risk Disclaimer: The above content only represents the author's view. It does not represent any position or investment advice of Futu. Futu makes no representation or warranty.Read more


Comments (18)
to post a comment
42
123