
July Crypto Market Recap: 'Whale Sharks' Accumulate, Triggering a 7.32% Rebound; Bitcoin Has Not Yet Bottomed, with High Probability of Falling Below $60,000 | Bitcoin | Research Report | Cryptocurrency Market Analysis
In July 2026, $Bitcoin (BTC.CC)$ Following a sharp 20.45% decline in June, Bitcoin experienced a structural rebound in July, rising 7.32% from $58,544 to $62,830.58, with an intramonth high of $66,508.72. This rebound occurred amid a backdrop of persistently rising U.S. real Treasury yields, marginally tighter Fed liquidity, rapidly increasing crude oil prices, and broad-based pressure on tech stocks—indicating that Bitcoin’s price action in July was not driven by improved macro financial conditions but primarily benefited from shifts in the crypto market’s internal supply structure and holder behavior.
The most notable change in the on-chain market is that whale clusters (addresses holding over 100 BTC) have continued absorbing floating supply. In July, this group collectively added 47,340.37 BTC, bringing their total holdings to 10.623 million BTC. Their annual absorption rate rose from 30.84% to 41.21%. Meanwhile, the average daily net inflow of BTC into exchanges dropped from 1,267.7 BTC in June to 332 BTC in July—a 73.81% decline—indicating that although exchange balances still increased slightly overall, the pace at which newly available sell-side supply entered the market slowed significantly during the month.
This internal market repair, driven by supply contraction, enabled Bitcoin to rebound despite limited new capital inflows. Net capital outflows from the market totaled $373.9 million by the end of July, narrowing by 60.27% compared to $941.2 million at the end of June. Although no substantial incremental capital entered the market, the pace of capital bleed has clearly slowed. Combined with large holders’ continued absorption of floating supply, these factors laid the foundation for the price rebound.
However, this recovery cycle still exhibits clear weaknesses. Bitcoin’s average daily spot trading volume in July was only 71,065.88 BTC, down 42.39% from June’s 123,366.43 BTC. Rising prices coincided with a sharp drop in trading volume, indicating that the rally was primarily driven by reduced sell-side supply rather than broad-based, sustained expansion in spot demand. As prices approached the $65,000–$66,500 range, profit-taking by long-term holders began to increase while dip-buying demand simultaneously waned, leading prices to retreat from monthly highs.
According to the 'EMC Labs Bitcoin Cycle Analysis Model,' Bitcoin in July operated at the transition phase between the 'decline phase' and the 'accumulation phase.' While forced deleveraging and concentrated stop-losses among short-term holders are easing, long-cycle holders remain stuck in a painful stop-loss zone. The chain-wide profit-to-loss ratio for the entire month stood at just 0.49, confirming losses as the dominant theme. Shrinking trading volumes and weak exchange inventory drawdowns—all typical characteristics of the transition from the 'decline phase' to the 'accumulation phase.'
Clearing is not yet complete, and bottoming will still take time.
Macro Finance
The macro financial environment in July posed clear headwinds for Bitcoin but did not dictate its price direction. Long-end U.S. Treasury yields, real rates, Fed liquidity, and energy prices all tightened simultaneously, constraining risk budgets for global high-beta assets. Yet Bitcoin still posted a 7.32% gain for the month, demonstrating that supply reduction and on-chain accumulation dynamics outweighed external macro pressures in pricing this month.
Fed net liquidity fell to $5.738 trillion by month-end, down 0.89% quarter-over-quarter and declining by $51.51 billion in July alone. More notably, the intra-month liquidity trajectory showed Fed net liquidity briefly peaking at $5.997 trillion on July 10 before dropping by $258.7 billion in the second half of the month. This rapid retreat from mid-month highs reduced marginal funds available within the commercial banking system and capital markets for allocating to high-risk assets. This liquidity path closely correlated positively with Bitcoin’s intramonth price trajectory.
June CPI data released this month showed a 0.4% quarter-over-quarter decline and a 3.5% year-over-year drop; core CPI was flat month-over-month and down 2.6% year-over-year. The cooling was primarily driven by a 5.7% quarterly decline in energy prices. Core PCE declined 0.1% quarter-over-quarter but remained elevated at 3.3% year-over-year. Inflation has cooled noticeably in the short term but has not yet fully normalized.
June nonfarm payroll data released this month showed an increase of only 57,000 jobs, with April and May figures revised downward by a combined 74,000. The unemployment rate edged down from 4.3% to 4.2%, but labor force participation fell to 61.5% and the labor force shrank by 720,000—indicating part of the unemployment decline stemmed from people exiting the workforce. Wages rose 3.5% year-over-year, signaling weakening labor market conditions and reducing the likelihood of a July rate cut.
At the July 29 FOMC meeting, the Fed maintained the federal funds target rate at 3.50%–3.75%, but the vote split 9-to-3, with three members advocating an immediate 25-basis-point rate hike. Even though the policy rate remained unchanged, the emergence of explicit hawkish dissent within the Open Market Committee was sufficient to dampen investor expectations for near-term easing and push up discount rates applied to long-duration assets.
However, expectations for rate hikes remain strong, and a rate hike by September is still highly probable.
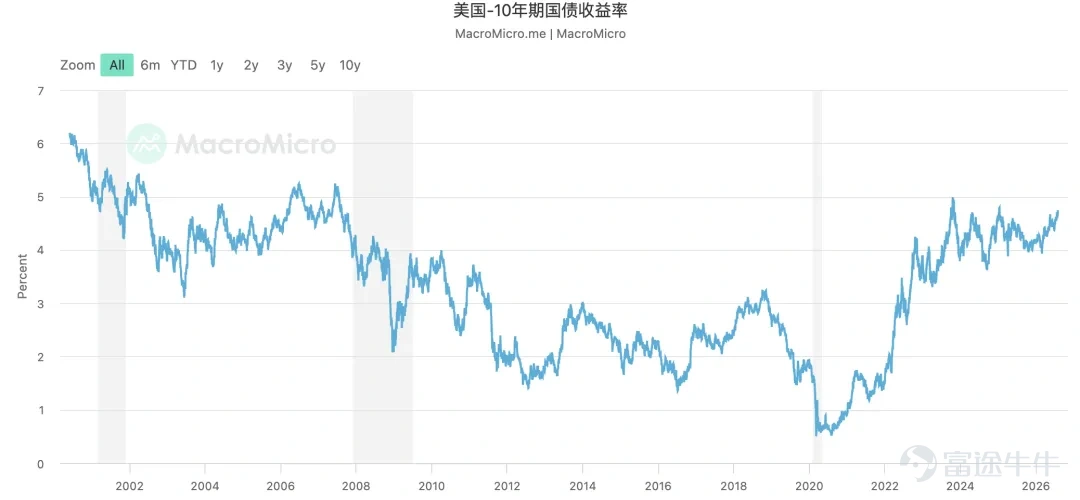
U.S. Treasury yields have therefore risen significantly. The nominal yield on the 10-year U.S. Treasury note increased by 32.7 basis points in a single month to 4.745%, while the real yield rose by 21 basis points to 2.410%, marking a monthly increase of 2.34%. Real yields represent a key opportunity cost for non-cash-flow-generating assets and high-valuation risk assets. With real yields climbing to 2.41%, investors can now earn higher real returns from low-risk assets, thereby increasing the required risk premium for holding non-yielding, highly volatile assets like Bitcoin (BTC).

The 10-year U.S. Treasury yield approaches its highest level since the pandemic once again.
Rising crude oil prices have further reinforced this constraint. As the U.S.-Iran ceasefire memorandum was effectively torn up and fighting resumed, the Strait of Hormuz was shut down again to shipping. Brent crude surged 23.59% in July, closing the month at $90.12 per barrel and briefly touching $100.69 on July 23. The sharp rise in energy prices has reignited market concerns about future inflation and term premiums, undermining the disinflationary expectations that followed the June CPI drop to 3.5%.
Performance of external risk assets confirmed macroeconomic pressures. The Nasdaq Composite declined 3.20% in July, the Russell 2000 fell 3.08%, and the Dow Jones Industrial Average edged up slightly by 0.32%. The VIX rose to 17.09 by month-end, peaking at 20.66 on July 29. Rising real rates initially weighed on long-duration tech stocks and small-cap, high-beta assets, while traditional large-cap value stocks remained relatively stable—characteristic of an environment with rising discount rates.
The U.S. Dollar Index provided partial safe-haven support. The DXY ended the month at 99.80, down 1.37% for the month, and did not strengthen in tandem with U.S. Treasury yields. The dollar’s drop below the 100 mark alleviated immediate global dollar funding pressures, preventing the macro environment from deteriorating into a severe tightening scenario marked simultaneously by dollar appreciation, rising real rates, and liquidity contraction. Gold rose 0.65% in July to $4,049.10 per ounce, also indicating that markets are grappling with pressure from rates and energy costs rather than a systemic credit crisis.
The primary macro-financial transmission channel affecting Bitcoin (BTC) is as follows: rising crude oil prices pushed up inflation expectations and term premiums; the 10-year U.S. Treasury real yield climbed to 2.41%; divisions emerged within the Federal Reserve over further rate hikes; global investors reduced their risk budgets for long-duration and highly volatile assets; BTC ETFs saw renewed outflows toward month-end; and incremental buying power in the spot market struggled to expand. This transmission chain explains why, despite rebounding on internal accumulation, BTC consistently failed to break above the short-term holder cost basis.

Coinbase’s discount rate indicates heavier selling pressure in the Americas market.
The macro environment acted only as a constraining variable on the height and sustainability of BTC’s July rebound, not as the primary driver of its price increase.
Crypto markets: Capital outflows narrowed, but new buying power has yet to recover.
The primary shift in Bitcoin market liquidity conditions in July was not a large-scale capital inflow, but rather a significant slowdown in capital outflows. Net capital outflows at month-end totaled $373.9 million, down 60.27% from the $941.2 million net outflow recorded at the end of June.
The two main capital channels—ETFs and stablecoins—exhibited the same pattern: outflows have improved but have not yet translated into consistent, sustained incremental buying power.
Bitcoin ETF flows were highly volatile during the month. On July 6, ETFs saw a single-day net inflow of $267.2 million, providing temporary support for the price rebound; however, net outflows returned on July 13 at $414.8 million and again on July 31 at $257.5 million. The average daily net inflow for the month was just $1.503 million—an amount too small to constitute the institutional capital scale required for a sustained uptrend.

Capital outflows have eased.
Stablecoin buying power remains weak—contraction has slowed, but total reserves continue to decline. The monthly average of the stablecoin buying power indicator improved from -$7.52 billion in June to -$4.331 billion in July, narrowing outflow pressure by 42.41%. However, total exchange stablecoin reserves still declined by 6.34%, falling to $65.488 billion by month-end, while the stablecoin supply ratio rose to 4.83. Declining stablecoin reserves indicate that crypto-native capital is still withdrawing or reducing risk exposure, and the market has not yet re-established the buying power needed for another upward cycle.
Market supply-demand imbalances eased significantly compared to June, though not reversed. A more precise assessment is that the market shifted in July from June’s one-sided deterioration—characterized by continuously rising new supply and rapidly declining buying power—to a phase of temporary equilibrium marked by reduced supply pressure and slowing capital outflows. This provided room for a price rebound, though the rebound was not driven by large-scale expansion on the demand side.
This is corroborated by spot trading volume. Bitcoin’s average daily spot trading volume in July fell to 71,065.88 BTC, down 42.39% from June. Limited capital facing even tighter floating supply was sufficient to push prices higher for a correction, but insufficient to sustain a trend expansion.
The most decisive internal change in the market in July occurred in holder composition. Whale groups added 47,340.37 BTC in a single month, increasing their total holdings by 0.45% to 10.623 million BTC. Their annual absorption rate surged from 30.84% to 41.21%, indicating that large holders are absorbing available floating supply at a pace significantly exceeding new issuance.
Large holders’ accumulation became the main driver of July’s price rebound because months of consecutive declines had already significantly degraded the quality of floating supply. After prices broke below $60,000 in June, many short-term holders were forced to liquidate, and longer-cycle holders also executed concentrated loss-driven sales. Following this transfer of coins, fewer holders remained willing to sell at low prices, and new selling pressure gradually diminished. Under these conditions, even without substantially increasing their absolute purchase volume, large holders could exert stronger price influence by consistently absorbing the limited available supply.
Exchange data supports this view. Total Bitcoin balances on exchanges increased slightly by 10,281 BTC in July, reaching 3.312 million BTC—a mere 0.31% rise. More importantly, average daily net inflows to exchanges dropped from 1,267.7 BTC in June to just 332 BTC in July, a decline of 73.81%. While total inventory remains relatively high—indicating latent supply hasn’t disappeared—the daily influx of new sell-side orders has markedly decreased, significantly reducing immediate selling pressure compared to June.

Selling pressure eased temporarily in July.
The supply structure between long-term and short-term holders underwent a phase of rebalancing. Long-term holder supply decreased by 22,571.5 BTC to 14.924 million BTC, down 0.15%; short-term holder supply increased by 26,013.55 BTC to 1.828 million BTC, up 1.44%. In the later stages of a bear market, it is typical for long-term investors—especially those holding through a single cycle—to be forced to cut losses and capitulate under pressure.
However, conditions among short-term holders improved significantly compared to June. The supply from short-term holders in unrealized loss positions declined from 1.775 million BTC to 1.528 million BTC, a reduction of 13.93%. On one hand, the price rebounded from around $58,500, allowing some buyers who entered at lower levels to exit their losing positions; on the other hand, short-term holders previously facing significant unrealized losses had already largely exited in June. The reduction in underwater holdings within the short-term cohort indicates diminished marginal selling pressure from concentrated stop-losses.
Thus, the complete internal transmission chain behind Bitcoin’s July rebound can be summarized as follows: deep declines in June cleared out some weak hands, reducing the supply of BTC held at a loss by short-term holders; new inflows of BTC into exchanges declined, easing immediate selling pressure; whale and shark entities continued absorbing floating supply, further tightening the effective tradable supply; and with capital outflows slowing and ETFs seeing temporary inflows, even modest-sized
As prices rebounded, Bitcoin’s valuation metrics recovered from the deeply discounted levels seen in June, though they remain in the low-to-neutral range overall. Bitcoin’s aggregate MVRV rose 8.18% from end-June levels to 1.19, meaning the market value is only 19% above the network’s realized value—a relatively low level. Profitability metrics show a clear improvement in market-wide losses compared to June. The all-chain profit-to-loss ratio rebounded to 0.96 in July, yet the total realized loss for the month across the entire network reached $10.19 billion, underscoring that deleveraging remains severe.
Bitcoin’s valuation structure in July exhibited the classic pattern of 'strengthened cost support below, but heavy overhead resistance above.' The network-wide realized price of $52,878 and the long-term holder cost basis of $48,815 formed medium- to long-term value support zones, while the short-term holder cost basis of $69,076 served as the key level to validate any near-term trend reversal. The highest rebound price in July occurred on the 21st at $66,923.95, falling short of the short-term holder cost basis and revealing underlying weakness.
The derivatives market remained generally resilient with low fragility in July. Perpetual contract open interest rose to $58.21 billion by month-end, up 3.93% quarter-over-quarter; average monthly open interest stood at $58.248 billion, an increase of 5.26%. Open interest expanded moderately alongside price recovery, but at a significantly slower pace than during prior leverage-driven rallies, indicating market participants did not re-establish overly aggressive directional positions during the rebound. Funding rates remained near 0.00006, at a moderate level, with no signs of longs paying elevated funding costs. Directional skew rose to $3.946 billion, up 63.82%, reflecting a modest positive exposure to the price rebound in derivatives markets—but without evolving into a fragile structure characterized by high funding rates, excessive leverage, and one-sided crowding.
Average daily futures trading volume declined by 31.46% to $34.468 billion, consistent with the contraction in spot volume. The 7-day average liquidation amount across the network dropped by 61.52%, with average long-side liquidations amounting to just $19.86 million. The sharp decline in liquidations suggests that the forced deleveraging seen in June has largely concluded, eliminating immediate downside risk from cascading long liquidations—but also confirming that July’s rebound was not driven by highly leveraged buying in the futures market.
Integrating data on capital flows, supply structure, valuation, and leverage, Bitcoin’s internal market health improved from June’s 'fragile capitulation' to a 'structurally driven rebound marked by price-volume divergence.' Accumulation by large holders, declining short-term loss supply, reduced net exchange inflows, and lower leverage fragility collectively support a thesis of accumulation and early recovery. However, the 42.39% drop in spot trading volume and prices remaining below the short-term holder cost basis indicate a low-quality rebound. Indeed, after weakening again post-July 22, prices continued to decline, marking the end of July’s tepid rally.
Market Implications
We assess that the essence of Bitcoin’s market movement in July was a bear-market bounce—triggered by structural recovery driven by large-holder accumulation and reduced immediate selling pressure following June’s sharp selloff—and that this rebound has most likely already failed.
The full transmission chain is as follows: Bitcoin prices dropped by 20.45% in June, prompting short-term holders and single-cycle long-term holders to execute concentrated stop-losses, completing a round of weak-hand capitulation. Entering July, the supply from short-term holders in loss positions declined by 13.93%, while net daily inflows of BTC into exchanges fell by 73.81%. Miner spot selling remained largely stable, with new sell-side pressure significantly reduced. Whales and sharks accumulated 47,340.37 BTC, pushing the annual absorption rate up to 41.21% and continuously soaking up floating supply. Meanwhile, net capital outflows narrowed by 60.27% compared to June, and ETF monthly average fund flows turned positive from negative, jointly driving a 7.32% price rebound amid contracting supply and slowing capital bleed.
This month’s market movement should be primarily attributed to supply dynamics and holder behavior, rather than macro financial conditions or large-scale capital inflows. Spot demand and fund flows acted as secondary amplifiers this month.
The market’s most critical contradiction currently lies between aggressive accumulation by large holders and severely insufficient spot turnover. Whale and shark holdings increased by 47,340 BTC, providing price floor support; however, average monthly spot trading volume was only 71,065.88 BTC, down 42.39% from June, indicating insufficient market depth. Should prices enter the dense cost zone of $65,000–$69,000, profit-taking from long-term holders and unwinding by short-term holders exiting losses will simultaneously increase, overwhelming limited spot buying capacity and making impact-free absorption unlikely.
Conclusion
From the perspective of the 'EMC Labs BTC Cycle Assessment Model,' Bitcoin remains within the capitulation phase of a cyclical bear market, specifically at the transitional stage between the 'decline phase' and the 'accumulation bottoming phase.' Against a backdrop of macro tightening, July’s price rise should be characterized as a weak rebound driven by on-chain capital bargain-hunting following June’s sharp decline, rather than a genuine bottom reversal.
Although the extent of capitulation eased somewhat in July, it remains incomplete. The current relief is likely just a temporary bounce during an ongoing downtrend. As macro conditions deteriorate and on-chain investors—particularly single-cycle long-term holders—accumulate mounting unrealized losses over time, a drop below $60,000 within the next two months is highly probable.
The above analysis is provided by EMC Labs.
———————————————————————
About EMC Labs
EMC Labs is a partner of Victory Securities, and together they have launched the only virtual asset fund approved by the SEC to accept stablecoin subscriptions—the Victory EMC BTC Cycle Fund. EMC Labs was co-founded by seasoned virtual asset investors and data scientists, with a core team hailing from JD.com Finance, Bell Labs, Marsbit, and other companies. EMC Labs has invested substantial resources in building a professional engine to analyze Bitcoin’s on-chain data and technical indicators.
Disclaimer
Investment involves risks, and investors should take note. The value of securities and investments can go up as well as down and is not guaranteed. Investors may not get back the original investment amount, and past performance is not necessarily indicative of future results. Victory Securities’ securities trading services are provided by Victory Securities Limited (hereinafter referred to as “Victory Securities”). This document was prepared and authorized for release on this platform by Victory Securities Limited, and the information contained herein is for reference purposes only. Victory Securities Limited reserves the right to make changes or terminate at any time without prior notice. All information provided on this platform, including this document and its contents, may not be reproduced, linked, reposted, or otherwise copied for publication or commercial use by any media, website, or individual without prior written authorization from Victory Securities. Authorized users must acknowledge that the source material originates from Victory Securities when using this document and its content, and commit to complying with relevant laws and all international conventions regarding internet usage, refraining from illegal purposes or unlawful use of this document. Violators will bear all associated legal and financial responsibilities. Data or figures quoted in this document may come from third parties; Victory Securities does not guarantee the accuracy of such third-party data or materials, nor will it assume liability for the fairness, accuracy, timeliness, completeness, or correctness of any data, forecasts, and/or opinions contained herein, nor the benchmarks upon which such forecasts and/or opinions are based. Any forward-looking statements in this document do not constitute guarantees of future performance, and actual circumstances or developments may differ significantly. This document is not and should not be considered or construed as an offer, invitation, solicitation, recommendation, advice to buy or sell any investment products, or as a basis for investment decisions, nor should it be interpreted as professional advice. Readers or those making investment decisions should fully understand the risks involved and the legal, tax, and accounting characteristics and consequences, and decide whether investing aligns with personal objectives and risk tolerance. Seek appropriate professional advice if necessary. In certain countries, the distribution and circulation of this document may be restricted by law or regulation, and recipients should be aware of and comply with such restrictions.
Risk Disclaimer: The above content only represents the author's view. It does not represent any position or investment advice of Futu. Futu makes no representation or warranty.Read more
Comments
to post a comment