
US-Japan Intervene to Prop Up Yen — What's Next for US Stocks?

Lessons from the Dot-com Bubble for This Round of CSP AI Capital Spending (Part I): Demand Remains Strong, but Returns Are Beginning to Diverge
Recently, the AI hardware market has corrected significantly, and open-source models are rapidly improving in capability. The market continues to look to CSPs for evidence on the health of the AI boom. Investors are no longer just focused on how many GPUs cloud providers will buy—they increasingly want to see ROI data that proves the sustainability of this CAPEX. The latest earnings reports from the four major tech platforms show that Google Cloud and Amazon Web Services (AWS) continue to accelerate both revenue and profits, Microsoft’s cloud order backlog remains resilient, and Meta’s advertising business is growing rapidly. At the same time, Alphabet and Amazon’s operating cash flow for the quarter already fell short of covering their cash capital expenditures, and Meta’s free cash flow after infrastructure build-out is also minimal. Industry demand and capital returns are now moving at two different speeds.
In my previous piece, 'The Journey of a Token (Part II): Is There an AI Bubble?', I primarily discussed the AI cycle through the lenses of compute supply and demand, token pricing, and application demand. This time, I focus on analyzing CSP financial statements: How much revenue did the last round of data center CAPEX actually generate? How long will it take for current investments to come online? And if stock prices tend to peak before the industry cycle does, which financial metrics should investors monitor in advance?
I. How Capital Expenditures Translate into Revenue
From the time capital expenditures are paid until they appear on the income statement, they go through three transformation steps. Only after chip procurement, data center construction, power grid connection, and network commissioning are completed does a data center become capable of offering sellable compute capacity; cloud vendors can recognize revenue only when customers actually use this capacity; and only after deducting costs for power, operations, networking, depreciation, and software investment does this revenue translate into profit and cash recovery. This entire chain can be distilled into one sentence:
Capital expenditures → Available capacity → Utilization rate → Revenue → Profit → Operating cash flow
Servers can come online within a few months, but large-scale data centers and new power infrastructure often take longer. Revenue can ramp up quickly after assets are deployed, while asset costs enter the income statement gradually over many years through depreciation. It is entirely possible for a single earnings report to simultaneously show accelerating cloud revenue, improving margins, and declining free cash flow—because these reflect different construction phases. Near the peak of an industry cycle, the combination typically features slowing revenue and profit growth from newly added capacity, while the company remains constrained by ongoing projects, long-term procurement commitments, and power contracts, causing cash coverage to continue deteriorating.
II. Lessons from the Dot-com Bubble Case Study
The capital expenditure chain during the dot-com bubble broadly comprised four layers: network operators like WorldCom and Qwest laid fiber-optic networks; Cisco sold routers and switches; firms such as JDS Uniphase supplied optical communication components; and server and IT infrastructure vendors completed enterprise-side deployments. Network operators decided whether to expand capacity, while equipment and component suppliers scaled production based on orders. The same metric carried different implications for companies at different points in the supply chain. When operators cut capex, it often signaled weakening downstream equipment demand; when equipment makers themselves reduced capex, it usually reflected a reactive contraction following softening demand. Operating cash flow, revenue, inventory, and capital expenditures cannot be compared horizontally without accounting for a company’s position in the industry value chain. Notably, that cycle lacked dedicated CSP platform companies. Comparing WorldCom with today’s CSPs reveals that telecom operators back then relied far more heavily on external financing. Today’s top four CSP platforms primarily generate cash from software, advertising, e-commerce, and legacy cloud businesses. To better understand CSPs, analysis should extend beyond WorldCom to include contemporaneous companies like Microsoft, Yahoo, Amazon, and AOL.
III. Financial Peaks at Platform Companies Do Not Follow a Uniform Timeline
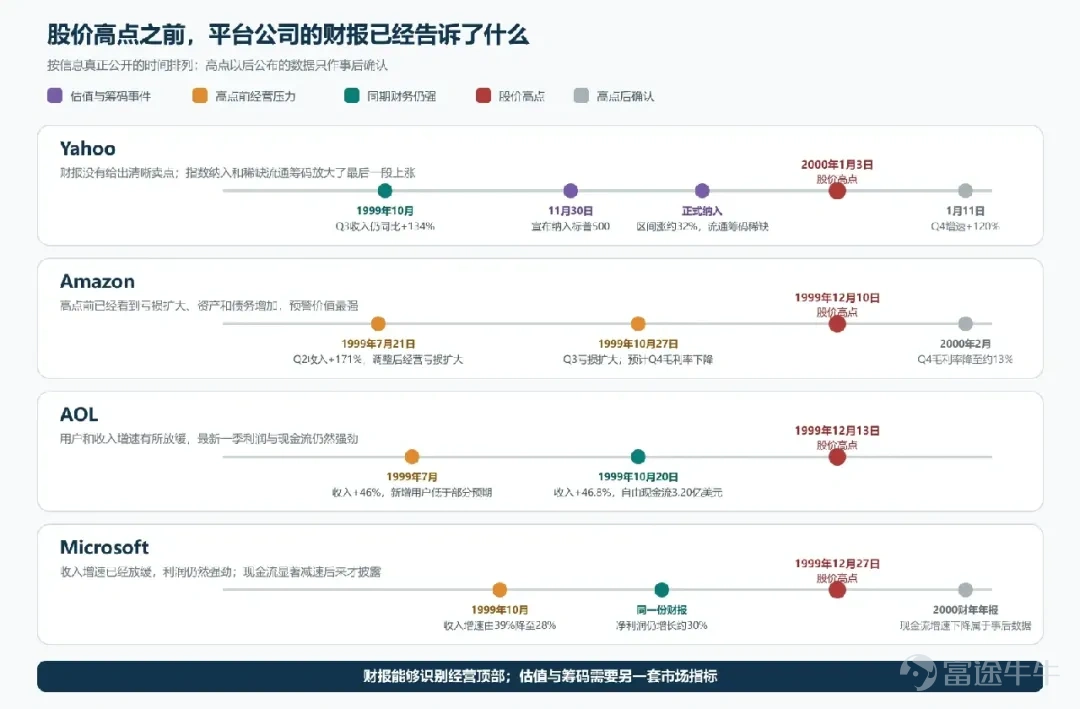
Yahoo: A peak driven by valuation and share float dynamics, with financial statements offering no clear sell signal
Yahoo’s stock reached its all-time high on January 3, 2000. In the first three quarters of 1999, the company reported year-over-year revenue growth of approximately 181%, 155%, and 134%—a decelerating trend, yet still triple-digit growth, with no concurrent deterioration in cash or profits. On January 11, it reported fourth-quarter revenue growth of 120%; and in April, first-quarter 2000 revenue also grew by 120%. These figures hardly support the claim that revenue had already stalled before the stock peaked.
Market structure offers a more direct explanation. On November 30, 1999, S&P announced Yahoo’s inclusion in the S&P 500 index. Research shows Yahoo’s stock rose about 32% between the announcement and formal inclusion. At the time, only roughly 10% of shares were freely tradable, yet index funds bought shares based on total market-cap weighting, creating a severe short-term supply-demand imbalance. This event explains why the final surge was so steep, though it does not precisely pinpoint why January 3 became the absolute peak.
Yahoo is better categorized as a 'valuation and float-driven peak.' Marginally slowing revenue growth heightened the fragility of its lofty valuation but did not produce a tradable fundamental sell signal. This case reminds investors that financial early-warning systems cannot capture all market tops; valuation, capital flows, and tradable share float require a separate set of market-based indicators.
Amazon: Operational pressures were already evident before the peak
Amazon provided the clearest operational warning among the four companies. In its second-quarter results announced in July 1999, revenue rose 171% year-over-year, yet adjusted operating losses widened from approximately $12.8 million a year earlier to about $67.3 million. Revenue in the third quarter, reported on October 27, still grew by 132%, but adjusted operating losses expanded further—from roughly $20.8 million to $79.2 million.
The balance sheet for the same period showed that net fixed assets increased from $29.8 million at the end of 1998 to $221 million, while long-term debt and other items rose from $348 million to $1.462 billion. Management also projected a decline in fourth-quarter gross margin, a slight increase or stabilization in fulfillment expense as a percentage of sales, and higher marketing expenses. All this information preceded Amazon's stock price peak on December 10, 1999. The fourth-quarter results disclosed in February 2000 further confirmed the pressure: revenue continued to grow rapidly, but gross margin fell from approximately 19.8% in the third quarter to about 13.0%, adjusted operating losses widened to $175 million, and fulfillment expense as a percentage of sales rose to 16%.
Amazon’s challenges that year went beyond typical deceleration from a high base. Fixed assets, debt, fulfillment costs, and losses were all rising simultaneously, indicating the company needed to deploy more capital just to sustain growth. Persistently negative free cash flow alone does not indicate timing; it was the continued deterioration in unit economics combined with an increasing capital burden that served as the operational warning ahead of the peak.
AOL: Growth momentum had slowed, but profits and cash flow were still strengthening
AOL’s stock price reached a historical high on December 13, 1999. Not all metrics maintained their prior pace leading up to that peak: revenue growth in early 1999 was around 62% year-over-year, but declined to roughly 46% and 47% in the June and September quarters, respectively; the June quarter added 755,000 new subscribers, which was at the low end of some analysts’ expectations. Both user and revenue growth slopes had already shown signs of slowing.
However, AOL’s last pre-peak earnings report did not signal deteriorating operations. On October 20, the company reported first-quarter fiscal 2000 revenue of approximately $1.467 billion, up 46.8% year-over-year, with net income of about $184 million; free cash flow surged from $47 million a year earlier to $3.20 billion. Although growth had moderated compared to earlier periods, profitability and cash generation had clearly strengthened.
AOL presented a mixed dashboard at the time: slowing user and revenue growth signaled declining tolerance for lofty valuations, while strong profits and cash flow still supported operational resilience. Labeling it as 'no financial metric had weakened' would overlook the former point, while categorizing it as a fundamentals peak already confirmed by earnings reports would miss the latter.
Microsoft: Revenue growth had already slowed, but cash flow signals emerged later
Microsoft’s stock price hit a then-historical high on December 27, 1999. In the June 1999 quarter, revenue grew 39% year-over-year, net income was approximately $2.2 billion, and earnings per share rose 60%; by the September quarter, revenue growth had slowed to 28%, though net income still increased by about 30%. Investors had already observed a flattening revenue growth trajectory before the peak, but also saw that profitability remained robust.
Microsoft’s operating cash flow did indeed slow significantly later on. Fiscal 1999 operating cash flow was approximately $13.137 billion, up about 56% year-over-year; in fiscal 2000, it rose further to $13.961 billion, but growth slowed to roughly 6%. The issue is that full fiscal 2000 data wasn’t disclosed until July 2000—more than six months after the stock price peak. While it confirmed that fundamental growth had stepped down afterward, it cannot be retroactively treated as a leading indicator publicly available by December 1999.
At the time, Microsoft primarily relied on high-margin cash flows from Windows, Office, and server software licensing, and its investments in the internet had not yet evolved into the large-scale data center construction seen today. Its role in this article is to illustrate that revenue growth deceleration can appear first, while profit and cash flow confirmation may lag; extremely high valuations and regulatory risks can also alter the timing of stock price adjustments. However, it is not a historical replica of today’s capital-intensive CSP investment model.
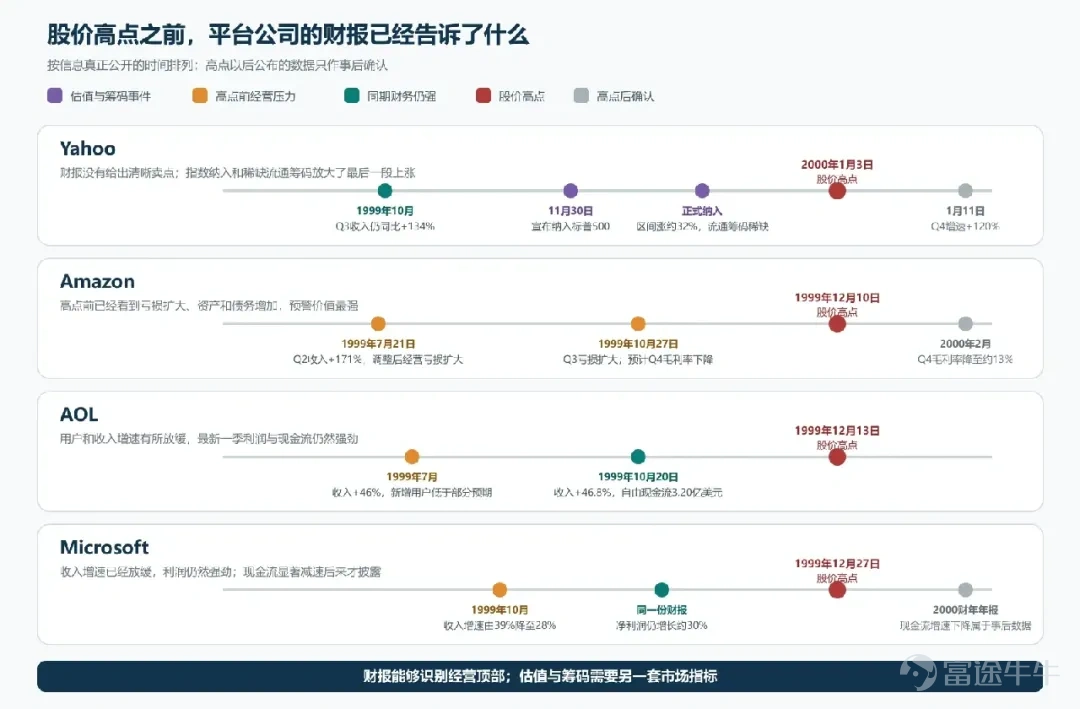
Figure 1: Purple markers indicate valuation and float-related events, orange markers denote disclosed operational pressures prior to the peak, green markers show still-strong financial results during the same period, and gray markers reflect confirmations only obtained after the peak. The four companies correspond to three types of market tops, making it impossible to derive a uniform sequence for financial peaking.
IV. What we learn from historical cases is an observation sequence, not a uniform threshold
The four companies represent three distinct scenarios. Yahoo’s financial reports did not provide a clear sell signal—the top was driven by valuation and float dynamics; Amazon had already shown deteriorating unit economics and capital burden before its peak; AOL and Microsoft exhibited only partial slowdowns in growth metrics, while profits or cash flows remained robust. Historical examples do not prove that any single metric—operating cash flow, revenue growth, or gross margin—necessarily peaks first.
Market indicators identify the first type of risk. Valuation, passive fund flows, tradable float, leverage, and regulatory changes can shift stock prices even when financial reports remain strong. Operational indicators identify the second type of risk. Sustained declines in revenue and order growth, combined with worsening gross margins, fulfillment costs, customer acquisition costs, or customer quality, signal that a company is maintaining growth at higher costs. A single metric’s slowdown merely suggests reduced tolerance for high valuations; multiple indicators weakening consecutively approach an operational-level warning.
Cash flow metrics provide subsequent confirmation. Cloud business profitability, the coverage multiple of operating cash flow over capital expenditures, and free cash flow can test whether revenue growth ultimately translates into profit and cash. These metrics may not lead stock prices, but they help investors determine whether a market correction remains confined to valuation concerns or has already spread to underlying business fundamentals.
Today’s CSPs carry an additional responsibility not faced by historical platforms: they directly decide the scale of data center construction. Capital expenditure guidance serves as a demand signal for chip, optical module, and server suppliers, but for CSP shareholders, it represents future cash outflows and depreciation pressure. This article uses six indicators: year-over-year operating cash flow; cloud revenue and orders; operating cash flow divided by capital expenditures; cloud business profit margin; free cash flow; and capital expenditure guidance. Additionally, revenue absorption rate is used to assess how much new revenue was generated from the previous round of investment.
V. Operating cash flows of the four companies have not yet slowed in sync
Operating Cash Flow (OCF) reflects the net cash outcome after customer receipts, supplier payments, taxes, and changes in working capital. Single-quarter figures can be distorted by timing of tax payments and vendor settlements; more meaningful signals come from two consecutive quarters showing consistent directional changes across multiple companies.
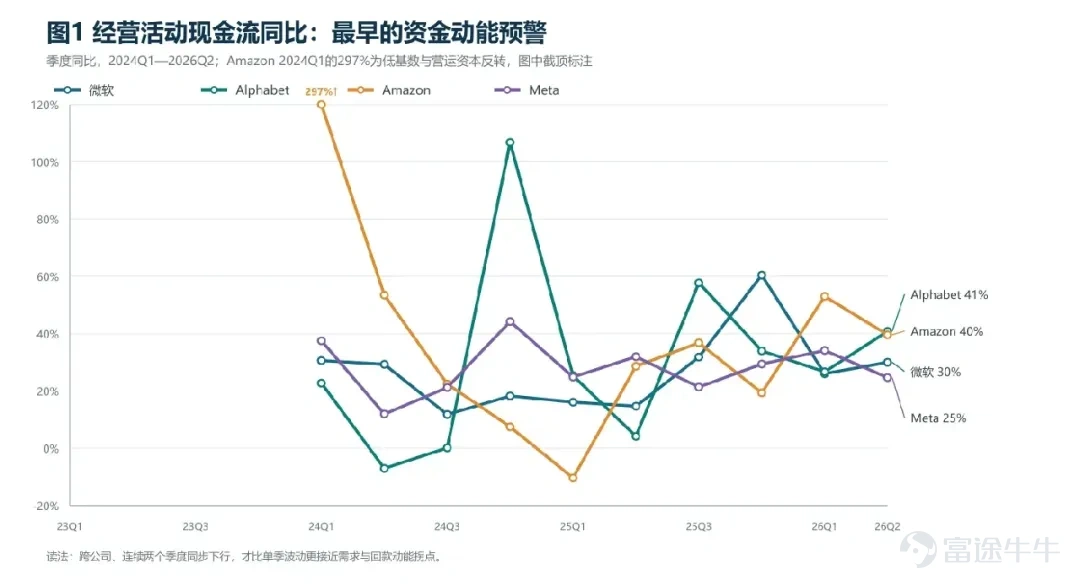
Figure 2: Year-over-year operating cash flow shows significant volatility. The more useful signal is a concurrent weakening across two consecutive quarters and multiple companies.
From Q4 2025 to Q2 2026, Microsoft’s year-over-year operating cash flow growth was 60%, 26%, and 30%; Alphabet’s was 34%, 27%, and 41%; Amazon’s was 19%, 53%, and 40%; and Meta’s was 29%, 34%, and 25%. While individual companies experienced fluctuations—some declines followed by rebounds—none of the four showed synchronized, cross-company declines for two consecutive quarters. At least through the latest financial reports, their ability to generate cash from existing businesses continues to grow.
Year-over-year OCF measures how quickly operating cash flow is growing, while OCF/Capex indicates whether a company generated enough cash in the quarter to cover its capital expenditures. The fact that the former remains strong while the latter is declining suggests that core operations are still expanding, but capital spending is growing even faster. This divergence will be explored further in the next section.
6. Cloud revenue and orders continue to expand
Remaining Performance Obligations (RPO) represent contracted revenue that has not yet been recognized. Cloud revenue reflects delivery in the current period, while RPO reflects future commitments. RPO is a leading indicator but is more sensitive to contract duration, cancellation clauses, and concentration among a few large customers. Both metrics should be analyzed together.
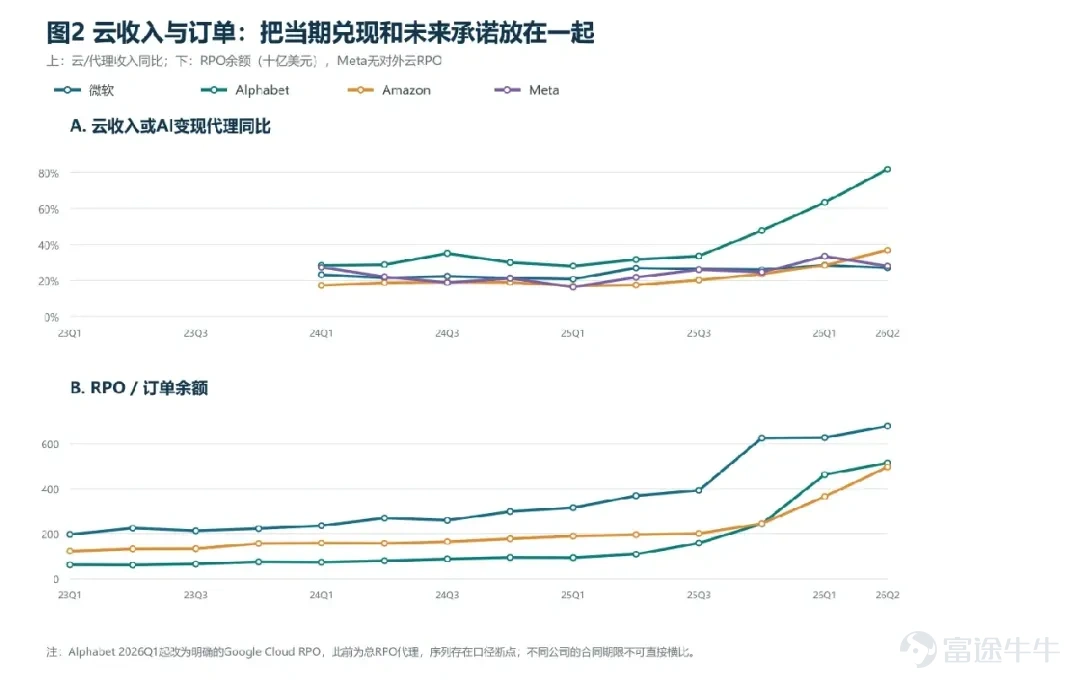
Figure 3: The upper chart tracks revenue realization; the lower chart tracks future commitments.
In the most recent three quarters, Microsoft Cloud revenue grew year-over-year by approximately 26%, 29%, and 27%; Google Cloud by 48%, 63%, and 82%; AWS by 24%, 28%, and 37%; and Meta Family of Apps by 25%, 33%, and 28%. Google Cloud and AWS show sustained acceleration, Microsoft maintains robust growth, and Meta’s ad monetization has not slowed meaningfully. On the demand side, there is no sign of the historical platform pattern where revenue growth decelerates consecutively and then spreads to profits and cash flow.
The source of orders requires independent assessment. Microsoft’s commercial RPO reached $678 billion, and even excluding OpenAI, it still grew 25% year-over-year. This quarter’s new RPO came from clients outside frontier-model companies, providing positive evidence of enterprise demand beyond closed-source large models. Alphabet disclosed Google Cloud RPO of $513.9 billion but did not break out model-company clients. Amazon’s total RPO stood at $496 billion, primarily driven by AWS. Publicly disclosed arrangements with model companies, though still small relative to total RPO, are no longer negligible; order quality must be evaluated alongside these clients’ own external revenue and fundraising capacity.
7. Marginal revenue generated by CAPEX
Strong year-over-year operating cash flow and cloud revenue do not necessarily mean every dollar of past capital expenditure has already translated into revenue. This article uses a simpler ratio:
Revenue Absorption Ratio (ROI) = Incremental cloud revenue over the trailing four quarters ÷ Total cash capital expenditures over the trailing four quarters as of six quarters prior
Using six quarters—approximately 18 months—as the construction lag, and total capital expenditures as the denominator avoids mechanically amplifying the ratio when incremental capex is small; the trade-off is that investments in office facilities, traditional cloud infrastructure, ad-recommendation systems, and logistics are mixed in.
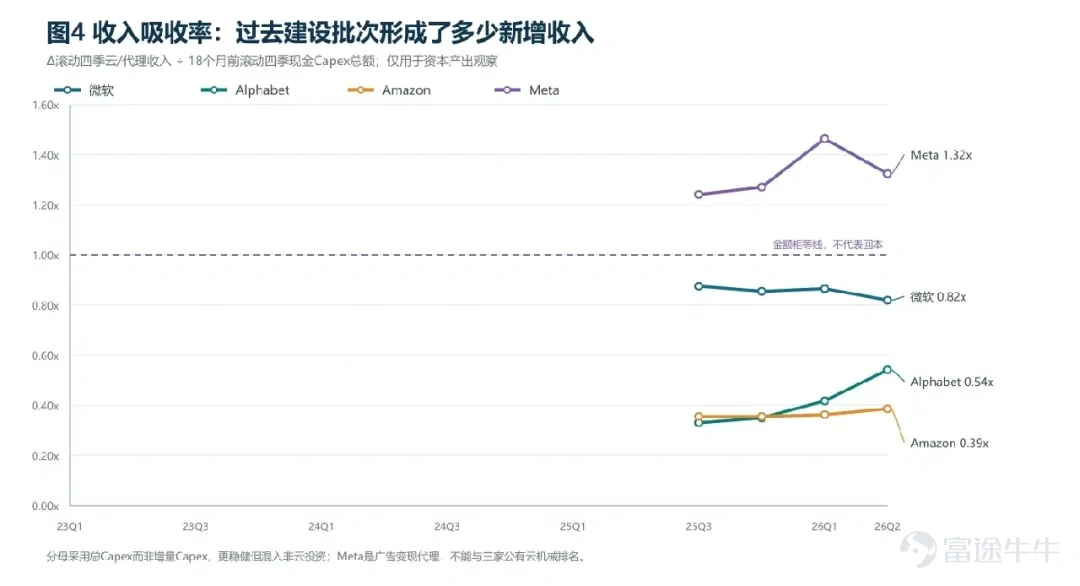
Figure 4: This metric measures the ROI of prior CAPEX investments. Meta uses ad revenue as a proxy, which should not be interpreted as the AI capital return rate.
Microsoft’s ratio declined from approximately 0.88x to 0.82x, Alphabet’s rose from 0.33x to 0.54x, and Amazon’s increased from 0.36x to 0.39x. Google Cloud and AWS are now converting infrastructure investments made a year ago into revenue at a faster pace than before. Microsoft maintains the highest ROI, but its capital expenditures ramped up more sharply two years ago, causing the latest period’s ratio to dip slightly. Meta’s ad-revenue proxy fell from 1.46x to 1.32x, still higher than the three cloud businesses; however, ad revenue is simultaneously influenced by user engagement, ad pricing, and macroeconomic cycles, so it only indicates relatively strong platform monetization capability.
Conclusion from the previous section: Financial reports have not yet confirmed that the sector has peaked; ROI has become the market’s focal point.
The latest earnings reports from the four platforms did not show simultaneous weakening in cloud revenue, orders, and operating cash flow. Google Cloud and AWS are accelerating, Microsoft provided evidence that orders grew even after excluding OpenAI-related contributions, and Meta’s ad monetization remains robust. Drawing from historical dot-com bubble precedents, it is still premature to confirm a fundamental peak in the industry—only the market’s valuation focus has shifted. Continued revenue growth merely validates past infrastructure investments met demand; whether valuations can be sustained depends on margins, free cash flow, and the next round of capital expenditures. Interest rates, positioning, and the timing of return realization will affect valuations first.
The dot-com bubble case also serves as a reminder to investors that stock prices can adjust even while financial results remain strong. The most valuable use of earnings reports is to assess whether there has been a consecutive deterioration in revenue, unit economics, and cash generation following such adjustments. The next part will address three questions: Why can’t Alphabet’s and Amazon’s operating cash flows already cover their current-quarter capital expenditures? What portion of large RPOs comes from clients capable of independently generating cash? And as capital expenditures continue to rise, which of the four companies has the greatest buffer to wait out the cycle?
Risk Disclaimer: The above content only represents the author's view. It does not represent any position or investment advice of Futu. Futu makes no representation or warranty.Read more

Comments
to post a comment
1
1