
US Equity Indices Edition | Dow Rebounds to Highs, Nasdaq Weakens: Even When Tracking the Same Index, Product Terms Differ Significantly
The three major US equity indices have recently started showing clear divergence.
The Dow closed at 52,747 points, moving back toward the previous high range of 52,900–53,300 points; the S&P 500 closed at 7,428 points, still trading sideways near its highs; meanwhile, the Nasdaq-100 dropped to 27,763 points, having continuously retreated from around 30,700 points and already broken below the lower Bollinger Band in the short term.
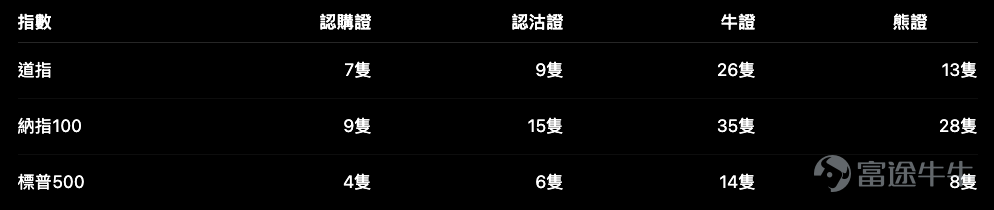
Given their diverging directions, product selection strategies naturally cannot be identical. Among the four product tables featured this time, there are the following offerings across the three major indices:

The Nasdaq-linked products are the most numerous, but 'more choices' doesn't mean easier selection. Especially for bull certificates, call-back distances range from extremely tight to over 20 percentage points, resulting in vastly different actual risk levels.
Dow Jones Industrial Average $Dow Jones Industrial Average (.DJI.US)$ : Testing resistance again at high levels; bullish positioning shouldn't focus solely on the highest leverage.
The Dow Jones Industrial Average (DJIA) daily chart still maintains an uptrend structure, with the Bollinger Bands middle band around 52,412 points, and the upper band around 53,108 points. The index has now returned to the upper half of the channel. In the near term, watch whether it can break above the 52,900–53,300 point range; support levels to monitor below are around 52,400 and 51,700 points.
There are currently 26 Dow Jones bull certificates, with call-back prices ranging from 40,100 to 50,000 points, representing a call-back distance of approximately 4.71% to 23.58% away from current price, leverage of about 4.0x to 16.9x。
For investors bullish on the Dow Jones Index testing new highs in the near term, bull certificates with call prices closer to the current level—around 50,000 points—are worth considering. These are less than 5% away from the current index level and offer leverage approaching 17x. This group reacts most sensitively to upward moves; however, if the Dow merely pulls back to around 52,000 points, the certificate prices will already face noticeable downward pressure. Any further decline would rapidly increase the risk of early call.
If your investment horizon extends beyond intraday trading, you may instead consider products with call prices near 49,000 points and a distance-to-call of roughly 6% to 7%. Leverage would drop to around 12x, but the terms are better able to withstand normal index volatility.
There are only seven Dow Jones Index call warrants available, with strike prices ranging from 55,000 to 60,000 points—all out-of-the-money—with effective gearing of approximately 16.7x to 32.5x. While the gearing appears attractive, their delta is only about 16% to 25%, meaning that even if the index rises, the price performance of some warrants may not directly reflect the apparent leverage.
Moreover, the call warrants carry premiums of approximately 6.25% to 15.84%, daily time value decay is approximately 0.98% to 3.96%. If one only expects the Dow Jones to rise by a few hundred points, bull certificates are usually more straightforward; call warrants are better suited for investors anticipating a larger breakout in the Dow and wishing to avoid the knock-in mechanism of bull certificates.
On the bearish side, there are 13 Dow Jones bear certificates, with knock-in levels concentrated between 54,000 and 57,000 points, approximately 2.91% to 8.63% away from current price, leverage of about 14.6x to 35x。
Although the at-the-money bear certificate offers leverage of around 35x, the Dow remains in a strong uptrend. Should it break above 53,300 points, the buffer to the 54,000-point knock-in level would be quite narrow. For those betting on a pullback from elevated levels, a more balanced approach is to select bear certificates with knock-in levels at 55,000 points or higher, avoiding turning directional views into a high-risk, narrow-margin bet.
Nasdaq-100 $NASDAQ 100 Index (.NDX.US)$ : Shows the clearest downtrend, but bull certificates are most prone to the 'at-the-money trap'
The Nasdaq-100 closed at 27,763, already below the lower Bollinger Band at approximately 28,506. From its recent high of 30,762, the index has retraced nearly 10%. Near-term support is initially seen at 27,400–27,500; if breached, the next key level to watch is around 27,000. Upside resistance lies near 28,500 and 29,000.
There are a total of 35 Nasdaq bull certificates, the highest among the three major indices, but with the widest knock-out price range, from 0.5% to 24.3%, with leverage ranging from 3.8x to 50.3x.
Among them, the closest-to-the-money series has a knock-out level around 27,600 points, only about 0.5% away from the current index level. These products are low-priced and offer leverage exceeding 50x, but even a normal intraday fluctuation in the Nasdaq could trigger a knock-out. As the index remains in a downtrend, such terms are unsuitable for simply betting on a rebound based solely on an RSI pullback.
For those bullish on a technical rebound, consider widening the selection range slightly—for example, knock-out levels near 26,000 to 26,500 points. Although leverage will noticeably decrease, this provides the index with roughly 5% to 7% of buffer against volatility, better aligning with the Nasdaq’s current actual trading range.
There are nine Nasdaq call warrants available, with strike prices ranging from 28,800 to 35,800 points and effective gearing of approximately 10.7x to 16.3x. Products with strike prices near 28,800 to 30,000 points have deltas of around 40% or higher, making them more responsive to rebounds. In contrast, products with strike prices above 33,000 points, while cheaper, have deltas as low as approximately 7% and premiums as high as 28%, implying they are not just betting on a rebound but rather on a sharp, short-term V-shaped recovery.
On the bearish side for the Nasdaq, the market offers 28 bear warrants, with call prices ranging from 30,000 to 34,000 points, approximately 8.15% to 22.57% away from the current price, offering leverage of roughly 6.2x to 15.7x. Compared to bull certificates, bear certificates generally have a wider knock-out buffer, making their terms less aggressive than one might expect.
If one expects the Nasdaq to break below 27,400 points and continue its downtrend, bear certificates with knock-out levels near 30,000 points still offer about an 8% buffer, along with leverage of up to approximately 15x, making them among the more reasonable directional products currently available across the three major indices. However, given that the Nasdaq has already declined significantly, short-term oversold bounce risks are rising, so it’s unwise to select the closest-to-the-money product solely based on weak price action.
There are 15 put warrants available, with strike prices ranging from 21,492 to 29,000 points and effective gearing of approximately 5.7x to 13.6x, with implied volatility as high as 30.43% to 46.46%. Current bearish sentiment is already reflected in elevated volatility; buying put warrants not only requires directional judgment but also entails paying relatively high volatility premiums. If the Nasdaq declines only gradually, returns from these products may fall short of expectations.
S&P 500 $S&P 500 Index (.SPX.US)$ : The index is the most stable, yet its products aren’t necessarily the cheapest
The S&P 500 closed at 7,428 points, with the Bollinger Bands middle band around 7,492 points and the lower band around 7,391 points. The index is currently fluctuating near the lower band, with short-term support seen at 7,380–7,390 points and initial resistance at 7,490 points, followed by 7,590–7,620 points.
There are 14 S&P bull certificates in the market, with knock-out levels ranging from 5,800 to 7,200 points, representing a knock-out distance of approximately 2.73% to 21.64%, with leverage ranging from approximately 4.2x to 21.4x.
If bullish on the index holding support at 7,390 and rebounding, bull certificates with a call price of 7,200 are less than 3% away, offering leverage exceeding 20x, though their terms are relatively aggressive. For a more conservative approach, consider tranches with a call price near 7,000, which provides the index with about 6% buffer to avoid nearing the call price after a single breach of the lower support level.
There are only four S&P call warrants available, with extremely divergent terms: strike prices range from 7,200 to 9,000 points, and delta values vary from below 5% to 68%. Selection should not be based solely on the label 'S&P call warrant'—the 7,200-point strike is in-the-money and thus tracks the underlying index more closely, whereas the 9,000-point strike is deeply out-of-the-money and functions more like a high-leverage, low-probability short-term trading instrument.
On the bearish side, there are eight bear certificates with call prices between 7,700 and 8,400 points, representing distances of approximately 4.03% to 13.48%, with leverage ranging from approximately 10.3x to 26.4x. If the index breaks below 7,390, bear certificates would be more direct than put warrants; however, the tranche with a call price of 7,700 is only about 4% away, meaning a rebound in the S&P toward its prior highs could quickly push the product close to being called.
How should index-linked products be allocated?
Based on current terms:
– Dow Jones Industrial AverageThe market remains relatively strong; those with a bullish outlook should prioritize comparing mid-distance bull certificates over deeply out-of-the-money call warrants.
– NasdaqThe trend is weakest; bearish products have relatively comprehensive terms, but beware of a rebound following consecutive declines.
– S&P 500Near support levels, before the direction is confirmed, both overly close-to-the-money bull and bear warrants are easily knocked out by volatility.
Among the three major indices, what matters most isn't which has the highest leverage, but rather which product’s knock-out level, delta, and time decay truly align with your intended holding period. Even if you correctly predict the index direction, the outcome can still be entirely different if the product’s knock-out level is too close or its delta is too low.
Risk Disclaimer: The above content only represents the author's view. It does not represent any position or investment advice of Futu. Futu makes no representation or warranty.Read more

Comments
to post a comment
1