
Robots are being widely deployed—have automakers unlocked a second growth curve?

HK Derivatives Focus | Xiaomi surges sharply, Meituan approaches upper Bollinger Band—can Tencent’s rebound go further?
Market sentiment in Hong Kong improved on Monday, but individual stocks did not move in unison.
Some stocks are in a breakout phase, such as Xiaomi; others have already risen close to near-term resistance, like Meituan; while some are still recovering from low levels, such as Tencent. Meanwhile, HSBC and CCB continued hitting all-time highs since listing, while PetroChina saw a noticeable pullback after a recent rally.
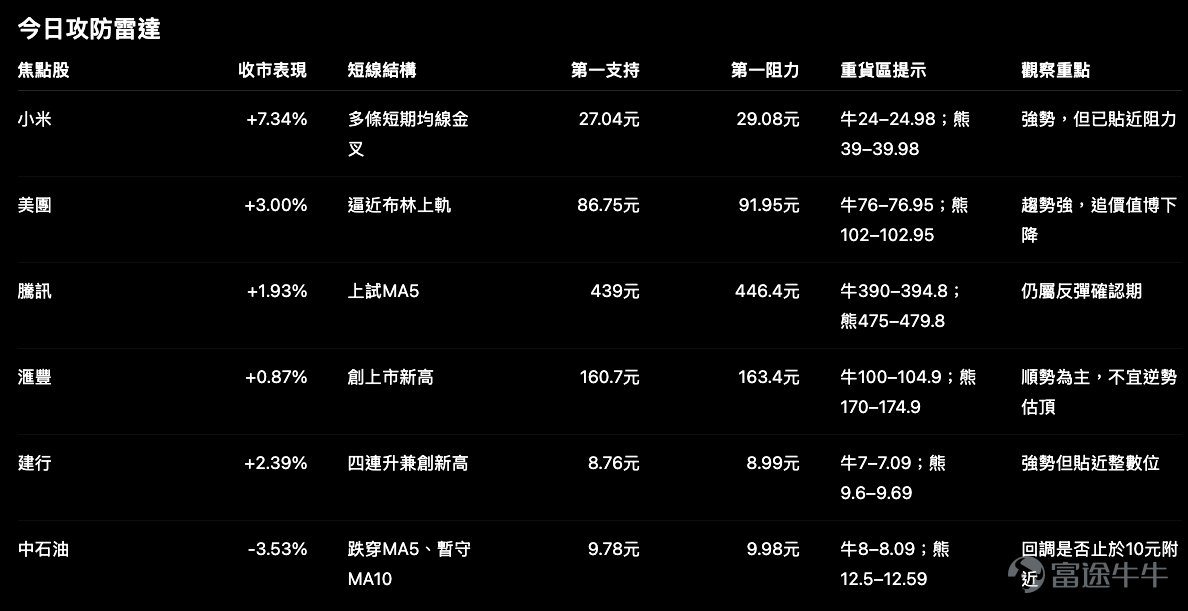
This time, we’ve selected from individual stock data over the past nine trading days, market observations as of July 27, and key warrant concentration zones six stocks worthy of closer attention。
We must clarify first: changes in street inventory should only be viewed asa lagging footprint of positions. It can help us understand how capital was positioned previously, but it shouldn’t be used alone as a signal for the next directional move.

1 | Xiaomi $XIAOMI-W (01810.HK)$ : showing the strongest upward momentum—but now is not the time to focus solely on 'how fast it’s rising'
Xiaomi closed at HK$28.68, up 7.34% for the day, with a trading volume of approximately HK$7.825 billion and net inflows from major funds of about HK$878 million. It has gained 10.99% over the past 10 days and surged 33.89% over 20 days.
Market observations show that Xiaomi’s 5-day moving average (MA5) has crossed above both its 10-day (MA10) and 20-day moving averages (MA20), and MA10 has also crossed above MA20. The short-term moving averages have fully formed golden crosses and are diverging upward, with the share price trading above multiple moving averages. Among this batch of highlighted stocks, it exhibits the clearest technical structure.
However, the current price of HK$28.68 is very close to the resistance level at HK$29.08. The next move isn’t simply about rising another one or two percent—it’s about whether the stock can firmly hold above HK$29.
Key Support and Resistance Levels
– First support: HK$27.04
– Second support: HK$26.84
– First resistance: HK$29.08
If it breaks above HK$29.08, the uptrend could continue; if it rallies but then falls back toward HK$27, it would indicate weakening short-term buying momentum.
Warrants Strategy
Market observations show that open interest in Xiaomi call and put warrants decreased by 1.47% and 2.50%, respectively, while bull warrant open interest declined by 8.01%, and bear warrants saw a slight increase of 0.29%. These figures suggest partial profit-taking by bullish positions following a sharp rally, rather than coordinated capital inflows.
The main concentration zone for bull warrants is between HK$24 and HK$24.98, significantly below the support level near HK$27. The bear warrant concentration zone lies between HK$39 and HK$39.98, far from the underlying share price.
For those bullish on the stock, when selecting bull warrants, priority should be given to those with a call price below HK$26.84, rather than simply choosing the closest-to-the-money terms due to the recent sharp price rise. If using call warrants, it's advisable to avoid excessively out-of-the-money or short-dated products—otherwise, if the underlying stock consolidates around HK$29, both time decay and declining implied volatility could negatively impact product performance.
On the bearish side, buying puts or bear warrants purely because 'the price has risen too much' constitutes a counter-trend position. A more reasonable signal would be clear resistance near HK$29.08 followed by a decisive break below HK$27.04.
2|Meituan $MEITUAN-W (03690.HK)$ : Trend remains strong, but risk-reward dynamics are starting to shift
Meituan closed at HK$89.3, up 3%, with turnover of approximately HK$5.893 billion. It has gained 14.56% over the past 10 days and an even stronger 38.99% over the past 20 days.
Market observations note that Meituan is approaching the upper Bollinger Band. While this is not an immediate bearish signal, it indicates the stock has moved beyond the initial rebound phase from its lows and entered a zone where profit-taking needs to be absorbed.
Key Support and Resistance Levels
– First support: HK$86.75
– Second support: HK$84.90
– First resistance: HK$91.95
Meituan’s current price is less than 3% away from the HK$91.95 resistance level. If it breaks through and stabilizes above this level, the uptrend could continue; however, if it weakens near this resistance, a pullback to test HK$86.75 would also be normal.
Warrants Strategy
Market observations show that Meituan call warrants’ open interest rose by 1.59%, while put warrants’ open interest declined by 5.25%. Bull and bear warrant open interest decreased by 1.59% and 4.74%, respectively. Overall, neither bullish nor bearish positions show signs of extreme new positioning.
In terms of concentration zones, bull warrants are clustered between HK$76.00 and HK$76.95, while bear warrants are concentrated between HK$102.00 and HK$102.95. Both are relatively distant from the underlying stock price.
For those already bullish on Meituan, this provides a clearer strategic perspective: bull warrants with a recall price around HK$76 offer ample downside buffer, though their leverage is typically not very high. Opting for call warrants can enhance directional sensitivity, but note that Meituan has already accumulated significant gains, so warrants that are too far out-of-the-money should be avoided.
For bearish positions, it’s not advisable to act solely because the price is nearing the upper Bollinger Band. Only if the price fails at HK$91.95 and breaks below HK$86.75 would puts have a clearer short-term rationale.
3|Tencent $TENCENT (00700.HK)$ : The rebound has improved, but it hasn’t yet truly broken out of the resistance zone.
Tencent closed at HK$443, up 1.93%, with a trading volume of approximately HK$6.387 billion. Main force funds recorded a net inflow of about HK$103 million, though the stock is still down 7.28% over the past five days.
Therefore, Tencent currently appears to be stabilizing after a sharp decline, rather than having completed a trend reversal.
Market observations show that Tencent is testing its 5-day moving average (MA5) from below. Open interest in call warrants increased by 1.82%, while put warrant open interest decreased by 15.90%. Open interest in both bull and bear certificates declined simultaneously.
This can be interpreted as diminishing bearish positioning in the market, yet bullish positions have not yet seen consistent aggressive buying.
Key Support and Resistance Levels
– First support: HK$439
– Second support: HK$435.4
– First resistance: HK$446.4
– Second resistance: HK$450.8
For Tencent to confirm continuation of the rebound, it must first break above HK$446.4, followed by a move toward HK$450.8. If the price continues to oscillate between HK$443 and HK$446, call warrants should not be selected too aggressively.
Warrants Strategy
The key concentration zone for bull warrants is between HK$390 and HK$394.8, while that for bear warrants lies between HK$475 and HK$479.8. Both zones are at a noticeable distance from the current price.
For investors bullish in the short term who wish to capture a breakout above HK$446.4, they may consider call warrants closer to the underlying stock with a maturity date not too near-term. If concerned about volatility during the rebound, the bull warrant’s call price should be set below the support level of HK$435.4, rather than solely chasing the highest leverage.
On the bearish side, if Tencent rises above HK$450.8, bear warrants around HK$475 would not be immediately triggered yet, but the underlying stock’s trend would have further improved, increasing the pressure of holding a contrarian short position. A more reasonable signal for establishing a short position would be the stock price falling back below HK$435.4.
4|HSBC $HSBC HOLDINGS (00005.HK)$ : Amid its upward trend to new highs, what traders must guard against most is trying to call the top against the trend.
HSBC closed at HK$162.8, up 0.87%, hitting an intraday high of HK$163.4 and setting another all-time high since listing. Net institutional inflows amounted to approximately HK$577 million, with a 10.22% gain over the past 20 trading days.
Market observations show that open interest in calls rose by 1.58%, while put open interest declined for two consecutive days; bull warrant open interest increased for two straight days, whereas bear warrant open interest dropped by 18.80%.
However, these figures only reflect past position changes and should not be used to directly infer that the upward momentum will necessarily continue.
Key Support and Resistance Levels
– First support: HK$160.7
– Second support: HK$160.2
– Short-term resistance: HK$163.4
The stock price has reached a new high, and traditional resistance levels offer limited reference; therefore, greater attention should be paid to the previous day's low and round-number support levels.
Warrants Strategy
HSBC bull certificates have a heavy concentration zone between HK$100 and HK$104.9, which is far from the underlying stock price; bear certificates are concentrated between HK$170 and HK$174.9, closer to the current price on the upside.
For those bullish on the trend, the bull certificate heavy zone may not accurately reflect short-term actual risk due to its significant distance from the current price. When selecting products, compare those with call prices closer to the current level yet still below the HK$160 support.
Regarding call warrants, as the underlying stock has hit a new high, investors should focus on delta and moneyness rather than choosing deeply out-of-the-money terms solely because of their low price.
For bearish positions, wait for a clear break below the HK$160.2–HK$160.7 range. Buying bear certificates merely because the stock hit a new high can easily expose you to unnecessary knockout risk if the uptrend continues.
5|CCB $CCB (00939.HK)$ : Reaching a new high is not a signal to chase the stock; the HK$9 level is the key support/resistance point.
CCB closed at HK$8.99, up 2.39%, marking its fourth consecutive gain and a record high since listing. Trading volume was approximately HK$3.518 billion, with net institutional inflows of about HK$450 million.
Market observations show that outstanding call and put warrants increased by 2.37% and 3.45%, respectively; bull warrant holdings declined slightly by 1.39%, while bear warrant holdings fell by 5.34%.
Outstanding bullish and bearish warrants both rose, reflecting continued market divergence over higher levels, though this does not signal an immediate reversal.
Key Support and Resistance Levels
– First support: HK$8.76
– Second support: HK$8.70
– Short-term resistance range: HK$8.99 to HK$9.00
HK$9.00 is both a psychological round-number level and today’s intraday high. If the price decisively breaks above it, the uptrend could continue; however, if repeated attempts fail to break through, watch for a potential pullback toward HK$8.76.
Warrants Strategy
Major concentrations of CCB bull warrants are between HK$7.00 and HK$7.09, while those for bear warrants lie between HK$9.60 and HK$9.69.
The bear warrant concentration zone is approximately 7% above the current price—not particularly close—but given CCB’s typically lower volatility compared to tech stocks, the actual sensitivity of these products may not be as high as their nominal leverage suggests.
Bullish traders may watch for a continuation after a breakout above HK$9, but should avoid chasing with deeply out-of-the-money call warrants; bearish traders should ideally wait for a break below HK$8.76, as otherwise it would just be betting against the trend by trying to pick a top.
6|PetroChina $PETROCHINA (00857.HK)$ : A 3.53% drop in one day—is this normal profit-taking or a sign of short-term weakness?
PetroChina closed at HK$9.85, down 3.53%, with trading volume of approximately HK$1.035 billion. It is still up 6.49% over the past 10 days and 12.19% over 20 days, so this decline can still be interpreted as a pullback within an ongoing uptrend.
Market observations show that PetroChina has broken below its 5-day moving average (MA5) but is holding above its 10-day moving average (MA10). Street inventory of call warrants has declined for three consecutive days, while put warrant street inventory has increased for three straight days. Bearish warrant street inventory surged in a single day, but given the potentially low base, the percentage change should not be directly interpreted as a consensus bearish view among large amounts of capital.
Key Support and Resistance Levels
– First support: HK$9.78
– Second support: HK$9.67
– First resistance: HK$9.98
– Second resistance: HK$9.99
PetroChina is currently testing the HK$9.78 support level, while facing resistance near HK$10 overhead. This is a typical short-term inflection point.
Warrants Strategy
The heavy concentration zone for bull warrants is between HK$8.00 and HK$8.09, while that for bear warrants is between HK$12.50 and HK$12.59—both are relatively far from the current price.
If the price holds above HK$9.78 and reclaims HK$10, call warrants or bull warrants with distant knock-out levels may be reconsidered; if it breaks below HK$9.67, the put direction will become clearer.
However, PetroChina’s underlying share price is relatively low, so each tick movement in its warrant products may represent a higher percentage of their price, and the bid-ask spread deserves special attention. Even with a correct directional view, actual warrant performance may still lag behind the underlying stock if liquidity is thin or spreads are too wide.
Derivatives Trading Reminder
Among the six stocks in focus this time, they can broadly be grouped into three categories:
Strong Breakout Group: Xiaomi, HSBC, CCB
For this group, avoid simply turning bearish just because they have risen significantly. When bullish, focus on avoiding deeply out-of-the-money call warrants and bull warrants priced too close to the underlying; when bearish, wait for support levels to break first.
Approaching Resistance Group: Meituan, Tencent
Both have rebounded but are now approaching short-term resistance levels. Warrant selection should depend on whether a breakout is confirmed; otherwise, call warrants will suffer from both time decay and declining implied volatility.
Pullback Observation Group: PetroChina
Most importantly, watch whether the levels of HK$9.78 and HK$9.67 hold. Until the direction is confirmed, neither bulls nor bears should prematurely increase leverage.
One final reminder:Street inventory reflects lagging position footprints, not leading signals. Before actually entering a trade, you must first confirm whether the underlying stock breaks above or below key levels, then compare strike prices, delta, expiry dates, implied volatility, bid-ask spreads, and the knock-out distances of bull/bear warrants. Getting the underlying stock’s direction right is only the first step; choosing the wrong warrant terms can still prevent you from achieving your expected outcome.
Risk Disclaimer: The above content only represents the author's view. It does not represent any position or investment advice of Futu. Futu makes no representation or warranty.Read more
Comments
to post a comment
1