
RootData: Have We Reached the Bottom of the Bear Market? Six Charts to Understand the Crypto Industry Cycle
Author: Gu Yu, RootData
Recently, with projects such as BitMEX and Bitmart successively announcing shutdowns, failed projects have once again become a focal point of market discussion. To date, RootData’s '2026 Cryptocurrency Project Graveyard' has already cataloged over 100 projects.
The mass elimination of low-quality projects and extreme market pessimism are often seen as signs that a bear market has bottomed out. Where exactly does the current moment fall within the historical cycle of the cryptocurrency industry? What do indicators such as the number of new projects, new tokens, and fundraising data actually show?
To address these questions, RootData has compiled multidimensional proprietary data from its platform and created five charts to better help readers understand the current state of the cryptocurrency industry and its position within the broader historical cycle.

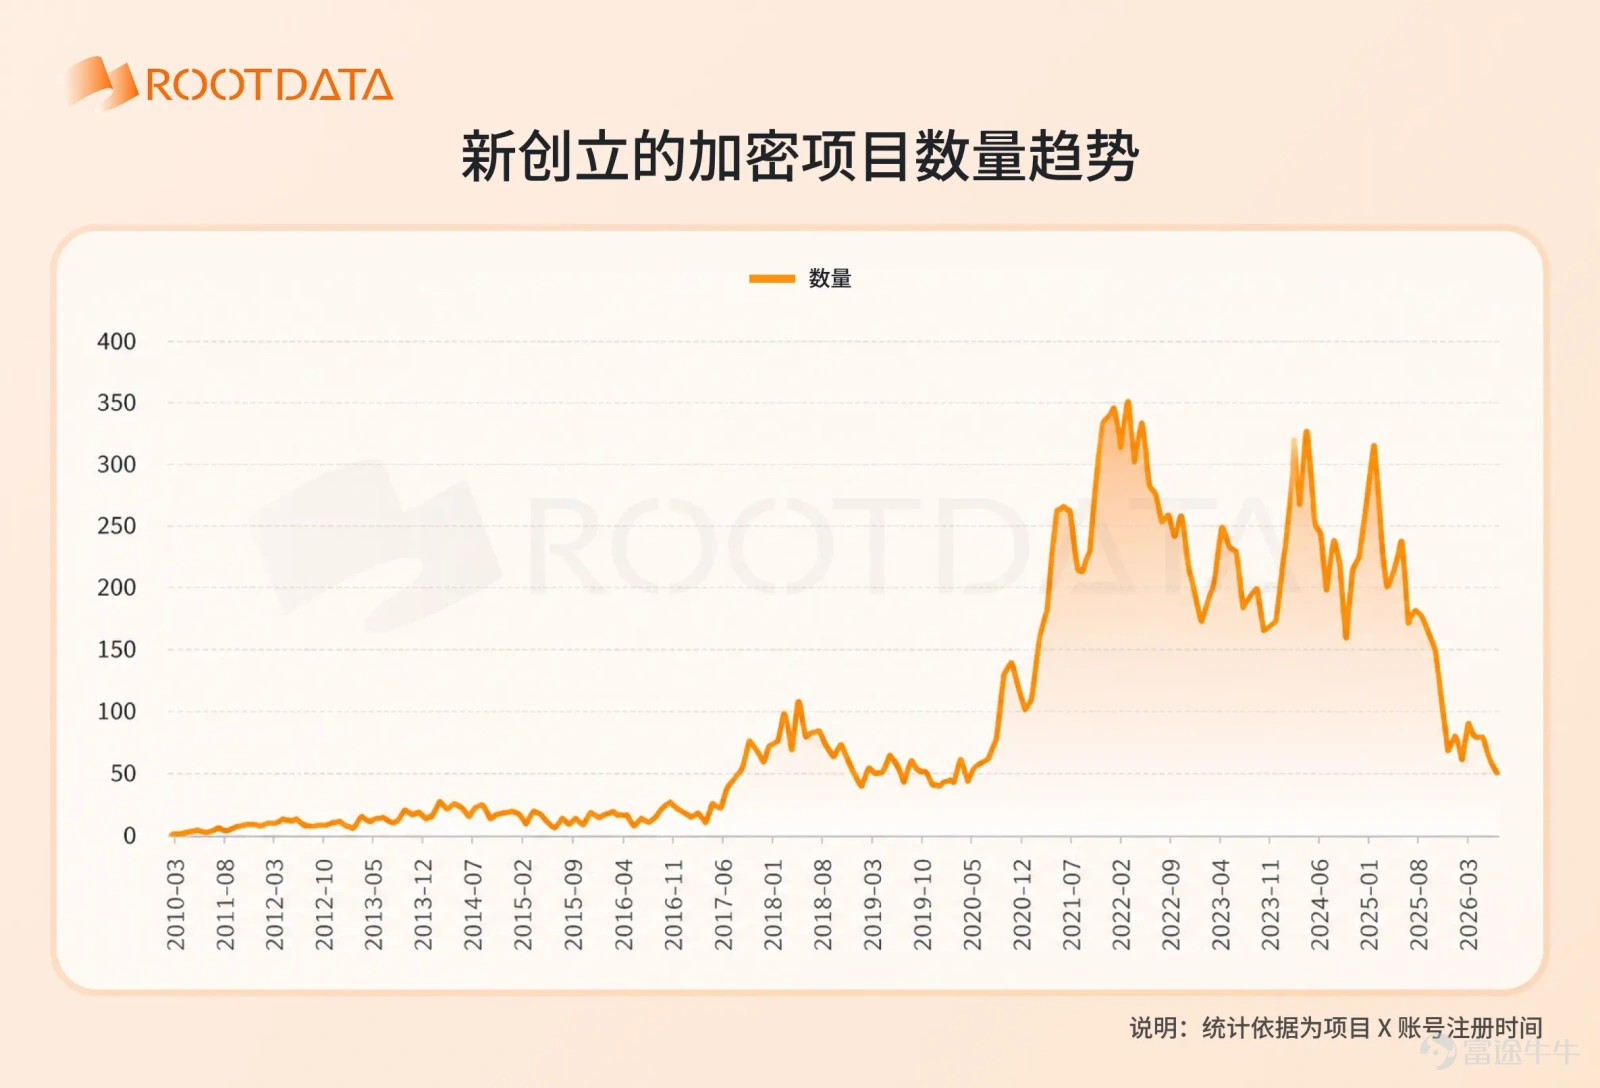
The number of new projects is one of the most important indicators for gauging market activity in crypto, reflecting entrepreneurs’ confidence in the sector’s future prospects and opportunities.
This chart is primarily based on the X (formerly Twitter) account registration dates of over 20,000 projects tracked by RootData, offering a reasonably accurate representation of when new projects were founded and entered the market—down to the specific month.
According to this chart, the peak period for newly launched crypto projects occurred between September 2021 and January 2022, during which more than 300 new projects emerged each month. Bitcoin reached its all-time high of $69,000 during this window. Since then, the number of new projects has generally trended downward, with minor rebounds observed in March 2023, March 2024, and January 2025.
Following those rebounds, the number of new projects has plummeted dramatically. So far this year, fewer than 80 new projects have launched each month—levels comparable to those seen before August 2020. Interestingly, Bitcoin’s current price is roughly on par with its level at the end of 2021, when the number of new projects peaked.

In recent years, fundraising in the crypto primary market has exhibited clear characteristics of peak retracement and structural adjustment.
From 2021 to early 2022, the market was extremely active, with quarterly fundraising repeatedly exceeding $10 billion and peaking at nearly $13 billion. The number of fundraising events also climbed to a record high of 592, marking both the scale and frequency of capital inflows as阶段性 highs.
As prices of major cryptocurrencies declined and the market shifted into a bear phase, investment and fundraising amounts dropped to their lowest level in nearly five years in 2023 and remained subdued. However, the number of fundraising deals rebounded sharply in March 2024, reflecting an attempt to capture potential opportunities through a 'spray-and-pray' diversification strategy amid limited capital. Yet, this approach ultimately failed to avoid disappointing investment returns.
Over the past year, the trends in deal count and fundraising amount have diverged. Although the number of fundraising deals has continued to decline in recent years, the total amount raised has risen significantly since late 2024, primarily driven by massive funding rounds from leading projects such as Binance, Polymarket, and Dunamu.
Currently, the number of crypto fundraising deals has declined for three consecutive years—the longest downturn in the industry’s history. Even the new all-time high in Bitcoin prices in 2025 has failed to reverse this trend, indicating that capital allocation has become highly cautious, accelerating its concentration toward top-tier sectors and projects with strong certainty and high barriers to entry, rather than broadly betting on emerging ventures. The Matthew effect in the market is intensifying.

Unlike the sharp contraction in crypto fundraising and investment activity, the number of mergers and acquisitions (M&A) in the crypto sector remains near historic highs, undergoing a structural shift from sporadic experimentation to full-scale acceleration.
Between 2013 and 2020, the number of M&A transactions in the crypto industry remained in the single digits. It surpassed 10 deals for the first time in 2021 and reached 11 in 2022, after which it accelerated rapidly. The year 2025 marked a turning point: a total of 267 M&A deals were completed, representing year-over-year growth of over 50%.
In 2026, despite declining spot prices in the crypto market, M&A activity has heated up against the broader trend. In the first half of the year alone, 75 deals were announced, totaling over $9 billion—marking a 26-fold surge compared to the same period last year.
Notable examples include MasterCard’s $1.8 billion acquisition of payment infrastructure firm BVNK and Blockworks’ acquisition of data platform Messari at a price far below its prior valuation (a discount of over 90%), clearly signaling that bargain hunting and strategic positioning in core infrastructure have become dominant strategies.
Meanwhile, crypto giants such as Coinbase, Kraken, and MoonPay aim to enhance their control over upstream and downstream segments of the industry through mergers and acquisitions, filling critical gaps in core capabilities.Traditional internet and financial firms are accelerating their entry into the space, acquiring core competencies via M&A to secure a dominant position in the rapidly expanding crypto market.
Overall, crypto M&A is evolving from a cyclical activity into an institutionalized wave of consolidation. As global regulatory frameworks gradually become clearer, the crypto industry may soon be dominated by a handful of giants that hold key licenses and control critical infrastructure, with integration continuing to deepen.

The number of new tokens is one of the most important indicators of activity in the crypto secondary market. Most projects prefer to launch tokens during periods of market recovery and positive sentiment, closely tied to the popularity of emerging narratives.
Across the entire historical cycle, the number of new tokens saw two minor peaks in 2018 and 2021. However, the true historic high began in March 2024 and culminated in January 2025, setting a record of 145 new tokens—far surpassing the peaks shown in other charts.
This surge is primarily linked to the meme frenzy and AI agent narrative that emerged since 2024. In January 2024, pump.fun launched on the Solana mainnet, significantly lowering the technical barrier for ordinary users to issue tokens. Around March 2024, the meme boom officially erupted, with tokens like BONK, WIF, and BOME routinely delivering 100x returns. The market embraced a 'attention equals value' narrative: anything capable of capturing attention could be tokenized.
By late 2024, projects such as Truth Terminal and ai16z propelled the AI agent narrative into the spotlight. Virtuals Protocol enabled users to quickly create, tokenize, and trade AI agents, resulting in over 10,000 AI agent projects being launched in recent years.
The foundation was the democratization of token-launch platforms, the fuel was meme culture, and the AI agent boom served as a powerful late-stage catalyst. Together, these factors drove the number of new tokens in the crypto market to a new all-time high in January 2025.
However, in this cycle, a large volume of tokens had extremely short lifespans, with most crashing to zero in a short period. This severely diluted market liquidity and caused the traditional 'altseason' to be either delayed or fragmented.

According to RootData, nearly 7,000 projects, venture capital firms (VCs), or individuals have participated in primary market funding rounds to date, including 2,617 VCs and nearly 3,000 individuals.
Although closely tied to the overall state of the crypto primary market, unlike trends in fundraising amounts and deal counts, this metric did not experience a sharp decline starting in 2021. Instead, it peaked in April 2024, with over 900 unique investors participating cumulatively in that month—a record high.
This is primarily due to shifts in investor composition. Between 2021 and 2022, VCs dominated the crypto fundraising landscape, with numerous second- and third-tier VCs aggressively investing in altcoin projects—averaging more than 20 investments per month at one point. Similarly, it was common for a single project’s funding round to list 20–40 VC names to signal strong demand.
However, during the 2022–2023 bear market, many VCs were eliminated from the market, and angel investors—primarily entrepreneurs and key opinion leaders (KOLs)—emerged as one of the most active participant groups in the primary market. Project press releases began routinely listing dozens of angel investors, with a peak exceeding 100 names in a single round.
Yet, as fundraising activity continues to decline and investor returns remain deeply disappointing, angel investors are now also fading from most project cap tables. This month, only around 100 investors with recorded investments were listed—the lowest figure since July 2020.

New ecosystem projects from various Layer 1 and Layer 2 blockchains have long been the primary source of new ventures in the crypto industry. Many Layer 1/2 networks host hackathons, incubation programs, and other initiatives to boost ecosystem engagement.
Historically, Ethereum and its Layer 2 solutions held a dominant position in new project launches, capturing the top four spots in 2022. However, starting in 2024, Solana has emerged as the leading destination for new projects amid its DeFi and meme token boom. Meanwhile, Hyperliquid, Arc, and Robinhood Chain have become among the few new Layer 1/2 entrants to appear on the rankings in the past two years, further eroding Ethereum’s market share.
In the first seven months of this year, the number of newly tracked ecosystem projects across all Layer 1/2 chains has declined sharply. The current top eight Layer 1/2 networks by new project count are Solana (59), Robinhood Chain (42), Ethereum (36), Base (30), Hyperliquid (19), BNB Chain, Arbitrum, Polygon, Arc, and Sui.
Risk Disclaimer: The above content only represents the author's view. It does not represent any position or investment advice of Futu. Futu makes no representation or warranty.Read more
Comments
to post a comment
1