
Options Hub: SpaceX's second wave of lock-up expiration takes effect today! How should options strat

Earnings Options Playbook | Live Coverage of Amazon's Q2 Results: The Ultimate Battle Between AWS Growth and Capital Expenditure
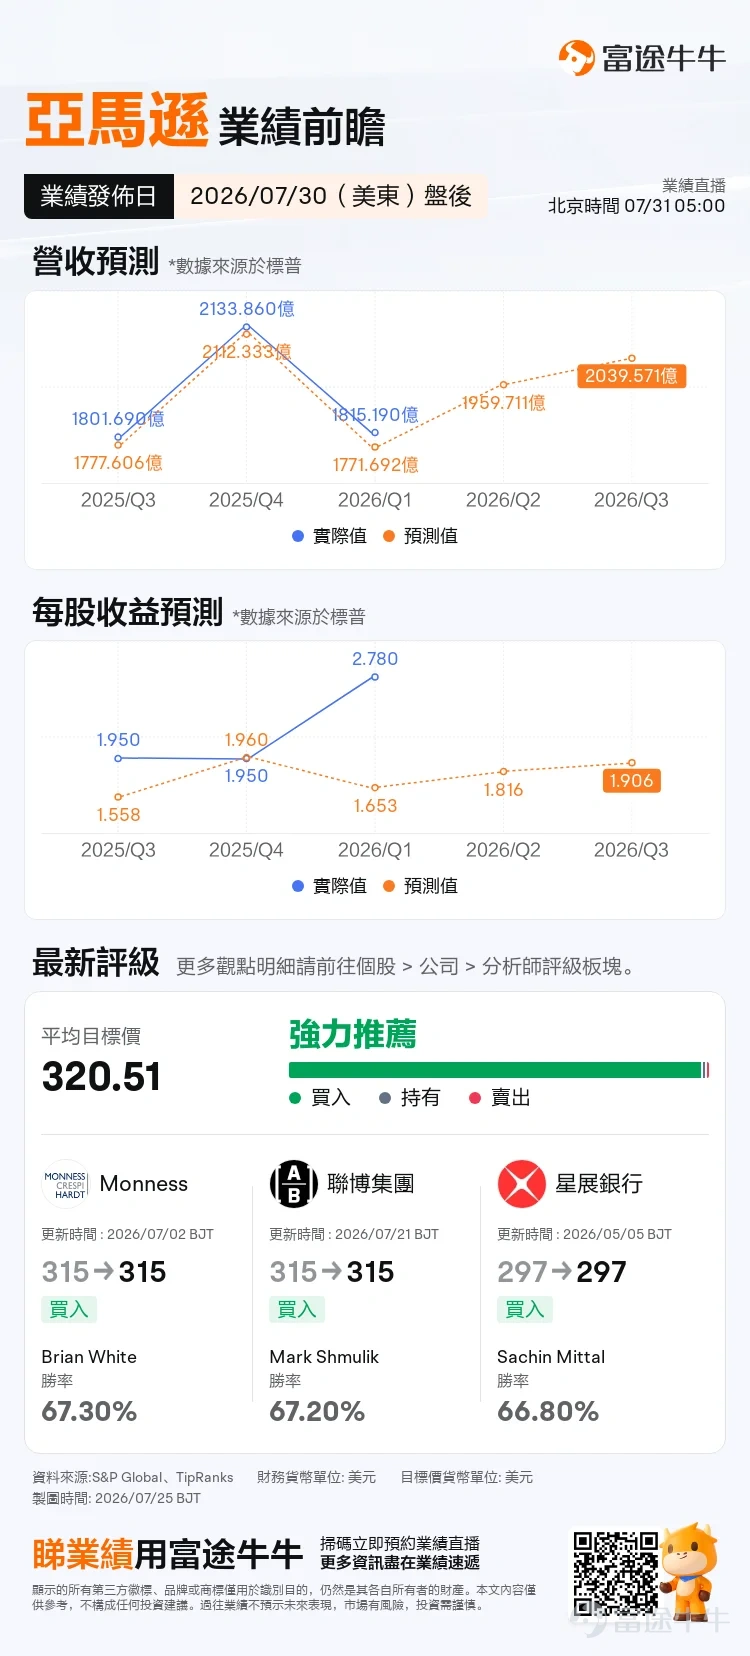
$Amazon (AMZN.US)$Will release its second-quarter (Q2) earnings after the market close on July 30 (U.S. Eastern Time), which is July 31 Beijing time.Wall Street expects revenue this quarter to be approximately $195.97 billion, an increase from the previous quarter's $181.52 billion. In terms of earnings per share (EPS), the market anticipates $1.816, down from the actual Q1 figure of $2.78. However, Q1 itself significantly exceeded expectations, so the current forecast may be somewhat conservative.
Amazon's management provided Q2 operating income guidance in the range of $20 billion to $24 billion.This $4 billion-wide range represents one of the broadest guidance intervals in the company's history,reflecting management's high degree of uncertainty regarding where profits will land this quarter.
Of the 43 analysts currently covering Amazon, all have clear positions,with every single one assigning a 'Buy' rating.The average price target stands at $320.51, implying an upside of approximately 36% from the current share price.
Overall,institutional investors hold a 'cautiously optimistic' view on Amazon's Q2 results.— Expected revenue will steadily increase, and while profitability metrics have declined sequentially, they remain within a reasonable range. The high concentration of 'Buy' ratings clearly reflects the market's strong confidence in Amazon's medium-term growth thesis.
Key Earnings Focus Areas
1) AWS Business Growth Rate
The growth rate of Amazon Web Services (AWS), Amazon's cloud computing segment, remains the most critical metric to watch in this earnings report.In Q1, AWS revenue grew 28% year-over-year, marking its highest growth rate in nearly 15 quarters, with a backlog of $364 billion (up 40% YoY). The market expects Q2 growth to sustain or exceed this pace. If Q2 growth slips into the 20% range, the market would systematically question the rationale behind Amazon’s capital expenditure (Capex) investments.
2) Capital expenditure status and next-quarter guidance
Last week, $Alphabet-C (GOOG.US)$ released its Q2 earnings, reporting an 82% year-over-year increase in its cloud business—significantly exceeding expectations. However, management simultaneously raised its 2026 capital expenditure guidance to approximately $205 billion, and free cash flow turned negative for the first time since its IPO, causing its share price to plummet 6.89% in a single day.
This market reaction is highly instructive. Investors’ focus has clearly shifted from pure 'revenue growth' to 'the efficiency of capital expenditures and return timelines.' Amazon’s full-year 2026 Capex plan is also around $200 billion; its Q1 Capex alone reached $43.2 billion (nearly doubling year-over-year), which caused its free cash flow to plunge from $25.9 billion a year ago to just $1.2 billion. Moody's has already issued a warning, noting that massive investments in AI infrastructure are eroding the balance sheet quality of hyperscalers. Amazon will undoubtedly face equally rigorous market scrutiny in this earnings cycle.
Recent stock price movement
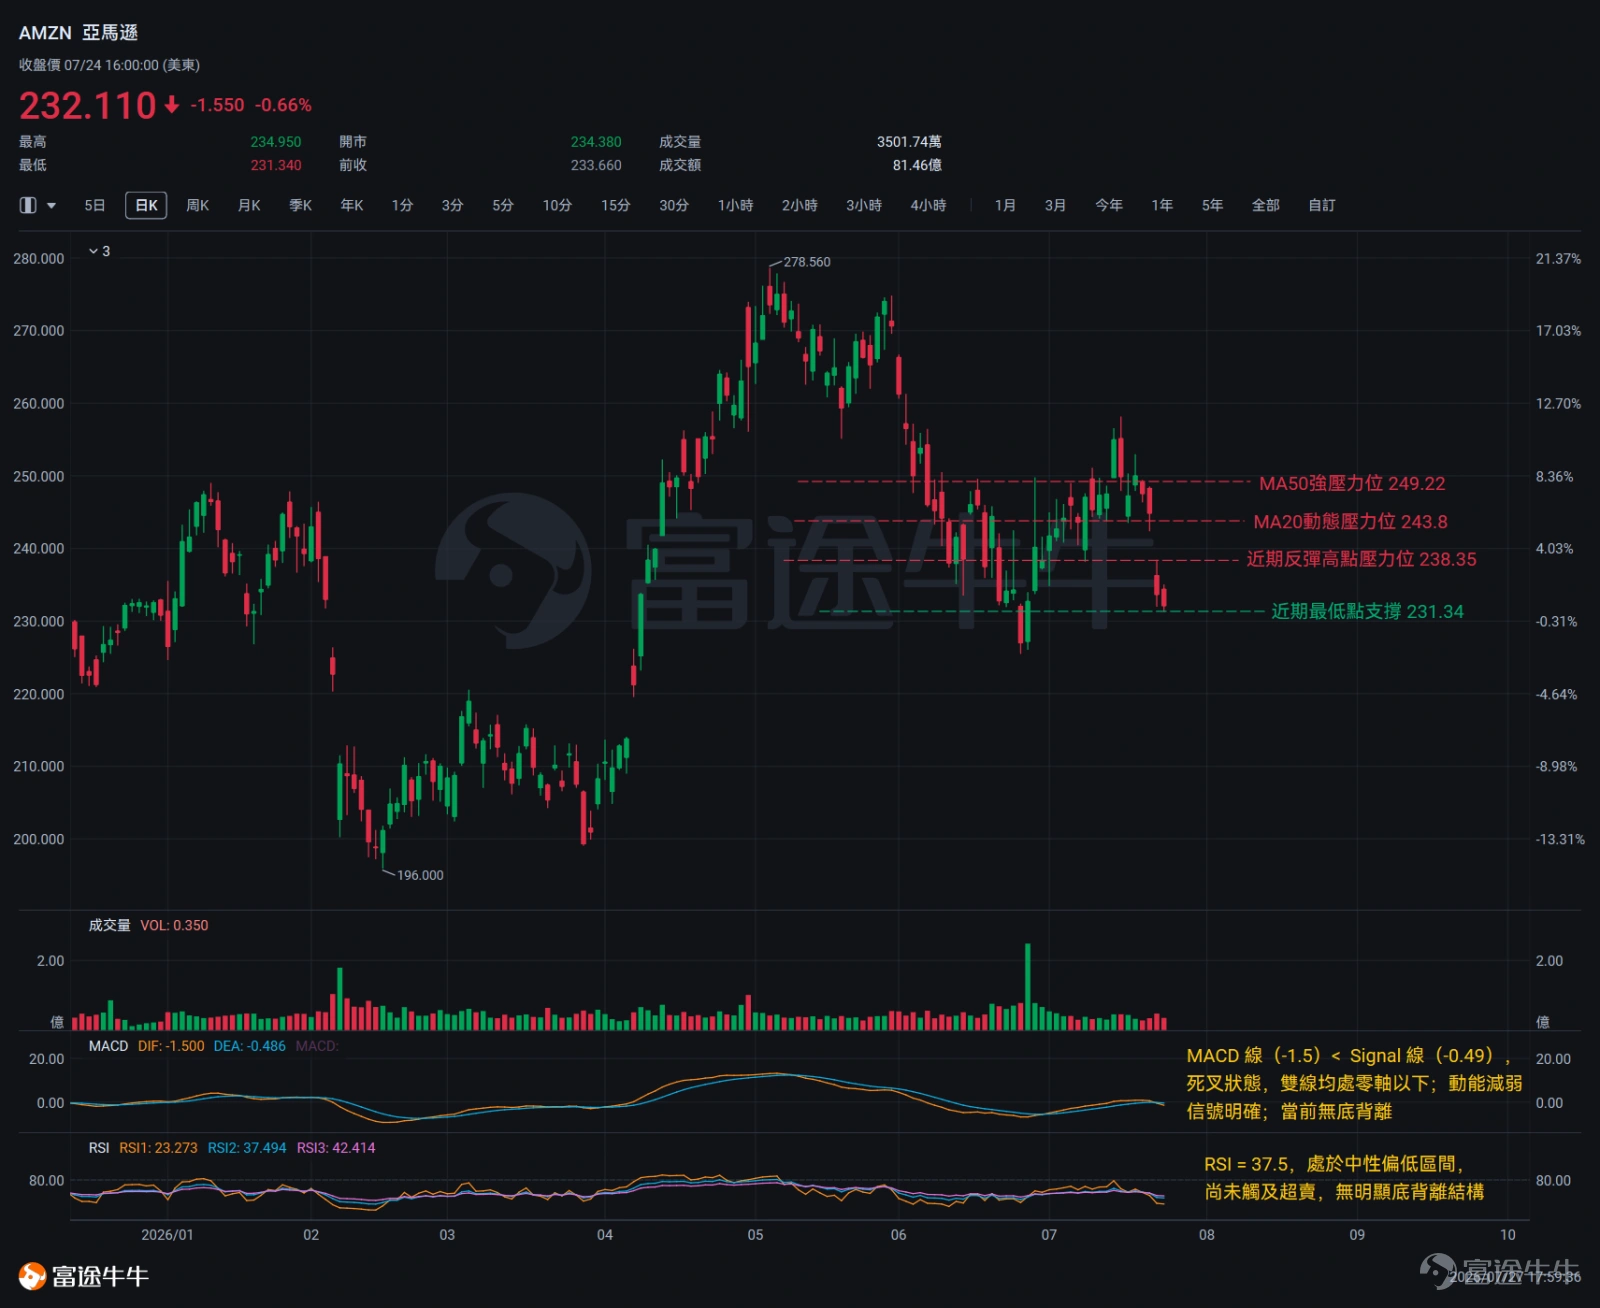
This pullback began on July 15—when the stock hit an intraday high of $256.48 and closed at $254.96. The next day (July 16), it opened higher at $255.12 but quickly reversed course, closing at $249.89,forming a near 'bearish engulfing' candlestick pattern, which served as the trigger for this downtrend.
From July 22 to 24, the decline entered an acceleration phase.On the 22nd, it closed slightly lower with a small bearish candle; on the 23rd, it gapped down at the open to $236.26, then formed a long bearish candle with no upper shadow (opening at the day’s high) on heavy volume, closing at $233.66—a classic sign of accelerated selling pressure; on the 24th, it closed down again at $232.11, marking a new recent low. Four consecutive bearish candles combined with the gap down on July 23 confirm the establishment of an accelerated downtrend,with the gap range ($236.26 to $244.85) now acting as a near-term effective resistance zone.
On the moving average front, the current share price sits below both the 20-day MA ($243.84) and the 50-day MA ($249.22), with both averages sloping downward and the short-term MA below the medium-term MA,clearly indicating a bearish alignment.Regarding Bollinger Bands, the share price ($232.11) has pierced below the lower band ($232.15), and the bands remain in an expansion phase, showing no signs of volatility contraction yet.
As of the trading session on July 24, no bottom reversal signal has emerged yet, and the current technical structure remains weak.
For Amazon,The key level to watch currently is the support at $231.34 (the intraday low on July 24, which also represents the recent lowest closing price support).If this level is breached, there will be little buying support from dense trading zones below.
The nearest resistance level is at $238.35 (the lower edge of the gap down from July 23),Only if the stock price effectively breaks above and stabilizes above this level will it have the technical basis to move upward toward reclaiming the 20-day moving average (MA20) at $243.84;$243.84 is a critical threshold for determining the nature of this rebound—whether it is merely a short-term oversold recovery or an initial sign of a trend reversal.Stronger resistance lies at $249.22 (the 50-day moving average, or MA50),and sustained volume support will be required for any breakout attempt in the near term.
In summary,Amazon's current technical structure is bearish. Investors should closely monitor whether the $231.34 level can hold as support ahead of earnings.If the price recovers above $238.35, traders can assess the potential for continued upside momentum in conjunction with trading volume; catalyzed by earnings,a sustained move above $243.84 would serve as a more critical signal confirming directional bias for Amazon's stock.
Options Market Analysis
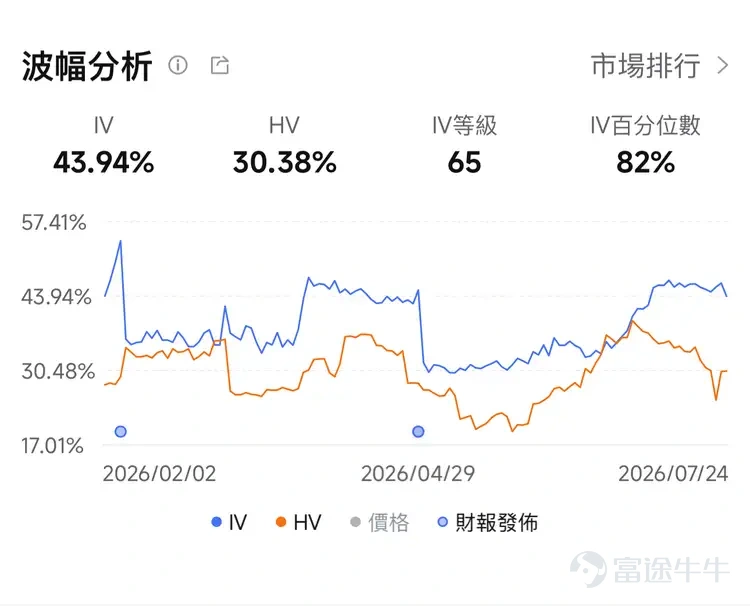
Amazon’s current implied volatility (IV) stands at 43.9%, while its realized historical volatility (HV) over the past 30 days is only 30.4%. The driver behind Amazon’s elevated IV is straightforward—with earnings approaching and the Federal Reserve’s July rate decision window coinciding, these two major events jointly push implied volatility higher.The IV/HV ratio has reached 1.45x, indicating that the market is pricing in significantly higher future volatility compared to recent realized volatility,and this 'premium' represents the profit opportunity for options sellers.
Examining from two perspectives: the IV rank is 65, meaning current IV sits in the upper-mid range of its 52-week high-low interval—not at an absolute historical extreme, but certainly not cheap either; the IV percentile stands at 82%, indicating that IV has been lower than today’s level on 82% of trading days over the past year.Both data points point to the same conclusion: now is an excellent window for options sellers to establish an edge.
Reference Strategy 1: Cash-Secured Put
Options Strategy Reference: Sell AMZN 20260731 210P
Target Investors: Suitable for those who are confident in Amazon's post-earnings price movement, or who are willing to buy or add to their position at a lower price if the stock declines after earnings.
Reference Strike Price: $210 (approximately 10% below the current stock price, providing ample downside buffer)
Reference Premium: Approximately $140.5 per contract (equivalent to a cost basis reduction of about $1.405 per share)
(Note: The options strategies presented here are for reference only and do not constitute investment advice or guarantees; market conditions change frequently, and the quoted option prices may not reflect real-time values.)
Rationale: If earnings exceed expectations, the put will likely expire worthless, allowing the seller to keep the full premium. If earnings meet expectations or slightly miss but the stock price decline is limited, the put will also likely expire worthless due to implied volatility (IV) reverting to normal levels and time decay. If earnings significantly disappoint, the investor can choose to close the position early to limit losses and avoid being assigned the underlying shares.
Reference Strategy 2: Covered Call
Options Strategy Reference: Hold 100 shares of Amazon stock and sell AMZN 20260731 250C
Target investors: Suitable for those who currently hold Amazon shares, have limited expectations for upside potential after earnings, and wish to trade off some of that potential upside in exchange for downside protection and a reduced cost basis.
Suggested strike price: $250 (anchored at the confluence of the 50-day moving average and the upper Bollinger Band resistance level)
Estimated premium: Approximately $243 per contract (equivalent to a cost basis reduction of about $2.43 per share)
(Note: The options strategies presented here are for reference only and do not constitute investment advice or guarantees; market conditions change frequently, and the quoted option prices may not reflect real-time values.)
Rationale: Implied volatility (IV) is currently at an extremely elevated level, meaning the premium received from selling out-of-the-money (OTM) calls significantly exceeds typical levels. If the stock price rises moderately or remains range-bound following the earnings release, the full premium will be retained. If the stock surges above the strike price, the underlying shares will be called away at the strike price, but the collected premium serves as additional compensation, resulting in an effective sale price higher than the strike alone. The only trade-off for the investor is forfeiting any gains beyond the strike price.
Finally, Options Sir has a small perk for fellow investors—welcome to claim it!Options Starter Pack
*This promotion is exclusively available to invited HK users. Click to learn more.Detailed terms and conditions of the promotion >>
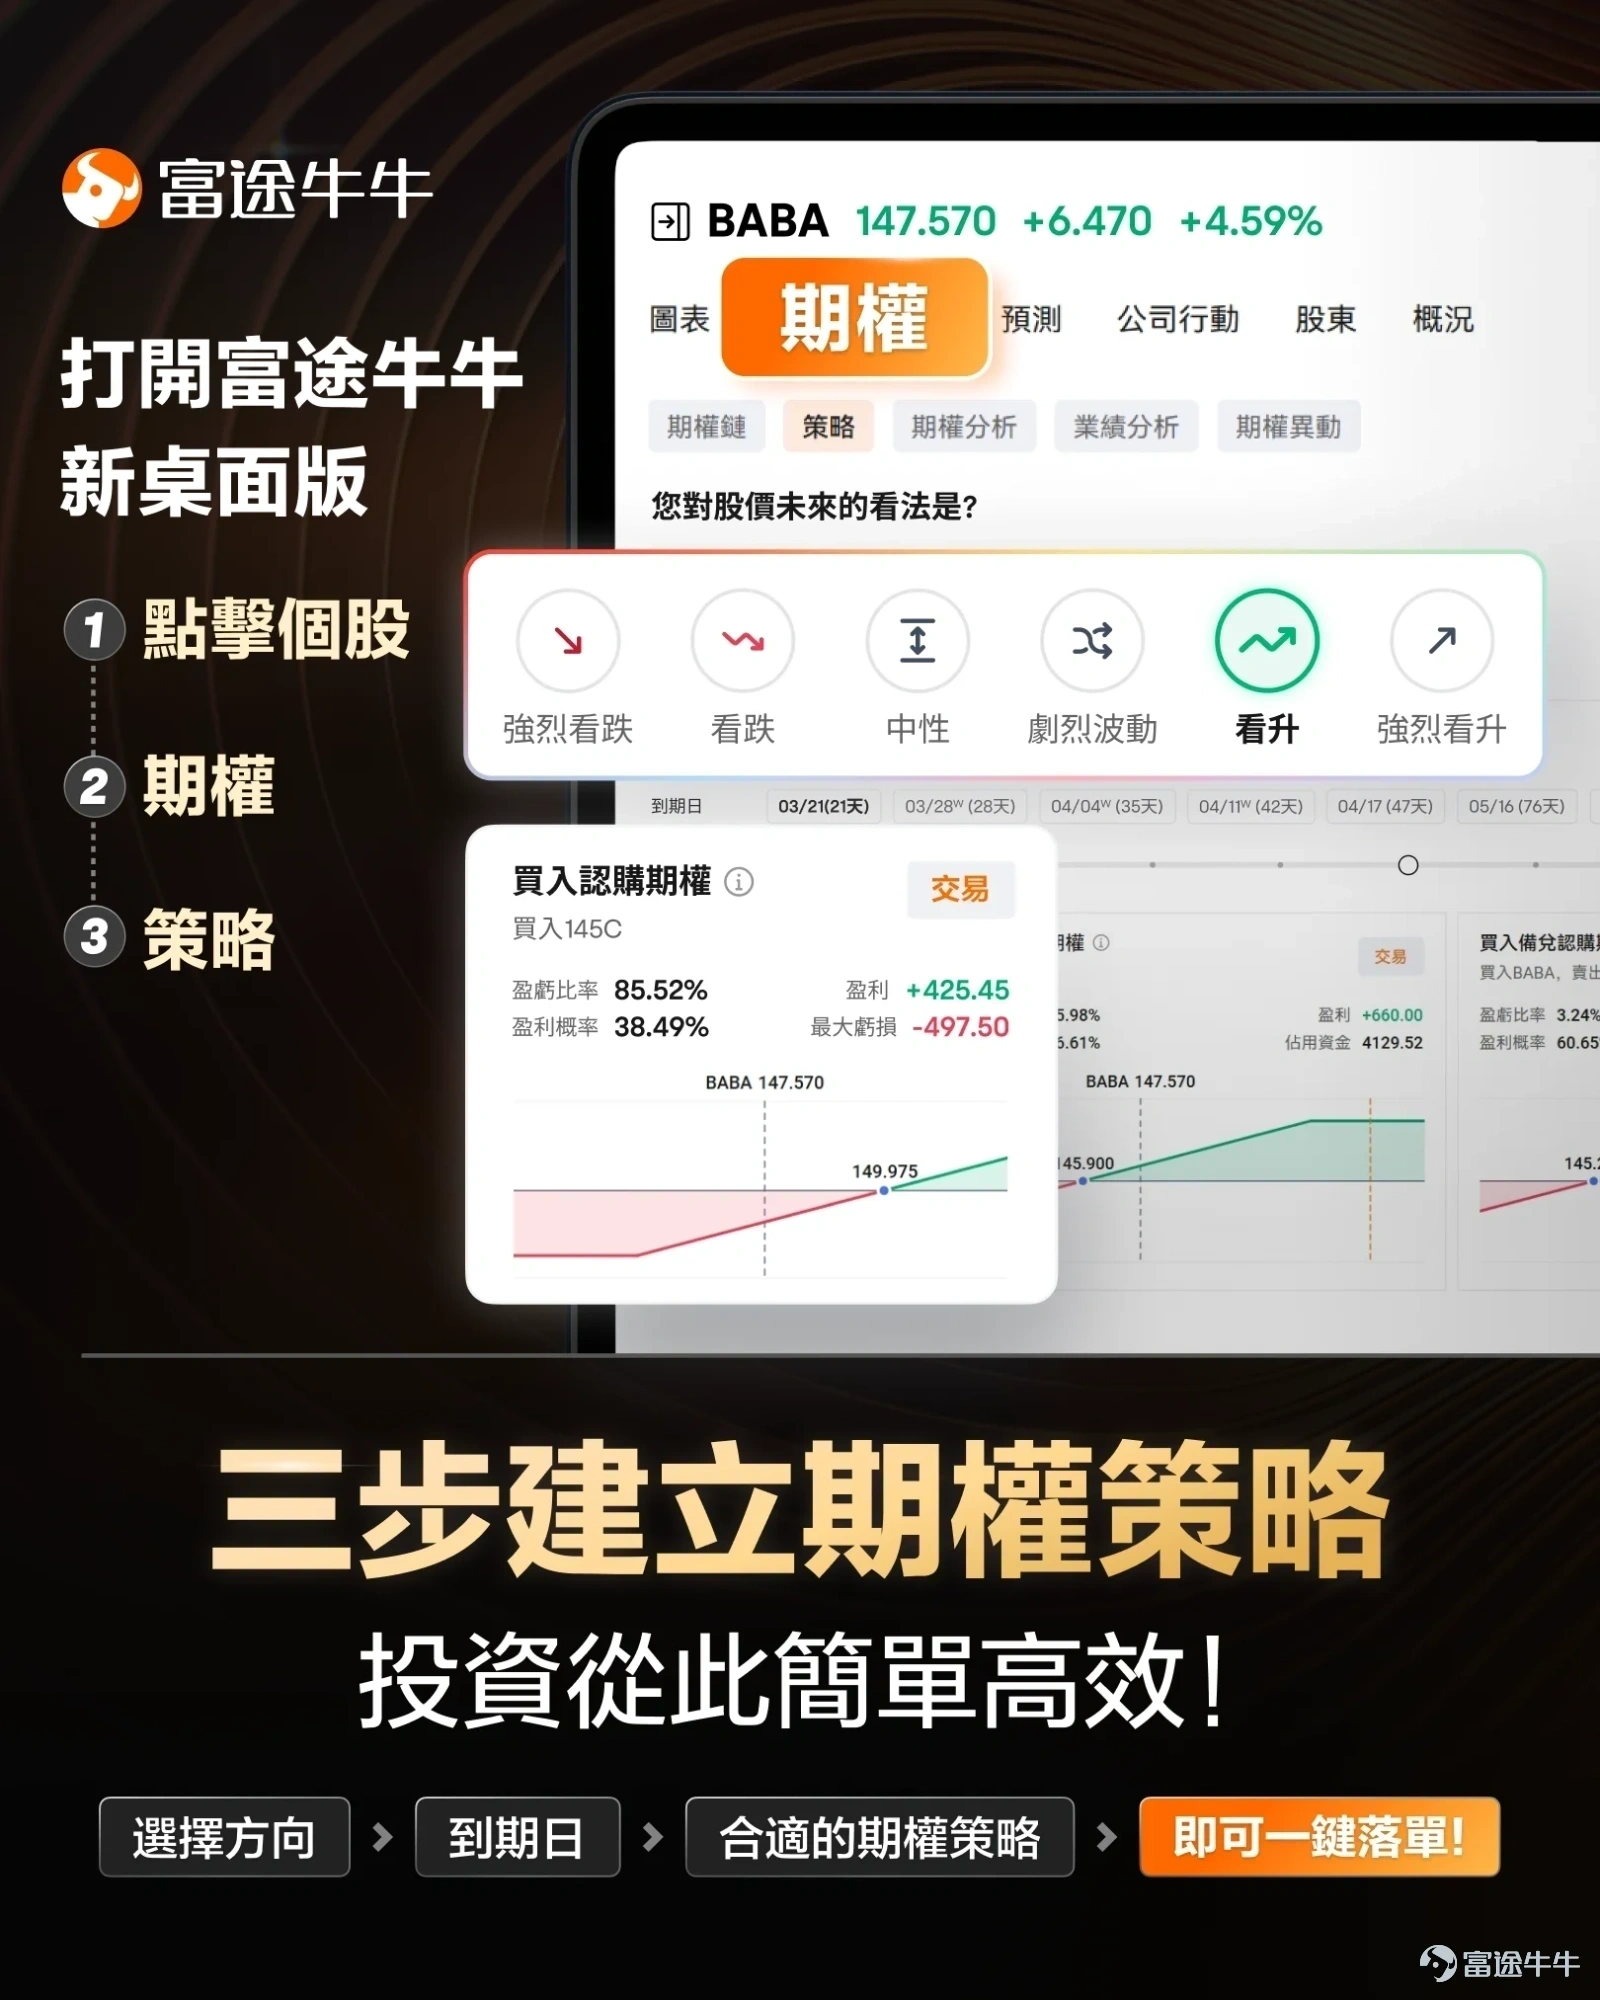
Market conditions are complex and ever-changing,Options strategiesOverwhelmed by choices? Futubull helps you set up in three simple steps.Options strategies, making investing simple and efficient!
Options Risk Disclosure:An option is a contract that gives the holder the right—but not the obligation—to buy or sell an underlying asset at a predetermined price on or before a specific date. Option prices are influenced by multiple factors, including the current price of the underlying asset, the strike price, time to expiration, and implied volatility. Implied volatility reflects the market’s expectation of future price fluctuations over the option's life and is derived by reversing the Black-Scholes option pricing model. It is commonly viewed as a gauge of market sentiment. When investors anticipate greater volatility, they may be willing to pay higher premiums for options to hedge their risk, resulting in higher implied volatility. Traders and investors use implied volatility to assess the attractiveness of option prices, identify potential mispricings, and manage risk exposure.
Disclaimer:This content does not constitute an offer, solicitation, recommendation, advice, opinion, or any guarantee regarding any securities, financial products, or instruments. The risk of loss in trading options can be substantial. In certain circumstances, your losses may exceed the initial margin deposit. Even if you set contingent orders such as 'stop-loss' or 'limit' orders, there is no assurance these will prevent losses. Market conditions may render such orders unexecutable. You may be required to deposit additional margin on short notice. If you fail to meet the margin call within the specified timeframe, your open positions may be liquidated. You remain fully liable for any deficit balance in your account resulting from such liquidation. Therefore, prior to trading options, you should thoroughly research and understand options and carefully consider whether such trading aligns with your financial situation and investment objectives. If you trade options, you should be familiar with the procedures for exercising options and handling expiration, as well as your rights and obligations upon exercise or expiration. Options trading involves substantial risk and is not suitable for all investors. Investors should carefully read"Characteristics and Risks of Standardized Options"。
Risk Disclaimer: The above content only represents the author's view. It does not represent any position or investment advice of Futu. Futu makes no representation or warranty.Read more


Comments
to post a comment
15
16