
Inflation expectations rise further, capital flows out again, and Bitcoin trades in a narrow range | Bitcoin | Research Report | Cryptocurrency Market Analysis | Late Stage of Bear Market
During the third week of July 2026 (July 19–25), the crypto market traded in a narrow range amid dual pressures from macro financial tightening and cross-cycle accumulation, posting a slight weekly decline of 0.77%.
Financial tightening was jointly driven by Trump’s new tariff policy announcement and renewed U.S.-Iran geopolitical tensions that heightened inflation expectations. Surging U.S. Treasury yields and shrinking Fed net liquidity created strong macro headwinds; this tightening signal was smoothly transmitted to the crypto asset market through risk-appetite suppression mechanisms, resulting in net outflows of incremental capital and continued slowdown in spot trading activity.
However, despite external liquidity tightening weighing on Bitcoin’s valuation, on-chain and exchange dynamics have shown notable resilience: spot holdings have continued to net flow out of exchanges and been absorbed by new investors, with no signs of panic-driven capitulation selling, keeping the overall price range-bound around $64,296.
The 'confirmed transmission' of macro tightening intertwines with 'accumulation of positions' within the crypto market, jointly forming a transmission chain characterized by external pressure and internal accumulation.

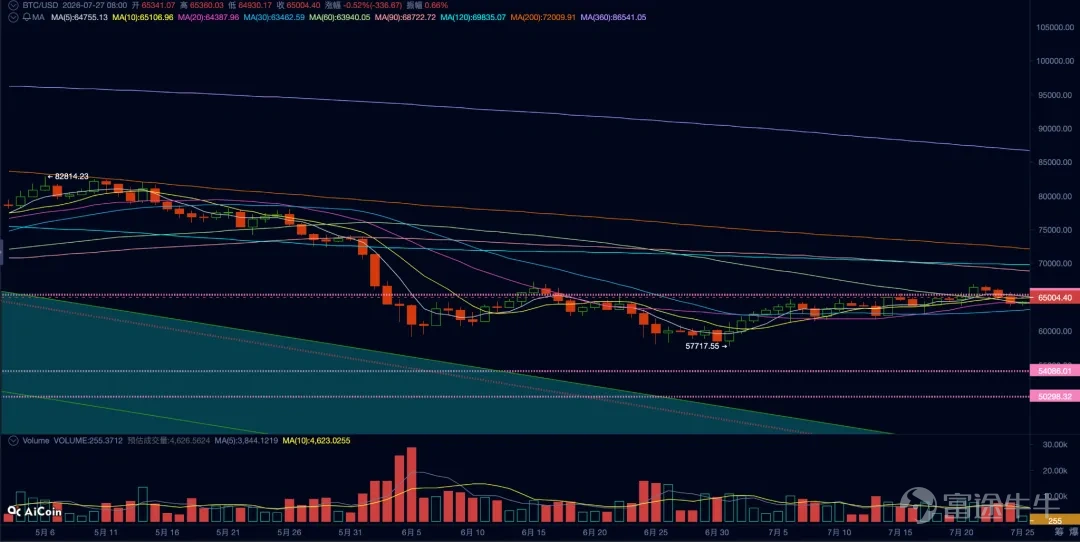
BTC Daily Price Chart
Macro Finance
This week, global macro financial conditions have clearly turned restrictive, creating direct headwinds for non-yielding risk assets like Bitcoin.
Liquidity and policy conditions show clear marginal tightening. The Fed’s net liquidity contracted by 0.98% in a single week, reflecting sustained pressure on liquidity supply from the central bank’s balance sheet. Meanwhile, the Secured Overnight Financing Rate (SOFR) rose by 5 basis points to 3.64%, indicating higher short-term funding costs in money markets and a marginal tightening in liquidity conditions. On July 23, the U.S. announced new Section 301 tariff measures, and escalating geopolitical tensions in the Middle East stoked inflation expectations, making hawkish repricing the dominant driver of liquidity trends. The 0.98% decline in the Fed’s net liquidity and the rise in SOFR to 3.64% jointly confirm that underlying liquidity contraction is suppressing market leverage and funding availability.
Interest rate and foreign exchange markets experienced sharp repricing. The yield on U.S. 2-year Treasury notes surged by 10 basis points (+10bp) to 3.81% over the week, while the 10-year Treasury yield rose by 14 basis points (+14bp) to 4.68%. The pronounced increase in longer-end yields pushed the entire yield curve upward in a parallel shift. Higher risk-free and real rates strongly supported a 0.67% weekly gain in the U.S. Dollar Index (DXY), lifting it to 101.43. The climb in 10-year Treasury yields to 4.68% significantly raised the theoretical discount rate for risk assets, while the stronger dollar further tightened global dollar liquidity.
Under dual pressures from liquidity contraction and rising discount rates, equity risk assets broadly declined, reflecting a clear risk-off transmission. Against this backdrop of macro tightening—and following a sharp selloff in semiconductors—Alphabet and Tesla, two of the 'Magnificent Seven' reporting earnings this week, both plunged as their massive AI infrastructure expenditures caused free cash flow to turn negative this quarter. This highlights how, amid tightening macro liquidity and rising odds of a Fed rate hike (57.3% probability for September), assets with long duration face severe valuation pressure under elevated duration risk and high valuations. The Nasdaq Composite tumbled 2.13% this week; the S&P 500 fell 0.61%; and the Dow Jones Industrial Average dropped 0.38%. Soaring Treasury yields directly pressured premiums on high-valuation assets, and the pullback in risk assets aligned with the Fed’s 0.98% weekly contraction in net liquidity, confirming a broad-based reduction in risk appetite.
The resurgence of conflict between the U.S. and Iran has reignited fears of a rebound in U.S. inflation, fueling concerns about further rate hikes. Compounded by U.S. AI firms’ capital expenditures exceeding their free cash flow generation, market adjustment pressures have intensified. For crypto markets, Bitcoin faces even greater valuation pressure than AI-related tech stocks, and combined with internal cycle cleansing and price restructuring, its price weakness suggests a potential failure of the recent rally.
Crypto Markets
The crypto market internally exhibits a composite profile of shrinking spot liquidity, withdrawal of incremental capital, modest accumulation of nominal leverage, and ongoing position consolidation, with market dynamics characterized by 'leverage-driven/micro-level accumulation.'
Bitcoin traded in a narrow range this week, opening at $64,796 and closing at $64,296, for a weekly decline of -0.77%. It reached an intraweek high of $66,924 and a low of $63,641, resulting in a weekly volatility range of 5.07%. Trading volume dropped to a 7-day average of 13,1073%.
In terms of capital flows, off-exchange incremental funds showed net outflows. Specifically, Bitcoin ETFs recorded net outflows of $121 million this week, and stablecoin supply decreased by $826 million. Continuous outflows of marginal external capital reflect institutional and off-exchange liquidity temporarily retreating amid the macro tightening environment.
The derivatives market exhibits a dual dynamic of rising nominal leverage alongside slowing trading activity. Open interest (OI) in contracts grew by +1.89% to $59.6 billion, while the 7-day average daily trading volume of perpetual contracts declined to $31.06 billion (down -4.68% from the prior week). The concurrent rise in OI amid a 5.33% drop in spot trading volume indicates a modest accumulation of derivatives leverage against a backdrop of contracting spot liquidity.
On-chain supply and position structures show signs of cycle clearing and ongoing accumulation. This week, exchange Bitcoin balances decreased by 18,008 BTC, while the overall on-chain MVRV ratio slightly declined to 1.22—near the lower end of its historical range of 1.10 to 2.10. Long-term holder (LTH) MVRV stood at 1.31, maintaining paper profits, whereas short-term holder (STH) MVRV further dropped to 0.93, indicating heightened unrealized losses for short-term positions. In terms of realized P&L, long-term holders remained in a net loss position throughout the week, with over $1 billion in realized losses—though this was down 50% from the previous week. Additionally, long-term holdings increased by 9,798.87 BTC and short-term holdings rose by 10,630 BTC, further confirming the absorption and consolidation of supply during market churning.
Market Implications
Combining macroeconomic and on-chain crypto data, this week’s market evolution followed a clear causal chain: 'macro tightening → transmission through channels → structural divergence in crypto → Bitcoin price consolidation amid volatility.'
The transmission mechanism from macro conditions to crypto markets is assessed as 'full transmission.' Tariff policies and geopolitical inflation expectations triggered repricing toward higher rates, which directly suppressed risk appetite and flowed through to crypto entry points: Bitcoin ETFs recorded net outflows of $121 million, stablecoin supply contracted by $826 million, spot average daily trading volume fell by 5.33%, and the Nasdaq declined by 2.13%—all showing strong synchronization with external capital outflows from crypto.
Market dynamics displayed a dual characteristic: 'resonance' in external capital flows and 'offsetting' within internal structure. Macroeconomic tightening resonated with outflows of off-exchange crypto capital, creating clear macro headwinds. However, Bitcoin’s price (-0.77%) did not follow the sharp selloff seen in high-valuation U.S. equity segments (Nasdaq: -2.13%), thanks to effective offsetting from internal spot-market structures within the crypto ecosystem.
This structural resilience that offsets external shocks is reflected in reduced selling pressure, stronger on-exchange buying support, and ultimately a significant outflow of Bitcoin from exchanges.
In summary,Although macro tightening created headwinds, continuous reduction of spot supply on exchanges, net accumulation by both on-chain holder cohorts, and the absence of panic-driven capitulation selling provided underlying support.
Outlook
The current state of the crypto market is shaped jointly by internal structural resilience and intense macro liquidity pressure, with future movements hinging on the evolving balance between these two opposing forces:
1. Federal Reserve FOMC Rate Decision and Press Conference (July 28–29): The Fed will announce its rate decision on July 29, followed by a press conference. If the policy statement or press conference signals a hawkish stance or dampens rate-cut expectations, it would further push up short-end U.S. Treasury yields and the U.S. Dollar Index, intensifying macro financial tightening and directly suppressing Bitcoin risk appetite. Conversely, any marginal dovish signal could improve liquidity expectations.
2. U.S. Q2 GDP Preliminary Estimate and PCE Price Index (July 30): The Bureau of Economic Analysis will release Q2 real GDP and the PCE price index. If economic growth proves strong and inflation remains stickier than expected, this would reinforce expectations of prolonged high interest rates, pushing up the 10-year Treasury yield and supporting the U.S. dollar, thereby increasing liquidity headwinds for non-yielding assets like Bitcoin.
3. Progress in the U.S.-Iran conflict and prospects for a return to negotiations: As the renewed U.S.-Iran conflict drags on, inflation expectations are rising rapidly, placing increasing pressure on financial markets. If President Trump timely implements TACO measures to ease pressure on crude oil futures and financial markets, markets could gain temporary relief.
4. Mega-cap Tech Earnings: Next week, Meta, Microsoft, Amazon, and Apple—four of the 'Magnificent Seven'—will report earnings. Their capital expenditure (CapEx) and free cash flow will be closely watched. CapEx is likely to continue growing, while free cash flow may come under pressure or even turn negative, adding further stress to markets and potentially impacting index performance, which could in turn affect fund flows into Bitcoin ETFs.
The above analysis is provided by EMC Labs.
———————————————————————
About EMC Labs
EMC Labs is a partner of Victory Securities, and together they have launched the only virtual asset fund approved by the SEC to accept stablecoin subscriptions—the Victory EMC BTC Cycle Fund. EMC Labs was co-founded by seasoned virtual asset investors and data scientists, with a core team hailing from JD.com Finance, Bell Labs, Marsbit, and other companies. EMC Labs has invested substantial resources in building a professional engine to analyze Bitcoin’s on-chain data and technical indicators.
Disclaimer
Investment involves risks, and investors should take note. The value of securities and investments can go up as well as down and is not guaranteed. Investors may not get back the original investment amount, and past performance is not necessarily indicative of future results. Victory Securities’ securities trading services are provided by Victory Securities Limited (hereinafter referred to as “Victory Securities”). This document was prepared and authorized for release on this platform by Victory Securities Limited, and the information contained herein is for reference purposes only. Victory Securities Limited reserves the right to make changes or terminate at any time without prior notice. All information provided on this platform, including this document and its contents, may not be reproduced, linked, reposted, or otherwise copied for publication or commercial use by any media, website, or individual without prior written authorization from Victory Securities. Authorized users must acknowledge that the source material originates from Victory Securities when using this document and its content, and commit to complying with relevant laws and all international conventions regarding internet usage, refraining from illegal purposes or unlawful use of this document. Violators will bear all associated legal and financial responsibilities. Data or figures quoted in this document may come from third parties; Victory Securities does not guarantee the accuracy of such third-party data or materials, nor will it assume liability for the fairness, accuracy, timeliness, completeness, or correctness of any data, forecasts, and/or opinions contained herein, nor the benchmarks upon which such forecasts and/or opinions are based. Any forward-looking statements in this document do not constitute guarantees of future performance, and actual circumstances or developments may differ significantly. This document is not and should not be considered or construed as an offer, invitation, solicitation, recommendation, advice to buy or sell any investment products, or as a basis for investment decisions, nor should it be interpreted as professional advice. Readers or those making investment decisions should fully understand the risks involved and the legal, tax, and accounting characteristics and consequences, and decide whether investing aligns with personal objectives and risk tolerance. Seek appropriate professional advice if necessary. In certain countries, the distribution and circulation of this document may be restricted by law or regulation, and recipients should be aware of and comply with such restrictions.
Risk Disclaimer: The above content only represents the author's view. It does not represent any position or investment advice of Futu. Futu makes no representation or warranty.Read more
Comments
to post a comment