
Tesla plunged after its earnings report—what’s the outlook ahead?

Daily Options Income Strategy | Q2 Earnings Spark Divergence! Tesla Plunges Over 14% Post-Earnings—How to Trade the Growing Pains and Future of Its 'WWII-Scale' Expansion?
1. Market Sentiment Indicator
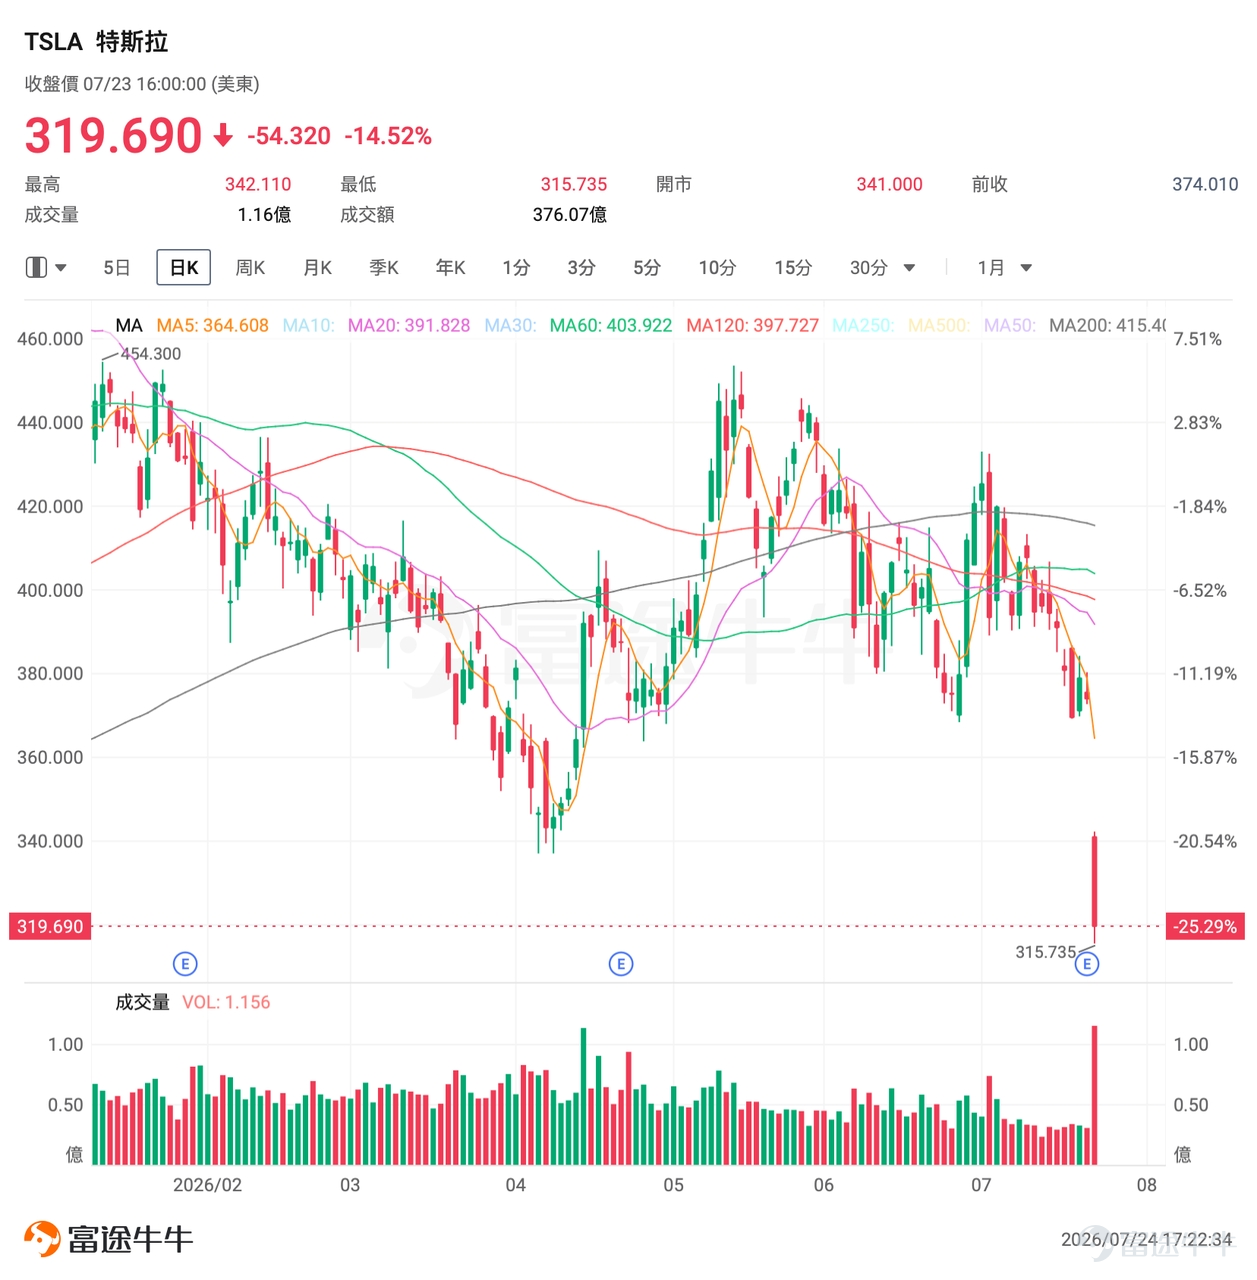
All three major U.S. equity indices declined collectively in the previous trading session, led by technology stocks. $Tesla (TSLA.US)$ Following the release of earnings that beat revenue expectations but missed across the board on profitability, gross margin, and free cash flow, the stock plummeted 14.52% to $319.69—the largest single-day drop in nearly six months. Revenue growth failed to offset the erosion of profits caused by the AI super-investment cycle. Extreme divergence between bulls and bears has kept options implied volatility elevated, creating a premium window for sellers.
II. Watchlist Highlights
TSLA: Q2 Earnings Tear Apart 'AI Faith,' Super Investment Cycle Triggers Short-Term Pain in Profits and Cash Flow
$Tesla (TSLA.US)$ The stock plunged 14.52% in the previous trading session, closing at $319.69, with an intraday low of $315.73, approaching the 52-week low range. Trading volume surged to $37.456 billion, up 227% from the prior day. After the earnings release on July 22, shares dropped about 3% in after-hours trading, and selling pressure intensified further at the next day's open.

The current technical structure is in a breakdown downtrend, with the share price having fallen below its prior consolidation range., breaching multiple key technical support levels. The RSI has rapidly entered oversold territory, and the MACD death cross is widening, indicating strong short-term bearish momentum. The opening price zone of $340–$341 has now turned into resistance, while immediate downside support sits near $315; a break below could test the psychological $300 level.
The core conflict driving this sell-off lies in the structural divergence between revenue growth and earnings quality in the earnings report.
Record-breaking revenue and deliveries, yet profits under broad pressure. $Tesla (TSLA.US)$ Q2 total revenue reached $28.236 billion, up 26% year-over-year, with vehicle deliveries of 480,126 units, a 25% YoY increase. However, net income attributable to common shareholders was $1.114 billion, down 5% YoY; adjusted EPS came in at $0.33, more than 35% below market expectations. Automotive gross margin was 16.8%, or 16.3% excluding regulatory credits, below consensus estimates. Jefferies noted that Q2 EBIT missed market expectations by a wide margin—approximately $1 billion shortfall—primarily due to declining gross margins and higher R&D expenses.
Negative free cash flow and the full-scale launch of the AI investment cycle represent the market’s primary concern.The company’s Q2 capital expenditures soared to $5.789 billion, up 142% year-over-year, resulting in negative free cash flow of $1.092 billion—the first time it has turned negative in over two years.During the earnings call, CEO Musk stated that Tesla is undergoing 'the fastest industrial-scale expansion in the U.S. since World War II.'Reaffirmed that capital expenditures in 2026 will exceed $25 billion and is seeking to establish a debt financing facility of up to $30 billion to support its expansion.
Key variables to monitor going forward include the commercialization progress of FSD (Full Self-Driving) and the rollout pace of new businesses such as Optimus.
Wall Street analysts are significantly divided on $Tesla (TSLA.US)$there is significant divergence.The average price target among 24 analysts is $415.90, with 41.67% bullish, 50.00% neutral, and only 8.33% bearish. Bullish analysts include Stifel ($508 target), RBC ($500), and Piper Sandler ($500), who believe the long-term value of Tesla’s autonomous driving and AI initiatives remains intact. JPMorgan has a $450 target, emphasizing that 'near-term volatility does not diminish long-term potential.' On the bearish side, Wells Fargo is the most aggressive, with a $130 target.
3. Options Premium Collection Strategy
1. Cash Secured Put
Sell 1 contract of $Tesla (TSLA.US)$ TSLA Aug 21, 2026 $290 Put; estimated required margin (for reference only): $29,000 ($290 × 100)

Opportunity Rationale:
For investors who believe in Tesla’s long-term AI and robotics transformation narrative but have not yet established a position, the current share price has plummeted following the Q2 earnings shock. However, the company still reported record-high revenue and deliveries, FSD subscription users now approach 1.5 million, Robotaxi vehicles have safely logged over 380,000 miles, and Optimus production lines have already begun construction.
By selling put options, if the stock price stabilizes or rebounds from its current low range, investors can capture premium income in this high-volatility environment; if the price continues to decline due to prevailing pessimism, they may also have the opportunity to establish a position at a more attractive cost basis.
2. Covered Call

Opportunity Rationale:
For investors already holding Tesla, the stock has broken key technical support levels following the disappointing earnings report, and the $340–$350 range now represents significant resistance overhead. Although Musk’s 'World War II-scale expansion' narrative offers long-term upside potential, the planned $30 billion debt issuance, persistently negative free cash flow, and high valuation suggest the stock may struggle to recover quickly in the near term.
If investors remain bullish on the long-term value of Robotaxi and Optimus but are concerned that near-term earnings pain may continue to weigh on the stock price, they can sell call options. If the stock consolidates at current low levels, the premium income can gradually lower the cost basis of their position; if subsequent Optimus production progress exceeds expectations and drives the stock price to rebound near $350—triggering assignment—it would effectively realize a阶段性 profit-taking at a key resistance level.
IV. Risk Management Advisory
Although seller strategies have a high win rate, investors must still implement proper risk management:
– Position sizing is everything: The biggest risk of option-selling strategies lies in black swan events. It’s recommended that margin allocated to any single underlying should not exceed 20% of total capital. Never sell options beyond your risk capacity just for the sake of collecting higher premiums.
– Timely rolling of covered calls:If a covered call becomes deeply in-the-money (i.e., the stock price significantly exceeds the strike price) and you remain bullish on the underlying stock, promptly 'roll' the position—close the current option by buying it back and simultaneously sell a new call with a later expiration and a higher strike price—to avoid having your shares called away at an unfavorable price.
– Beware of 'left-tail risk' with cash-secured puts: For cash-secured puts, if the stock price crashes due to fundamental deterioration (rather than a normal pullback), don’t hold on stubbornly. In such cases, exit with a stop-loss or roll the position down to buy time while waiting for volatility to normalize.
Make good use of the Option Seller Hub to understand potential income strategies for selling options,Earn option premiums!

Options Risk Disclosure
An option is a contract that gives the holder the right—but not the obligation—to buy or sell an asset at a predetermined price on or before a specified date. Option prices are influenced by multiple factors, including the current price of the underlying asset, the strike price, time to expiration, and implied volatility. Implied volatility reflects the market’s expectation of future volatility over the life of the option; it is derived by reverse-engineering the Black-Scholes pricing model and is generally viewed as an indicator of market sentiment. When investors anticipate greater volatility, they may be willing to pay higher prices for options to hedge risk, leading to elevated implied volatility. Traders and investors use implied volatility to assess the attractiveness of option prices, identify potential mispricings, and manage risk exposure.
Disclaimer
This content does not constitute an offer, solicitation, recommendation, advice, opinion, or any form of guarantee regarding any securities, financial products, or instruments. Trading options involves substantial risk of loss. In certain circumstances, your losses may exceed the initial margin deposited. Even if you place contingent orders such as 'stop-loss' or 'limit' orders, there is no guarantee they will prevent losses. Market conditions may render such orders unexecutable. You may be required to deposit additional margin on short notice. Failure to meet such margin calls within the specified timeframe may result in the liquidation of your open positions. You remain liable for any resulting deficit in your account. Therefore, prior to trading options, you should study and understand options thoroughly and carefully consider whether such trading aligns with your financial situation and investment objectives. If you trade options, you should familiarize yourself with the procedures for exercising options and handling expiration, as well as your rights and obligations upon exercise or expiration. Options trading entails significant risk and is not suitable for all investors. Investors should carefully read 'Characteristics and Risks of Standardized Options' before engaging in any options trading strategy.
Risk Disclaimer: The above content only represents the author's view. It does not represent any position or investment advice of Futu. Futu makes no representation or warranty.Read more


Comments (2)
to post a comment
28
54