
標普納指保持漲勢,你是多頭還是空軍?

US Equity Index Warrants / Bull & Bear Certificates Watch | All three major indices pulled back in unison, but bearish products aren’t necessarily easier to select than bullish ones
On July 23, all three major US equity indices declined across the board: the Dow Jones Industrial Average closed at 51,711.65 points, down 0.97%; the S&P 500 Index closed at 7,408.30 points, down 1.21%; and the Nasdaq-100 closed at 28,454.81 points, down 1.87%.
Judging solely by price action, the Nasdaq is under the most evident pressure, having retreated near the lower Bollinger Band at around 28,422 points. The S&P 500 has shifted from sideways consolidation at recent highs to testing the support zone between 7,376 and 7,340 points. The Dow remains relatively stable, though it closed near the lower Bollinger Band at 51,645 points.
Everyone likely has their own view on whether this pullback is merely a short-term correction or signals weakening momentum in the uptrend. What concerns us more is: when directional volatility suddenly spikes, which terms of index warrants and bull/bear certificates listed in Hong Kong can truly keep pace?

Nasdaq-100 $NASDAQ 100 Index (.NDX.US)$ : Dropped to the lower Bollinger Band—bull certificates and call warrants shouldn’t be approached with the same strategy
The Nasdaq-100 closed at 28,454.81 points, with the Bollinger Band midline around 29,330 points and the lower band around 28,423 points. The short-term RSI has fallen to approximately 33, indicating technical oversold conditions, yet the index has not yet reclaimed the 29,000-point level. Both a short-term rebound and further downside remain plausible scenarios.
For those bullish on a short-term Nasdaq rebound, there are 38 bull certificates available in the market, with knock-out levels ranging from 21,000 to 28,000 points, representing knock-out distances of roughly 2.23% to 26.67%.
While choices appear abundant, what really matters is distinguishing between them:
– At-the-money bull certificates with knock-out levels near 27,800 to 28,000 points have only about a 2% to 3% buffer, offering leverage as high as approximately 24x;
– Products with knock-out levels around 26,000 to 27,000 points have a 5% to 9% buffer; although leverage is comparatively lower, they can better withstand another sharp overnight drop in U.S. markets;
– Products with even more distant knock-out levels have median leverage of about 5.9x, offering much more stable price reactions—but they’re unsuitable for traders aiming only to capture intraday rebounds of a few hundred points.
The Nasdaq itself is already near the bottom of its channel. Using bull certificates with only a 2–3% knock-out buffer at this level carries a key risk—not necessarily getting the long-term direction wrong, but rather the index briefly piercing below support, triggering knock-out before any subsequent rebound occurs.
Regarding call warrants, there are nine products with strike prices ranging from 28,800 to 35,800 points, offering effective leverage of approximately 9.5x to 14.4x and implied volatility between roughly 23.4% and 29.1%.
Among them, one group has strike prices ranging from 28,800 to 28,944 points, which are already at-the-money or slightly in-the-money, with delta around 55% to 57%. Their terms are clearly more practical compared to products with strike prices above 32,000 points. The latter are 10% to 23% out-of-the-money, with delta as low as approximately 11%, meaning even if the index rebounds by several hundred points, the warrant response may still fall short of expectations.
Therefore, if you're bullish on a Nasdaq rebound, you don't necessarily need to chase the highest leverage directly. Call warrants with deltas around 50% and strike prices close to the current level typically reflect index movements better than deeply out-of-the-money products.
On the bearish side, there are 15 Nasdaq put warrants and 26 bear certificates. The bear certificates’ call prices are concentrated between 30,000 and 34,000 points, representing distances of approximately 4.85% to 18.83% from the current level, with leverage ranging from 7.6x to 25.1x. If the index breaks below 28,400 points and continues its downtrend, bear certificates with distances of around 5% to 8% are more suitable for short-term momentum plays. However, if your bearish view only extends one to two weeks, put warrants—lacking a knock-out mechanism—offer higher tolerance for timing errors.
However, implied volatility for Nasdaq put warrants already ranges from approximately 30.9% to 47.0%, generally higher than that of call warrants. This indicates the market has already priced in downside risk, so a bearish outlook doesn’t necessarily mean these products are cheap.
S&P 500 $S&P 500 Index (.SPX.US)$ : Underlying stock is relatively stable, but product terms are the most polarized
The S&P Index closed at 7,408.30 points, with a mid-range level around 7,475 points and a lower support zone near 7,339 points. In the short term, it’s testing support between 7,376 and 7,340 points. A break below this zone would shift focus to the 7,250-point area next; conversely, if it reclaims 7,475 points, the recent pullback can still be interpreted as consolidation near highs.
There are only five S&P call warrants available, but their terms fall into two distinct groups:
The first group has strike prices around 7,200 to 7,236 points, about 3.5% to 4% in-the-money, with delta around 73%, effective gearing of approximately 12.6x to 13.9x, and a premium of about 1.8%. Although these products typically have higher unit prices, they offer more complete sensitivity and tracking ability relative to index direction.
The other group has a strike price of 9,000 points, roughly 20% out-of-the-money, with delta only around 6% to 7% and premiums exceeding 20%. While headline gearing can reach 21x to 23x, this does not represent the same risk profile: a modest rebound in the S&P Index may not be sufficient to generate a noticeable price reaction in such deeply out-of-the-money products.
Therefore, for investors positioning for an S&P rebound after holding above 7,340 points, at-the-money or in-the-money call warrants clearly align better with this strategy than the group with a 9,000-point strike price.
There are 14 callable bull contracts, with call prices ranging from 5,800 to 7,200 points. The at-the-money products are approximately 3.1% away from the current index level, offering leverage up to about 17.9x; mid-range products have call distances of roughly 8% to 15%, with median leverage around 6.6x.
The S&P 500 typically exhibits lower intraday volatility than the Nasdaq. A 3% buffer to the call price may not be entirely unusable, but the index is currently near short-term support. If the market experiences another 1%–1.5% drop in a single day, this safety cushion would narrow rapidly. For those aiming to capture a rebound over the next few days, setting call prices around 6,700–6,900 points would offer a more balanced risk-reward profile.
On the bearish side, there are 8 callable bear contracts with call prices ranging from 7,700 to 8,400 points. The nearest tranche is about 3.7% away, with maximum leverage of approximately 32x. These products will react quickly, but if the S&P 500 rebounds by just 2%–3% from its support level, the prices of these high-leverage bear contracts could drop sharply.
Put warrants are generally 10%–20% out-of-the-money, with implied volatility ranging from 26.7% to 36.5%, and most have relatively low delta. Unless a significant decline in the underlying index is anticipated, put warrants may not be more efficient than bear contracts for short-term bearish views lasting just one or two days.
Dow Jones Industrial Average $Dow Jones Industrial Average (.DJI.US)$ : Exhibits the most stable price action, with callable bull/bear contract terms also the easiest to tier.
The Dow Jones closed at 51,711.65 points, with its lower Bollinger Band around 51,646 and short-term RSI at approximately 31. Although the index has declined, it still maintains a relatively intact uptrend structure year-to-date. In the near term, watch whether support near 51,500 holds; resistance lies between 52,300 and 52,500 points.
There are 26 callable bull contracts on the Dow Jones, with call prices ranging from 40,100 to 50,000 points. The closest tranche is about 3.3% away, offering leverage of roughly 18x; products with call prices near 49,000 points are approximately 5% away, providing leverage of about 13–14x; moving further out to call prices between 47,000 and 48,000 points yields leverage of roughly 9–11x.
This distribution is relatively clear:
– To capture an intraday or 1–2 day rebound, consider the tranche with a ~5% buffer to the call price;
– If expecting the Dow to consolidate before testing new highs, a call distance of 7%–10% would be more reasonable;
– Only if there is a very clear bet that the index will hold firmly at 51,500 points should one consider slightly out-of-the-money products with around 3% moneyness.
Regarding call warrants, all strike prices are above 55,000 points, with moneyness ranging from approximately 5.3% to 14.9% out-of-the-money. Their effective gearing is about 17x to 34x, but delta is only around 16% to 24%. The main issue with this batch of products is their high nominal gearing coupled with low sensitivity.
Even if the Dow rebounds by 500 points, the gain would be less than 1%. If an investor uses a call warrant with a strike price of 60,000 points—nearly 15% out-of-the-money—the product may still show limited upside despite correctly predicting the underlying’s direction, due to its low delta and time decay.
In comparison, bull certificates on the Dow have terms closer to the current spot level and allow for easier risk management via knock-out distance.
On the bearish side, 13 bear certificates have knock-out levels ranging from 54,000 to 57,000 points, representing distances of approximately 4.5% to 10.3%, with gearing between 14.6x and 30.9x. The series with the nearest knock-out level at 54,000 points is suitable for short-term downside plays; however, the Dow’s RSI is already approaching oversold territory, so using leverage exceeding 25x at this level requires allowance for potential technical rebounds.
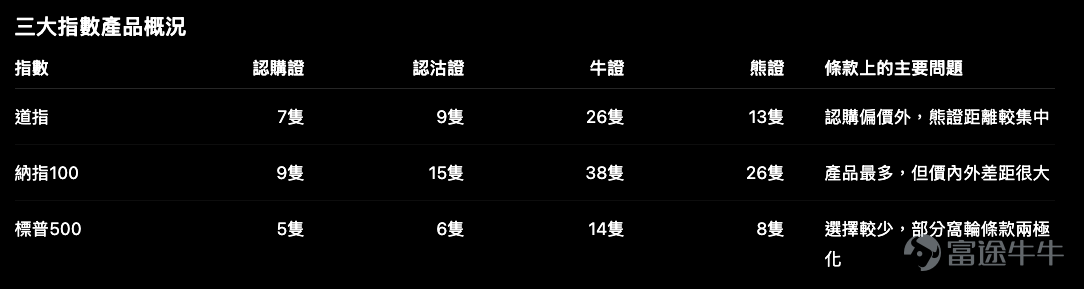
Summary of Index Product Positioning
This time, all three major indices have declined simultaneously—product selection should not be based solely on 'which offers the highest gearing.'
For investors bullish on a rebound:
– For the Nasdaq, priority should be given to comparing near-the-money call warrants with bull certificates featuring knock-out distances of roughly 5% to 8%;
– In the case of the S&P 500, in-the-money call warrants clearly offer better terms than those 20% out-of-the-money;
– Dow Jones call warrants are generally out-of-the-money, whereas bull certificates offer easier control over terms-related risks.
For investors bearish on the market:
– Nasdaq bear certificates offer the most comprehensive product tiers, but put warrant implied volatility is already relatively high;
– S&P 500 bear certificates offer higher leverage, making them more suitable for short-term trades rather than holding positions over time;
– The Dow Jones is already approaching technically oversold territory; chasing bear certificates requires caution against potential rebounds.
The key contradiction to note here is: **the sharper the market decline, the more expensive put warrant implied volatility tends to become; while bear certificates avoid implied volatility issues, they introduce an additional knock-out barrier.** Market direction judgment and product selection remain two distinct considerations.
Risk Disclaimer: The above content only represents the author's view. It does not represent any position or investment advice of Futu. Futu makes no representation or warranty.Read more

Comments
to post a comment
1