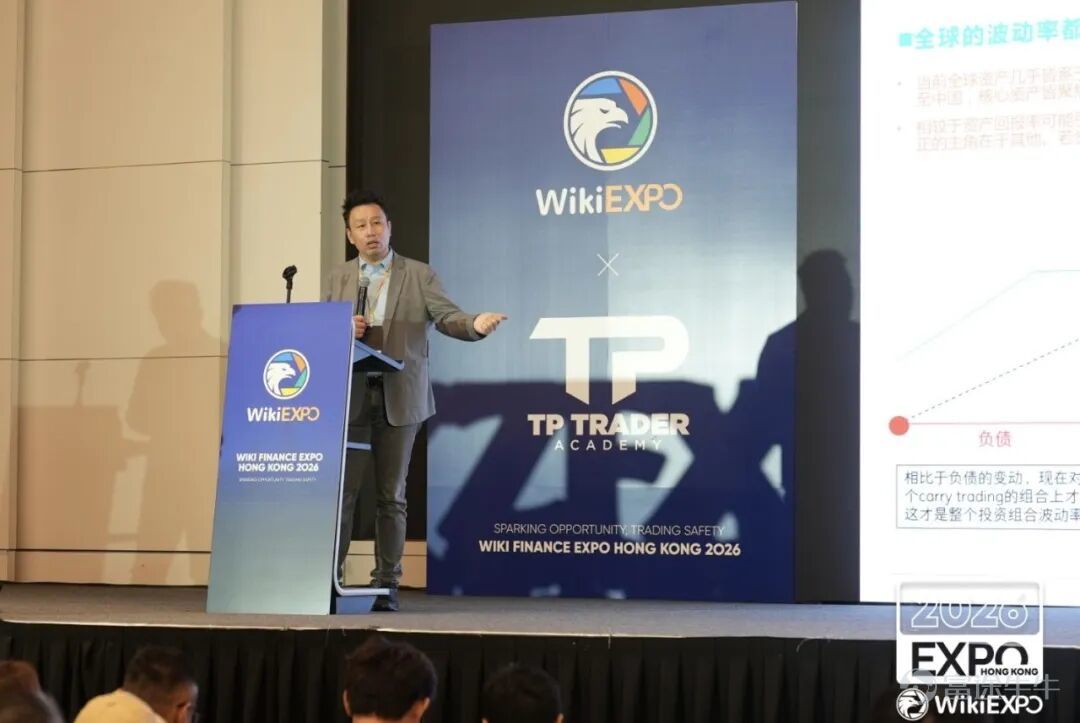

Fu Peng, Chief Economist at Xinhuo Group, in his latest speech: Crypto assets are deeply tied to liquidity, and global asset markets are experiencing heightened divergence amid a 'shrinking circle' trend
Author: Xinhuo Technology
Mr. Fu Peng, Chief Economist of Xinhuo Group, was invited to participate in Wiki Finance EXPO Hong Kong 2026 and delivered a keynote speech. Drawing from a global liquidity framework, Mr. Fu shared his core views on major global asset classes and current market trends, and provided a systematic assessment of the underlying logic of the crypto market.
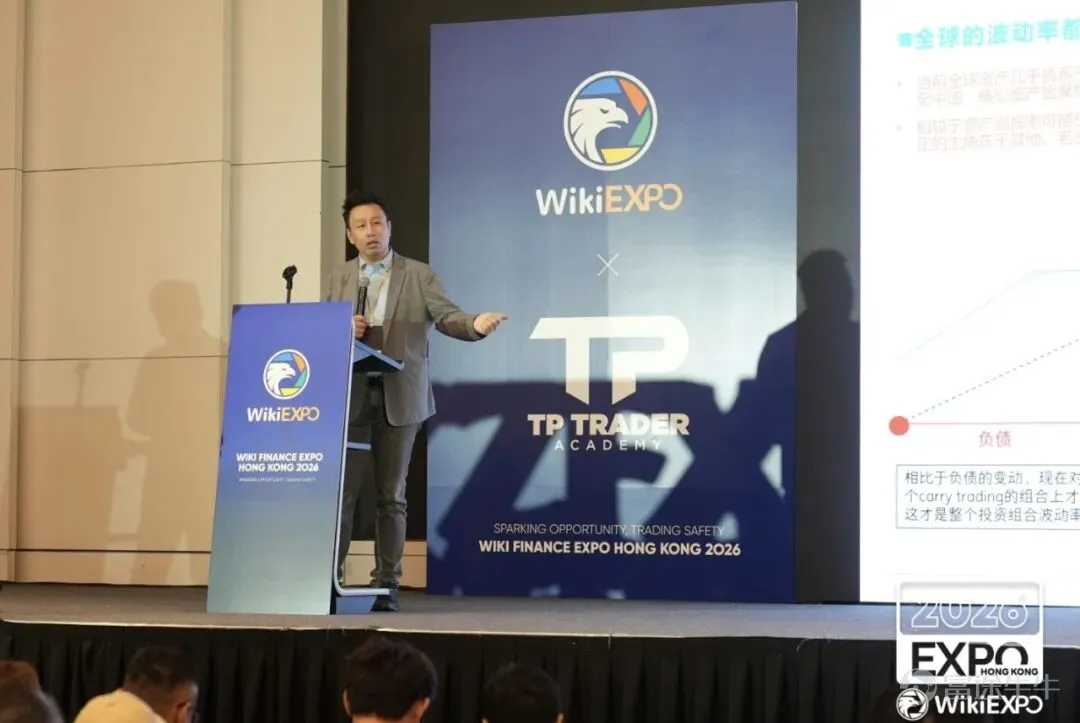
Fu Peng, Chief Economist of Xinhuo Group, delivered a speech at Wiki Finance EXPO Hong Kong 2026
Below is the full transcript of the speech:
Today, I’d like to share with you my perspectives on major global markets across several dimensions. First, let’s start with liquidity. Regardless of asset class—including mainstream crypto assets—everything today is fundamentally tied to global core liquidity.
Following the 2008 financial crisis, global liquidity peaked between 2008 and 2021. Liquidity shouldn’t be judged solely by news headlines about rate hikes or cuts—it operates across three dimensions, which you must keep in mind.
Rate hikes and cuts reflect only changes at the interest rate curve end and do not represent the full liquidity environment.Liquidity observation can be broken down into three components:The volume of water in the pool, the temperature of the water, and the distribution of funding pressure within the pool.The underlying logic can be simply understood as P/Q×G. From a professional perspective, liquidity can be tracked through the interest rate channel,Yield curve, the Federal Reserve’s balance sheet, open market operations, and other angles. However, there’s an even simpler way to observe it: in current traditional trading, Bitcoin and other mainstream crypto assets are widely regarded as leading indicators of liquidity strength or weakness.
Following the pandemic in 2020, the world entered an ultra-loose monetary window characterized by low interest rates and central bank balance sheet expansion. During this easing cycle, global financial assets exhibited a typical pattern: speculative frenzy around low-quality assets.
For example, US equitiesGameStopthe retail-driven short squeeze, and the sharp rallies of numerous worthless cryptocurrencies in the crypto market—all were essentially driven by excessive liquidity. When there’s too much money chasing assets, even the weakest can be pumped up. However, once liquidity begins to contract broadly, markets enter a 'shrinking circle' phase: capital actively differentiates between quality and junk assets, abandoning the latter. This process of deflating bubbles had already begun in the second half of 2021.
From the second half of 2021 through 2022, prime examples included Bitcoin in the crypto market falling from over $70,000 to around $20,000, and NVIDIA’s stock dropping roughly 64–65% for the full year of 2022. This was akin to squeezing water out of a sponge—gradually wringing out market froth.
This year, the true inflection point actually occurred last November. While 2021 marked the peak of central bank balance sheet expansion, year-end last year represented the critical juncture of dual tightening—Balance sheet reductionliquidity withdrawal combined with balance sheet runoff. To simplify: when central banks start draining the pool, funding conditions don’t tighten instantly at the moment quantitative tightening (QT) begins; only after QT progresses to a certain extent does the market genuinely feel the pinch.
In November and December last year, Bitcoin was trading around $110,000. At the time, I even made a bet with Li Lin: over the next year, crypto assets would likely lose more than half their value. If this prediction comes true, it will reaffirm that the fundamental driver of crypto assets is entirely tied to global liquidity conditions.
The key indicator to watch last November was the Federal Reserve’s Standing Repo Facility (SRF) open market operations. This metric signaled that balance sheet runoff had reached a threshold where structural funding stress was emerging in the market. It’s crucial to understand that credit tightening and liquidity contraction don’t mean everyone suddenly lacks cash—funding pressure transmits hierarchically: highly leveraged or weaker entities face funding disruptions first, while top-tier, high-quality players remain well-capitalized. This tiered transmission of liquidity leads capital markets into a 'shrinking circle' dynamic:capital first dumps peripheral, liquidity-sensitive weak assets and progressively concentrates into the most core, highest-certainty assets.
Many retail crypto traders hold a misconception: when the crypto market lacks momentum, all capital shifts to speculate on US equities.This isThis is an extremely retail-investor mindset.Objectively speaking, during liquidity tightening cycles, capital first exits all high-beta, highly speculative assets from portfolios—cryptocurrencies and small-cap thematic stocks are among the first to be reduced.When money is abundant and liquidity is loose, capital is willing to chase all kinds of junk assets; but when liquidity tightens and capital becomes scarce, it concentrates only on core assets with genuine intrinsic value. This is the essence of a 'shrinking circle' market environment.
Since November last year, global capital has continuously flowed into the long-term productivity upgrade theme—namely, the artificial intelligence (AI) sector. The logic behind the AI trade can be analogized to large-scale fixed asset investment; using China’s infrastructure development as an example makes this easier to grasp.
In 2001, the central market theme was China’s large-scale infrastructure construction—the old adage went, 'To get rich, first build roads.' At the time, economists like Justin Yifu Lin and Andy Xie were debating how highway and railway infrastructure could drive economic growth. In 2002, the National People's Congress confirmed the direction for infrastructure development, and by 2003, central government fiscal support and land-related fiscal funding were fully implemented, triggering nationwide road and bridge projects and initiating a prolonged capital expenditure cycle. By 2004, institutional investors’ core holdings centered on upstream infrastructure suppliers like Sany Heavy Industry and Conch Cement—companies providing equipment and raw materials.
This analogy applies perfectly to today’s AI sector; slapping an 'AI' label on it doesn’t alter fundamental industrial dynamics. In the first phase of AI, application launches like ChatGPT spurred corporate willingness to ramp up capital spending. Starting in 2023, global tech firms began concentrating investments in digital infrastructure—specifically, computing power and data center construction. Large-scale digital infrastructure builds will benefit upstream hardware, storage, optical modules, HBM, and related supply chain companies such as Samsung Electronics,SK Hynix, and Taiwan Semiconductor—the modern equivalents of steel rebar, cement, and construction machinery from the infrastructure era. However, Q2 of this year marks a critical inflection point for the entire AI supply chain, coinciding with liquidity contraction—a dual-variable convergence.
Following Google’s earnings release yesterday, seasoned investors clearly recognized that the market narrative dominating the past two to three years has lost validity. From 2023 through 2025, the market rule was simple: if big tech firms increased AI infrastructure investments and expanded capital expenditures, they received high valuations. Yet this quarter, despite continued rapid growth in capital spending disclosed in earnings reports, their stock prices have declined instead.
The core reason is that investors have picked up on a critical data point: all leading companies heavily investing in AI infrastructure have seen their free cash flow drop to zero.The most critical metric in Google's earnings report last night was free cash flow. Many investors are still clinging to outdated logic—believing that as long as capital expenditures keep rising, stock prices will follow—but that era is now over.
The market’s pricing logic has completely shifted: previously, it was about the scale of capital investment,now capital is demanding answers on whether infrastructure spending can generate sustained traffic and revenue sufficient to recoup the investment.Free cash flow hitting zero is a hallmark signal of the transition from Phase One to Phase Two in the AI industry. If companies plan to continue ramping up capital expenditures, they can only do so by raising external capital through equity issuance or bond offerings—both of which carry costs—and investor scrutiny will become extremely stringent.
Here’s a refined tracking metric for everyone: the ratio of capital expenditures (CapEx) to cloud revenue growth. Google’s current ratio stands at approximately 1.9, meaning that for every $1.90 invested in infrastructure, it generates only $1.00 in cloud revenue. This is the core reason why capital markets are unwilling to sustain high valuations.
With the overall funding environment tightening and global capital increasingly concentrating into a select few high-certainty assets—combined with this industry cycle shift—the market is inevitably experiencing sharp risk volatility under this 'narrowing circle' trend.
Using NVIDIA as an example, I’ve mapped out the full industry cycle: 2022 marked the confirmed start of NVIDIA’s industry cycle, when its market cap fell from $1 trillion back to $100 billion. After ChatGPT’s successful launch and explosive adoption, NVIDIA formally entered its value-growth phase. In 2023 and 2024, NVIDIA’s narrative became fully self-reinforcing: consistent earnings growth, fueled by global AI capital spending driving order expansion, propelled its market cap past $1 trillion, then $2 trillion, and then $3 trillion—with extremely low stock price volatility and virtually no risk of deep pullbacks.
However, upon returning from my research trip to Singapore in June 2024, I immediately alerted major financial institutions to the risks: NVIDIA’s business operations, industry supply-demand dynamics, and fundamental industry conditions were all sound—the entire risk stemmed solely from off-exchange financial leverage.
Today’s new generation of Gen Z investors suffers from serious cognitive misconceptions,The belief that stock price movements must perfectly align with fundamentals is entirely wrong!Capital markets price in market expectations, which often significantly lead actual corporate fundamentals.
Take a concrete example: the current industry reality is tight HBM capacity and insufficient supply—a fact confirmed by fundamentals—but this does not imply that stock prices will keep rising indefinitely.This is a classic cognitive bias: financial reports and production capacity reflect present realities, whereas stock prices trade on future expectations. Fundamental data lags significantly behind market pricing—a lesson from my more than twenty years of hands-on experience.
In July 2024, NVIDIA’s stock plunged 20% in just a few trading sessions, while Japanese equities dropped 10% in a single day. At the time, numerous analysts attributed the decline to the Bank of Japan’s rate hike and unwinding of yen carry trades—but these were merely surface-level explanations.The underlying truth is: global capital had concentrated into a handful of highly certain assets. Extreme certainty breeds extreme greed, which directly manifests as investors aggressively leveraging their positions.
Consider a simple trading analogy: imagine we’re playing cards—you hold a 6, I hold a 5, and you clearly know your hand is stronger. An average retail investor would go all-in, but a skilled trader would deploy maximum leverage and bet their entire position.Remember this core insight: certainty breeds greed, and everything has two sides; the operational response to greed is adding leverage.The market unanimously expects NVIDIA to have ample long-term orders, so traders instinctively keep adding leverage to magnify returns—that’s simply trader behavior.Once leverage accumulates to a critical threshold, it will inevitably trigger violent volatility and a rapid decline.
The current market is replaying a similar pattern: certain memory chip stocks—facing no sector-specific headwinds, with stable operations, strong order backlogs, and steadily growing earnings—are still experiencing frequent and sharp price drops. Many young traders in the Korean market saw substantial gains one day, only to suffer significant losses the next. The root cause lies neither with Samsung nor SK Hynix, nor with supply-demand dynamics in the HBM supply chain.The core issue is excessive leverage buildup within the market.
The underlying logic is identical to NVIDIA’s flash crash in July 2024:High-certainty assets fuel leverage-driven bubbles, and once leverage hits its critical limit, a collapse becomes inevitable—there is no such thing as a permanently sustainable leveraged rally.Here’s a simple risk indicator for everyone: when recent graduates with no practical trading experience commit all their capital to leveraged, all-in bets on Samsung or SK Hynix, it signals that risk is imminent.When a once-niche, specialized segment suddenly attracts a flood of speculative retail investors, a bubble burst becomes only a matter of time.In recent years, markets have remained in a persistent monetary tightening cycle. Everyone clearly recognizes a handful of high-certainty core assets, but the real risk does not lie in industry fundamentals—it lurks in liquidity and leverage dynamics, which demands heightened vigilance.
The market has now reached the key inflection point of AI’s first phase: the narrative driven purely by capital expenditure expansion has run its course, and significant volatility along with valuation corrections are expected.Our overall outlook for US equities this year is that even sideways consolidation in major indices would constitute an optimistic scenario.Some may counter that after the sharp US market decline in March, it rebounded again in May and June. But it’s crucial to recognize that the May–June rally was an extreme example of structural market behavior—only a tiny handful of stocks drove the index higher, while the vast majority continued to drift lower. The A-share market has exhibited exactly the same structure over the past year: 55% of stocks are trading below their levels seen when the Shanghai Composite was at 3,000 points, with the index propped up almost entirely by a few leading names in the AI sector.
To summarize the current market environment: liquidity is tightening, market divergence has reached an extreme, and the AI industry cycle is at a critical inflection point. Let me reiterate: the long-term growth thesis for the AI industry remains intact—productivity upgrades are the clear central theme—but investors should not blindly hold positions indefinitely. Instead, they must adopt a full-cycle industry perspective and implement a phased investment strategy.
I’ve built a comprehensive five-layer analytical framework:Industry layer, economic layer, inflation layer, liquidity layer, and market layer.At this moment, there’s no need to devote significant effort to dissecting the economic layer; the core focus should be on the industry, liquidity, and market layers, as the weight of macroeconomic analysis has declined substantially. Someone might ask whether deep analysis of the US economy is still necessary—the answer is absolutely not. The reason is straightforward: US corporations are engaged in sustained, large-scale capital expenditure expansion, and US households completed deleveraging as early as 2008. In other words, there’s no need to scrutinize high-frequency economic data—the defining characteristic of the US economy today can be summed up in two words: resilience.
At the market level, artificial intelligence is the sole dominant theme globally—the only core investment logic driving capital flows worldwide. Looking across all globally allocable assets, the only markets with meaningful future potential areJapan, South Korea, Taiwan, mainland China, and the United States, with all other regions offering minimal allocation value. Within Europe, only ASML Holding warrants attention; other assets lack meaningful investment merit.
Consider two questions: Is the current performance of South Korea’s stock market linked to its domestic real economy? Not at all. Similarly, is Japan’s stock market tied to its domestic economic conditions? Again, no. A closer look reveals that the core holdings in Japan’s equity market are all upstream equipment suppliers in the AI supply chain. While market attention often centers on Samsung and SK Hynix, the key production equipment these companies purchase comes primarily from Japanese firms—illustrating a fully integrated upstream–downstream AI ecosystem. In Taiwan, the only core investable asset is Taiwan Semiconductor; there are no other regionally based companies with significant allocation value in core industries.
The entire AI sector is fundamentally a productivity-driven industrial investment, operating according to fixed cyclical patterns. Let me state the core conclusion clearly: the point in Q2 when major tech companies' free cash flow hits zero will mark a significant market inflection point. Before and after this turning point, the market’s entire asset pricing logic will completely reverse—this is absolutely critical to remember.
The AI industry chain is divided into upstream, midstream, and downstream segments, with each segment having its own independent industrial life cycle, clear sector rotation dynamics, and well-defined allocation windows.Do not treat AI as a blind faith or hold positions indefinitely; purely speculating on AI-related concepts will inevitably lead to losses.Many people ask me if I’m bearish on AI, but this question itself contains a logical flaw. Over the past decade, the market has reached consensus: artificial intelligence is the core driver of next-generation productivity—there is no debate on this point.Being bullish on the sector does not mean blindly holding any single asset at all times.NVIDIA, as a core upstream hardware play, has already completed its high-growth phase and will enter a mature blue-chip stage starting in 2025, which explains why its share price gains have significantly narrowed from last year through this year. It won’t be long before Samsung and SK Hynix also enter their maturity phases, leading to an overall slowdown in upstream hardware growth, with momentum gradually shifting toward downstream segments.
Full AI industry cycle timing forecast: upstream hardware led the market in 2022; software-layer valuations will undergo digestion and restructuring by 2026; and terminal application-layer valuations will adjust and be repriced around 2030.The full AI industrial supercycle spans roughly 20 to 25 years. We’ve already completed the first 10 years, dominated by upstream hardware infrastructure; the next decade will be driven by terminal applications.
However, there is currently a cyclical gap, and the next 10 to 18 months represent a critical transition window. During this period, avoid going all-in—strictly follow industrial cycle dynamics and deploy capital in stages to mitigate significant volatility risk. Here’s a key distinction: AI coding tools and development aids viewed from a programmer’s perspective belong to the supporting tool layer of the industry, not the terminal application layer—the valuation logic between these two is vastly different.
Finally, I’ll return to the dimension of liquidity—a core variable highly relevant to crypto assets. Why is the new Federal Reserve Chair, Karen Worshe, a critical signal? His appointment marks the definitive rewriting of the central bank policy framework originally established by Ben Bernanke after the 2008 financial crisis.
I wrote an analytical note in January: this personnel change signifies a return of central bank policy to its pre-2008 trajectory. To briefly outline the policy backdrop: the 2008 financial crisis exposed massive systemic financial risks. Policymakers drew lessons from the 1929 Great Depression—namely, that leaving markets entirely to their own devices meant they couldn’t stabilize themselves during crises. Consequently, Keynesian stimulus policies were widely implemented globally after 2008.
Both Bernanke and Yellen, as successive Fed chairs, adhered to the same core principle: in the wake of a financial crisis, central banks must intervene to support and stabilize markets. Yet every policy has two sides—much like leverage in investing. Leverage can rapidly amplify gains but can also instantly wipe out an account. Central bank interventions can swiftly calm market panic and prevent another Great Depression, but prolonged, unconditional market backstops foster speculative behavior and inflate large-scale asset bubbles.
There’s a professional term in markets called"the Fed put": whenever markets decline, investors feel confident buying indiscriminately, betting that the central bank will inevitably step in to rescue markets. When the market develops a unified expectation—that profits accrue to investors while losses are absorbed by the central bank—all financial assets become severely overvalued.
The central message of all of Karen Worshe’s public speeches can be distilled into one sentence: central banks will only fulfill their legally mandated responsibilities.The Fed’s two core statutory mandates are maximum employment and price stability,and it will not routinely backstop equity markets. With ongoing technological progress and steadily rising productivity, the central bank now has the conditions necessary to exit its long-standing market backstop regime.
This can be likened to family education: once children enter high school and develop independent survival skills, parents shouldn't micromanage everything, as this fosters dependency. Since Chair Karen took office, many market participants have misinterpreted her stance as signaling expectations of rate cuts and balance sheet reduction. However, the core focus is actually on balance sheet runoff, which has limited correlation with short-term interest rate movements. The central issue is how to execute quantitative tightening in an orderly manner and return the central bank’s role to its pre-2008 standard positioning.
This marks the definitive end of the largest global liquidity expansion cycle in human history, which spanned from 2008 until Chair Karen assumed office over a decade later.Therefore, everyone should abandon any illusions: the next five to ten years will not replicate the broad-based, asset-wide rally seen between 2008 and 2026, characterized by massive liquidity injections across all sectors.Capital will flow back into genuinely high-quality core assets with long-term value. This represents a pivotal turning point at the liquidity level and will fundamentally reshape everyone's investment strategies.The investment logic is shifting from the previous approach of broadly diversified allocations—where all asset classes rose in tandem—to a more concentrated focus on a select few high-quality core holdings.
The crypto market is undergoing a similar transformation. Many traders have already observed that Bitcoin and Ethereum’s market capitalizations are gradually stabilizing, volatility continues to decline, market liquidity is becoming more stable, and institutional players are increasingly dominating participation. These characteristics are typical hallmarks of core assets that have survived the post-bubble shakeout.The narrative logic that previously fueled speculative trading in low-fundamental or 'air' cryptocurrencies has now completely lost relevance.
Liquidity is the top-tier, most fundamental driver affecting all financial assets. This year, everyone must thoroughly internalize this analytical framework. Once you layer industry and company fundamentals onto this liquidity foundation, your analysis of various asset classes will become significantly clearer. Due to time constraints in today’s session, I won’t be able to unpack each layer of my five-tier analytical framework in detail.
I’d much rather exchange views with you all on foundational principles and analytical methodologies. Once you’ve clarified these core thought processes, short-term market noise and micro-fluctuations won’t cause unnecessary anxiety. That concludes my presentation—I hope it offered some valuable insights. Thank you all.
Risk Disclaimer: The above content only represents the author's view. It does not represent any position or investment advice of Futu. Futu makes no representation or warranty.Read more

Comment (1)
to post a comment
1
3