
標普納指保持漲勢,你是多頭還是空軍?

US Equity Indices | The three major indices remain consolidating at elevated levels; selecting bull/bear certificates shouldn't rely solely on leverage magnitude
A common feature of the three major US equity indices recently is that their intermediate-term uptrend remains intact, but in the short term, they have shifted from a one-sided rally to choppy consolidation at high levels.
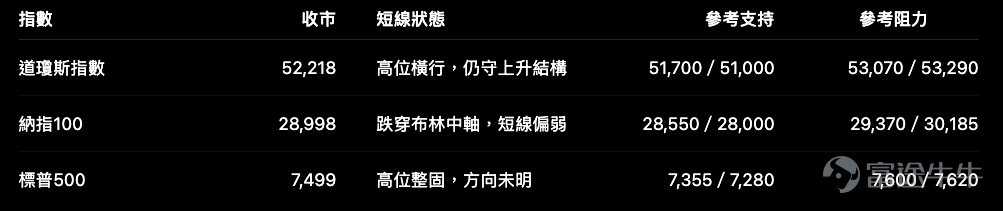
As of July 22, the Dow Jones Industrial Average stood at $Dow Jones Industrial Average (.DJI.US)$ closed at 52,218 points, the Nasdaq-100 $NASDAQ 100 Index (.NDX.US)$ was at 28,998 points, S&P 500 Index $S&P 500 Index (.SPX.US)$ was at 7,499 pointsAmong the three, the Dow Jones has shown relatively stable movement; the Nasdaq exhibits weaker short-term momentum; while the S&P 500 remains around the middle of its recent high range.
We believe everyone has their own analysis and directional outlook on the U.S. equity market. Here, we’d like to address another key question:Once the market direction is clear, which terms of Hong Kong-listed U.S. index warrants and callable bull/bear certificates (CBBCs) truly suit current market conditions?
First, consider the technical positioning: the indices have not turned bearish yet, but the room for further upside is narrowing.
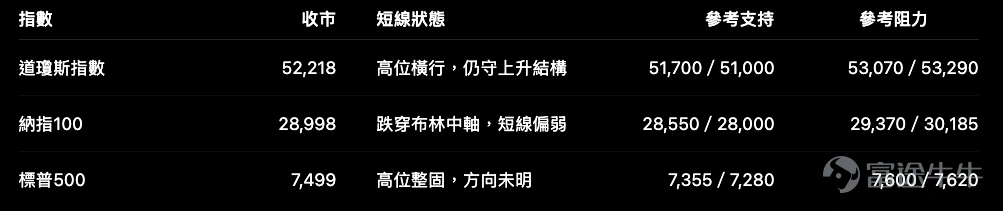
The Dow is currently hovering near the Bollinger Band midline at approximately 52,372 points, and its RSI has not reached extreme levels—suggesting a consolidation phase following recent gains. The Nasdaq has already fallen below its Bollinger Band midline of 29,369 points; it needs to first reclaim the 29,300–29,400 range for its uptrend to resume smoothly. The S&P 500 remains between its Bollinger Band midline at 7,485 points and upper band at 7,614 points, showing no clear breakout direction for now.
This market environment has a direct implication for product selection:It is unwise to choose CBBCs with knock-out levels closest to the current price solely because they offer higher leverage.
Bullish on indices: plenty of bull warrants are available, but those closest to the call price may not be suitable for overnight holding.
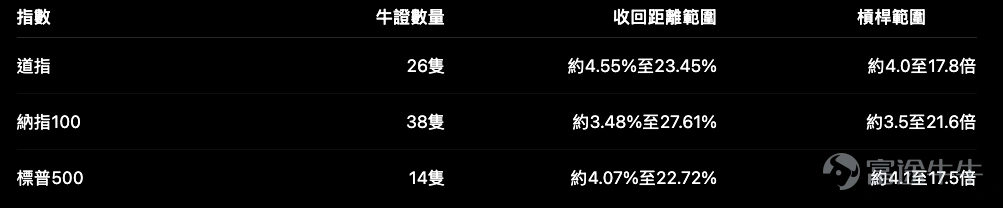
For traders bullish on a short-term rebound in the three major indices, product availability isn’t an issue—the real challenge lies in managing the distance to the call price.
Nasdaq bull warrants: the key risk to guard against is 'being right on direction but having the warrant called early.'
The most tightly priced Nasdaq bull warrants have a call price about 3.48% away from current levels, with leverage potentially exceeding 20x. These products are indeed the most sensitive to a Nasdaq rebound, but the Nasdaq itself also exhibits the highest volatility among the three major indices.
The lower Bollinger Band for the Nasdaq is currently around 28,552, just about 1.5% below the index level. In other words, normal market fluctuations alone could easily push the index toward that lower band again in the short term. If a bull warrant’s buffer to its call price is only 3%–4%, even if you remain bullish over the medium term, you could face significant early-call risk before any rebound materializes.
A more balanced approach to consider:
– Distance to knock-in around 6% to 10%
– Leverage around 8x to 14x
– There's no need to pursue the highest leverage
– If positioning during Hong Kong market hours and planning to hold into the U.S. market open, especially account for overnight gap risk
If purely aiming to capture a rebound in futures during Hong Kong trading hours, at-the-money bull certificates still serve a trading purpose; however, if the holding period exceeds one day, the call price should not be too close to the 28,000 level.
Dow Jones bull certificates: Lower volatility allows for slightly higher leverage
Dow Jones bull certificates have knock-in distances starting from 4.55%, with maximum leverage around 17.8x. Given the Dow’s relatively stable recent performance, short-term bull certificates can be slightly closer to the spot price than Nasdaq ones, though this does not mean a 4%–5% distance is entirely safe.
The Dow Jones is currently near its Bollinger Band lower band at approximately 51,675, while the current price is around 52,218—less than 1,000 points apart. If it retests recent support levels, price volatility of at-the-money bull certificates will increase significantly.
For those bullish on the Dow continuing its upward trend, consider a knock-in distance of approximately 6% to 9%, with leverage of approximately 10x to 14x for the mid-tier group. These products still maintain a certain level of sensitivity while not relying entirely on intraday market gains.
S&P Bull Certificates: Terms fall between those of Dow and Nasdaq
The closest knock-in distance for S&P bull certificates is approximately 4.07%, with maximum leverage around 17.5x. The S&P itself exhibits lower volatility than the Nasdaq, but is currently near historical highs, resulting in relatively balanced short-term upside potential and pullback risk.
If the index has not yet broken through the 7,600–7,620 level, choosing bull certificates with a knock-in distance of approximately 6% to 10% would be more reasonable. Products with very tight knock-in levels are better suited for investors who have clear intraday entry and stop-loss strategies, rather than those simply holding based on a long-term bullish view on US equities.
Bearish on the index: Bear certificates offer higher leverage, but their knock-in prices are generally clustered around key resistance zones above.
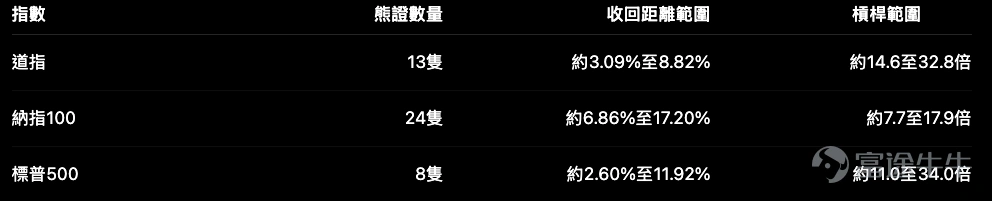
For bear warrants, the most tightly priced products on the Dow Jones and S&P indices can offer leverage of over 30x. While these figures look attractive, what truly deserves attention is:The call price is very likely to sit exactly at a level the index could normally rebound to.
S&P Bear Warrants: 2.6% knock-in distance is very close to key resistance near recent highs
The tightest S&P bear warrants have a knock-in distance of only about 2.6%, with the lowest knock-in level around the 7,700 mark. Technically, the S&P’s recent high was around 7,620 points; if the market breaks above this high and extends its gains, 7,700 is not an unreachable target.
Therefore, even if you are bearish on the S&P, you shouldn’t focus solely on 34x leverage. A more conservative warrant should place the knock-in price above 7,900 points, or at least maintain a buffer of approximately 5% to 8% to avoid being forcibly called away by a single breakout move.
Dow Jones Bear Warrants: High leverage comes with very limited room for error
The tightest Dow Jones bear warrants have a knock-in price around 54,000 points, roughly 3.09% away from current levels. The Dow’s recent high was approximately 53,289 points—once that level is breached, 54,000 is only another 1.3% higher.
Thus, ~30x leveraged bear warrants are better suited for very short-term contrarian trades and should not be used as medium-term bearish instruments. If you believe the Dow is merely consolidating at elevated levels rather than heading for an imminent sharp decline, choosing bear warrants with knock-in prices around 55,000–56,000 points (roughly 5%–7% away) would offer more reasonable terms.
Nasdaq Bear Warrants: Strike distance is relatively far, but leverage is comparatively moderate
The minimum knock-in distance for Nasdaq bear warrants is approximately 6.86%, notably wider than that of Dow Jones and S&P bear warrants, with maximum leverage only around 17.9x.
This actually makes overnight positioning in Nasdaq bear warrants easier to manage. The Nasdaq itself is highly volatile; if the knock-in level were set just above 30,000 points, it could easily be triggered during sharp tech stock rallies. Currently, bear warrants have knock-in levels starting from 31,000 points, which better accommodates normal rebounds.
For those bearish on the Nasdaq, it’s not necessary to chase the closest-to-the-money products; bear warrants with knock-in levels around 31,500 to 32,500 points and leverage of roughly 10x to 15x may be more suitable for multi-day strategies than extremely high-leverage instruments.
Index Warrants: No knock-in risk, but moneyness and time decay vary significantly
The terms of warrants across the three major indices are not evenly distributed.
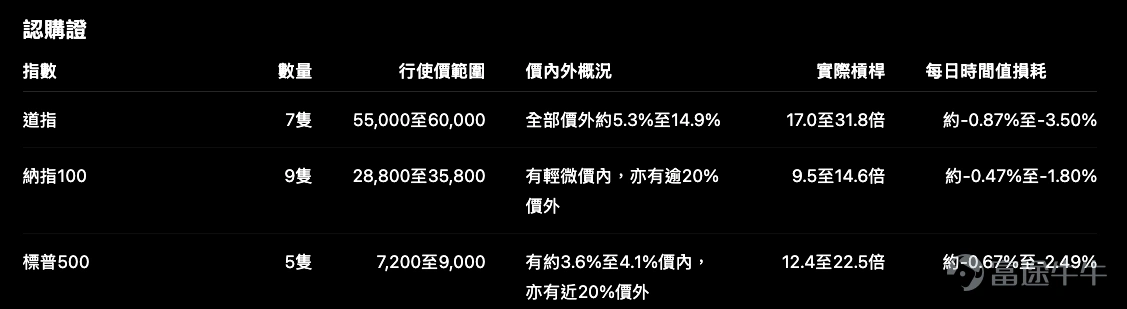
Among call warrants, Nasdaq and S&P offer slightly in-the-money products with relatively practical terms; Dow Jones call warrants are all out-of-the-money, requiring a faster pace of index appreciation.
If you're bullish but wish to avoid the knock-in risk of bull warrants, Nasdaq and S&P warrants should be prioritized:
– Slightly in-the-money to approximately 5% out-of-the-money
– Delta around 40% to 70%
– Daily time decay kept below approximately 1%
– December-expiry products offer more time cushion compared to September-expiry products
The Dow Jones call warrants have the highest effective gearing of nearly 32x, but their delta is only around 16% to 25%, indicating that although the warrant prices are low, their ability to closely track the index is relatively limited. If the index merely rises slowly or trades sideways, time decay will be more pronounced.
Put warrant
Put warrants on the three major indices are generally more out-of-the-money (OTM) than call warrants:
– All Dow Jones put warrants are OTM by approximately 8% to 22%
– Nasdaq put warrants range from near-the-money to more than 26% OTM
– All S&P put warrants are OTM by approximately 11% to 21%
Among them, the Nasdaq offers near-the-money put warrants with the highest delta of about 41%, making them more responsive to index declines compared to deeply OTM products. In contrast, S&P and Dow Jones put warrants generally have low deltas, with some products exhibiting single-digit percentages, thus relying heavily on sharp short-term drops.
Therefore, when bearish on the three major indices:
– OTM put warrants can be used for short-term sharp decline plays, but higher time decay must be accepted
– For multi-day positioning, Nasdaq-linked put warrants closer to at-the-money offer more comprehensive terms.
– For the Dow and S&P, if there are no near at-the-money put warrants available, bear certificates may be a more straightforward choice, but the knock-out buffer must be carefully managed.
Core trade-offs in index-linked products
Currently, among the three major index-linked products, the one with the highest leverage isn’t automatically the best choice.
– NasdaqThe index exhibits the highest volatility; bull certificates should have a wider knock-out buffer, while for bearish views, consider near at-the-money put warrants or bear certificates with a more distant knock-out level.
– Dow Jones Industrial AverageThe index trend is relatively stable, but all call warrants are out-of-the-money. If bullish, bull certificates typically offer more direct price sensitivity than out-of-the-money calls.
– S&PThe index is trading in a high range; the tightest-priced bull and bear certificates on both sides are highly susceptible to breakout moves—terms should not be pushed too aggressively.
Being right on the index direction is only the first step. In actual trading,direction, holding period, and product tolerance (knock-out buffer) must align,otherwise, even if the index ultimately moves as expected, the product may fail to deliver the anticipated outcome due to early knock-out or time decay.
Risk Disclaimer: The above content only represents the author's view. It does not represent any position or investment advice of Futu. Futu makes no representation or warranty.Read more


Comments
to post a comment
2
1