
Tesla plunged after its earnings report—what’s the outlook ahead?

Bull Bull Technical Intelligence | Tesla slides ahead of earnings—where is the next key support level?
$Tesla (TSLA.US)$ scheduled forafter-market release on July 22 of its second-quarter 2026 earnings report.The market holds relatively high expectations for this quarter. On the eve of the earnings announcement, Morgan Stanley noted that Tesla delivered strong vehicle and energy storage volumes in Q2, suggesting solid fundamentals, and raised its price target to $417. Meanwhile, Wells Fargo & Co also lifted its price target but cautioned that if Tesla’s results fall short of expectations, the stock could face significant downside risk,highlighting persistent divergence between bulls and bears.
From a sentiment perspective, implied volatility (IV) of pre-earnings options has risen notably, intensifying the tug-of-war between bullish and bearish traders. Analysts are broadly focusing their attention onthe commercialization progress of Robotaxi, production ramp-up of the Optimus robot, and the growth rate of energy storage business;Vehicle delivery figures serve only as a basic validation metric,Whether the physical AI business can meet expectations will be the key variable determining market sentiment.
Below, we will analyze Tesla's current price structure and key levels from a technical perspective, incorporating recent candlestick patterns.
Recent stock price movement

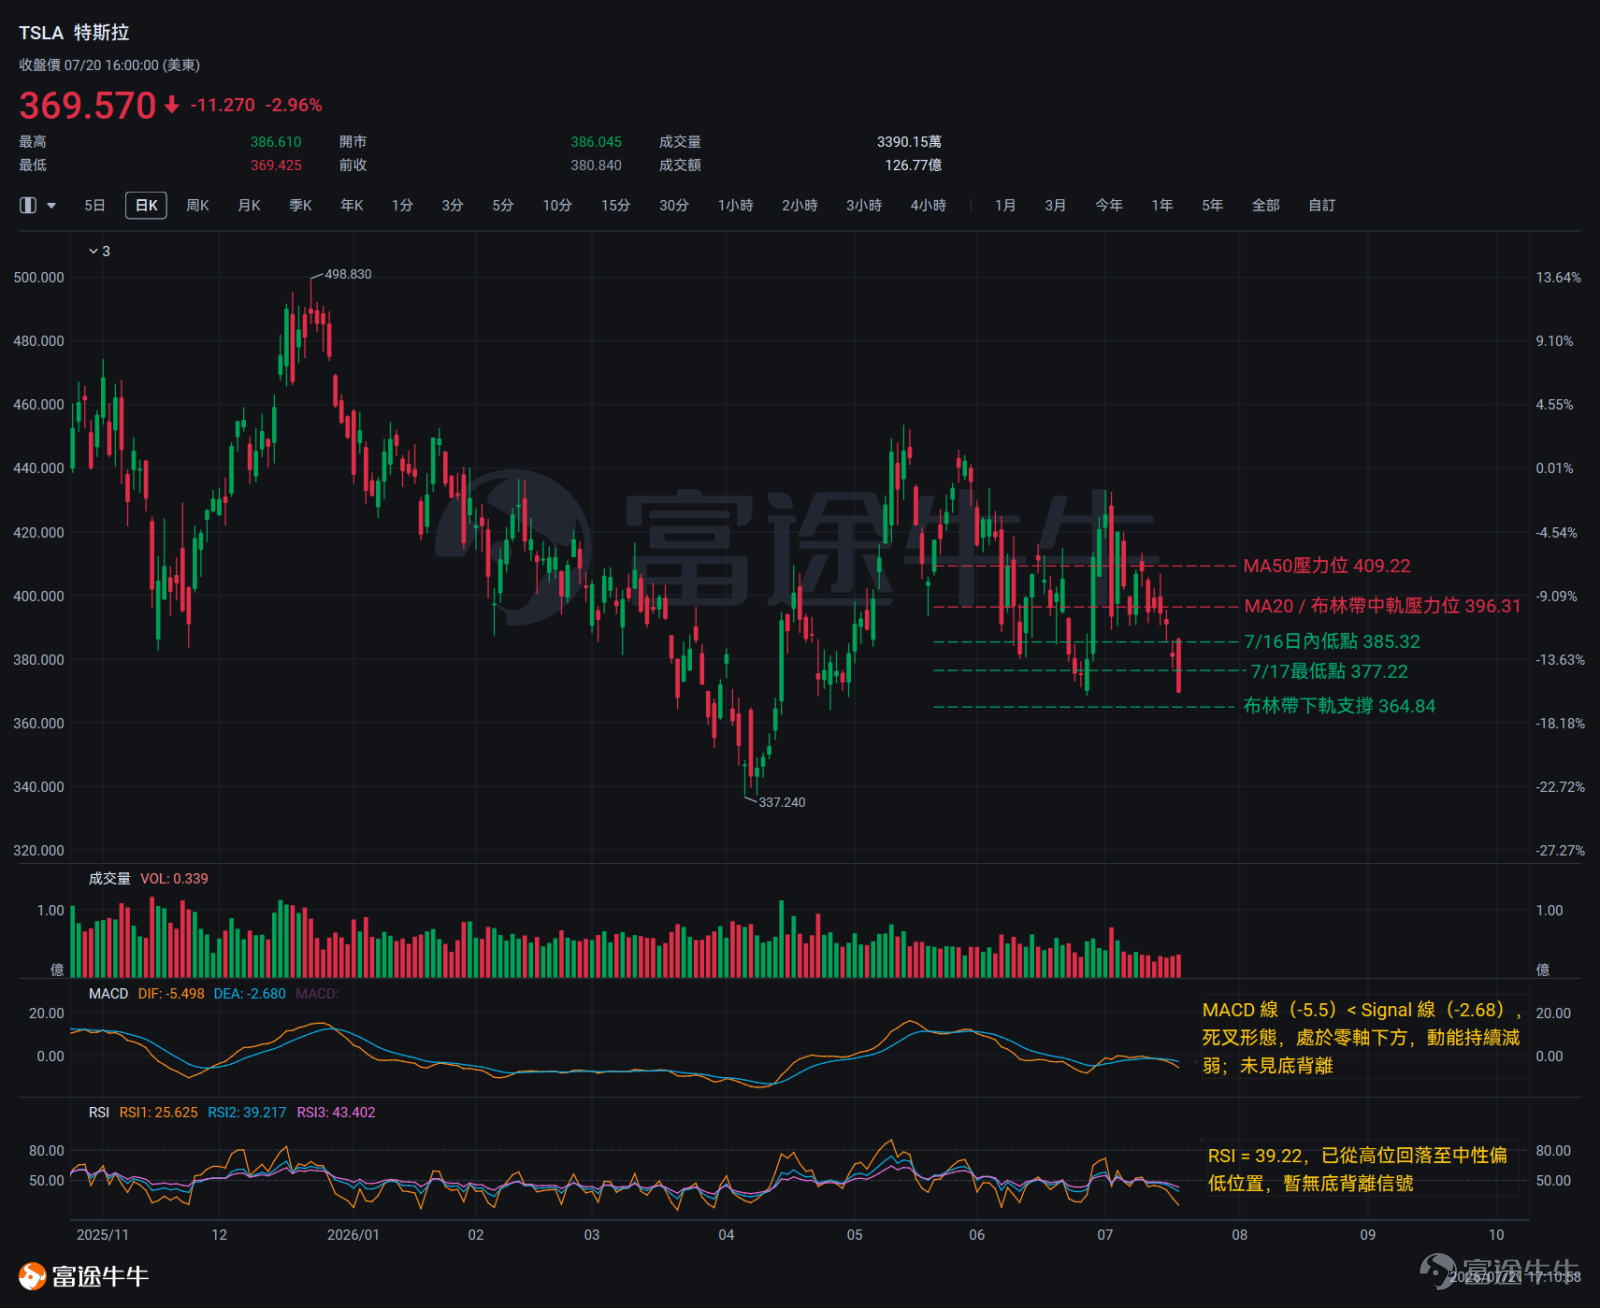
Recent technical indicators show a rather typicalsustained bearish trend.In terms of trend direction, the candlestick pattern over the past 10 trading days has consisted primarily of 9 down days and 1 up day. The price has gradually declined from a recent high near $402.90 to $369.57, representing a cumulative drop of approximately 8.3%. The current share price is trading below both the 20-day moving average (MA20) at $396.31 and the 50-day moving average (MA50) at $409.22, with the two moving averages maintaining a bearish alignment,confirming short-term downside momentum at the moving average level.
From the Bollinger Bands perspective, the price is positioned between the middle band ($396.31) and the lower band ($364.84), clearly leaning toward the lower band. Recent volatility is increasing,indicating that the downtrend remains in an active phase of energy release.
Further observation from a candlestick pattern standpoint reveals seven consecutive down candles between July 13 and July 20. Among these, the candles on July 13, 14, and 15 each closed lower than the previous day, successively establishing new lows—confirming sustained bearish dominance following the formation of the recent peak.
On July 20, the stock opened at $386.05, briefly reached an intraday high of $386.61, but ultimately closed near the day’s low at approximately $369.57, forming an upper shadow of about $17. This pattern—characterized by a higher open, a brief intraday rebound, and a complete retracement of gains—is typically bearish when it appears during an ongoing downtrend, suggesting further downside continuation. Notably, a relatively strong bullish candle formed on July 9 (closing at $406.55), which carried potential bullish reversal implications, but this was subsequently negated by consecutive bearish candles starting from July 10.
Overall, the current candlestick structure reinforces the prevailing downtrend, and the short-term bearish dominance shows no clear signs of weakening.
Key Technical Indicator Analysis
Moving Averages (MA):The 20-day moving average (MA20) is at $396.31, and the 50-day moving average (MA50) is at $409.22. The price is trading below both moving averages, and MA20 is below MA50, indicating a bearish alignment and a weak trend.
RSI:The current RSI reading is 39.22, situated in the neutral zone and having declined from higher levels to a relatively low-neutral position, though it has not yet entered oversold territory. Over the past 10 days, prices have consistently made new lows, with RSI trending downward in tandem, showing no sign of bullish divergence.
MACD:The MACD line (-5.5) is below the Signal line (-2.68), confirming a bearish crossover. Both lines are below the zero axis, indicating weakening bearish momentum, with no bullish divergence observed.
Bollinger Bands:The price is trading between the middle Bollinger Band ($396.31) and the lower band ($364.84), closer to the lower band. The Bollinger Band width is 62.93, reflecting relatively expanded bands and elevated recent volatility, suggesting that the downtrend continues to release energy.
Comprehensive assessment
The most immediate support level to watch isthe July 20 closing price of $369.57,which also marks the lowest closing level over the past 10 trading sessions. A break below this level would further confirm the current bearish momentum and warrant attention for potential accelerated downside movement. Deeper support lies atthe lower Bollinger Band at $364.84.This level represents the last clearly defined technical support zone at present;Should price break below this area, the magnitude of downside risk would escalate significantly, warranting attention to the possibility of accelerated downward movement.
Resistance levels, in ascending order, are as follows:$385.32 (the intraday low on July 16, which flipped to become the first near-term resistance after being breached), $391.06 (the closing price on July 16, serving as a higher-level recovery reference), and the most critical resistance cluster in the current phase at $396.31—this is where the 20-day moving average (MA20) overlaps with the middle Bollinger Band, creating dual technical resistance at the same level. If the stock price rebounds to this zone without clear, supportive volume, it is highly unlikely to achieve a valid breakout. This level serves as a key test point to determine whether bears remain in control. Should the stock price manage tobreak above $396.31 on strong volume, the next target would be the 50-day moving average (MA50) at $409.22.

Risk Disclaimer: The above content only represents the author's view. It does not represent any position or investment advice of Futu. Futu makes no representation or warranty.Read more


Comments
to post a comment
13
11