English
Back
Open Account
Bessent interprets signals from US-Iran talks, oil prices plunge

Futubull Options Sir
joined discussion · Jul 20 17:36 ·

Hormuz Standoff and Soaring Oil Prices: Will the June CPI Relief Be Wiped Out?

US CPI declined by 0.4% month-over-month in June, marking its first monthly drop in about six years,bringing the year-over-year rate down to 3.5%, while core CPI fell to 2.6% YoY. The energy component plummeted 5.7% MoM,initially reinforcing market expectations that inflation had entered a downward trajectory and weakening rate hike expectations.
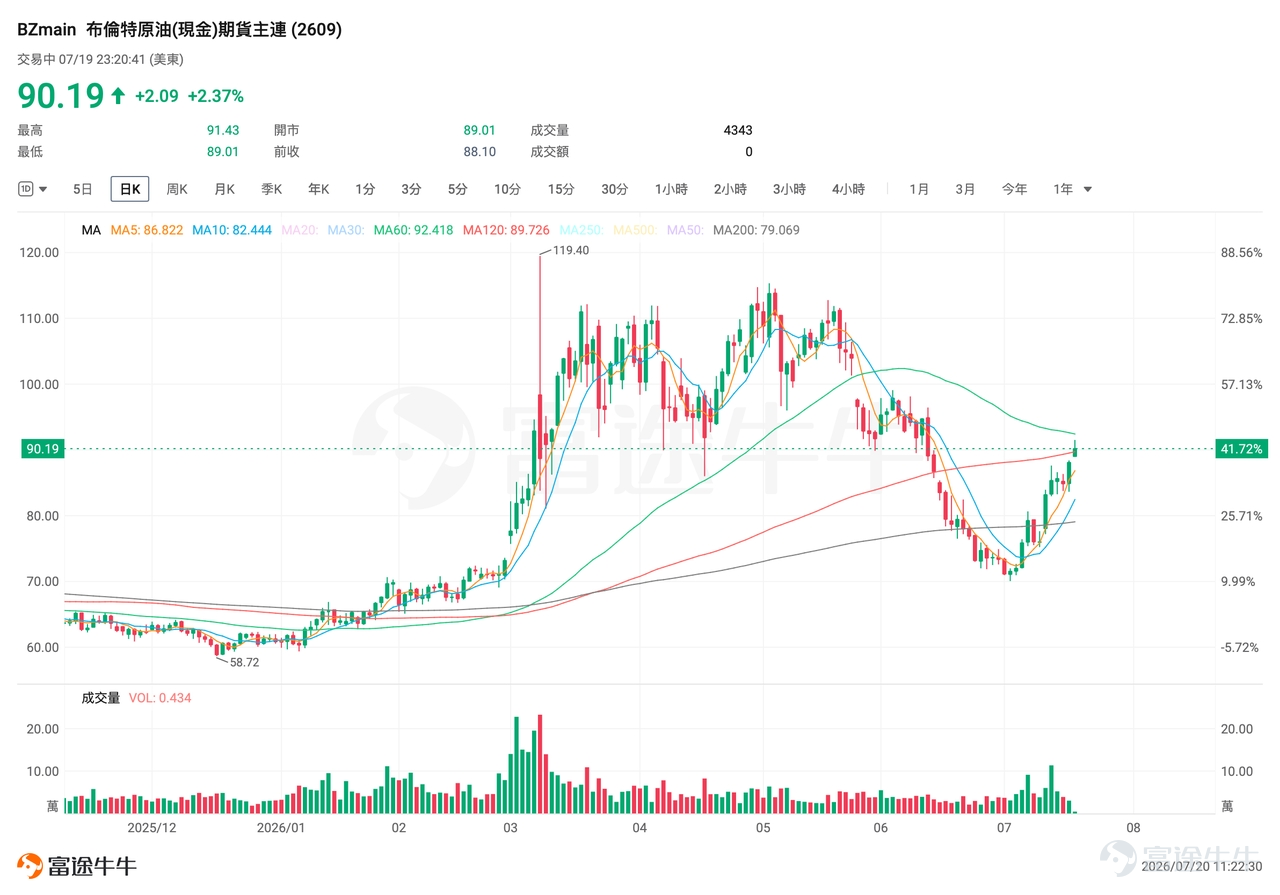
However, after Iran announced the closure of the Strait of Hormuz on July 12, geopolitical risk premiums quickly returned. Brent crude oil rebounded strongly from a low near $70 per barrel, surging more than 15% in a single week,As of this writing, Brent crude futures have surpassed $90 per barrel, posting a cumulative gain of 27% since early July.
U.S. CPI fell 0.4% month-over-month in June, marking its first monthly decline in about six years, bringing the year-over-year rate down to 3.5%, while core CPI declined to 2.6% YoY. The energy component plunged 5.7% month-over-month,temporarily reinforcing market expectations that inflation had entered a downtrend and weakening expectations for further rate hikes. However, after Iran announced the closure of the Strait of Hormuz on July 12, geopolitical risk premiums quickly returned. Brent crude oil rebounded strongly from a low near $70 per barrel, surging more than 15% in a single week,As of this writing, Brent crude futures have breached $90 per barrel, posting a cumulative gain of 27% since early July. I. Institutional Consensus: Short-Term Spike Amid Medium-Term Decline Compared with the initial Strait closure at the end of February, the most fundamental change in today’s market is that global oil inventory buffers have been significantly depleted.CICC noted that by the end of Q2, OECD oil inventories had deviated further below their five-year seasonal average—widening from approximately -1% at the end of February to around -8%. Nearly 300 million barrels were drawn down during this period, including roughly 200 million barrels from coordinated SPR releases; U.S. inventories alone declined by about 160 million barrels, with Cushing stocks dropping to historic lows. The WTI spot backwardation has essentially vanished, limiting further drawdown capacity. Meanwhile, the OECD’s SPR release program is winding down in Q3; if Strait transit remains disrupted, inventory drawdown pressure could shift further onto commercial stocks and Eurasian markets. On the shipping front, the latest data shows thateven accounting for 'black fleet' vessels transiting the Strait of Hormuz, tanker traffic may have already fallen below 1... of normal levels,
I. Consensus Among Institutions: Short-Term Spike Amid Medium-Term Decline
Compared with the initial Strait closure at the end of February, the most fundamental change now is that global oil inventory buffers have been significantly depleted.CICC notes that as of the end of Q2, OECD oil inventories deviated from their five-year seasonal average by approximately -8%, widening from about -1% at the end of February. Nearly 300 million barrels were drawn down during this period, including roughly 200 million barrels released from strategic petroleum reserves (SPR) collectively; U.S. inventories declined by about 160 million barrels, with Cushing inventories dropping to historic lows and the WTI spot discount virtually eliminated, limiting further drawdown capacity. Meanwhile, the OECD’s SPR release program is winding down in Q3; if Strait transit remains disrupted, destocking pressure could shift further toward commercial inventories and Eurasian markets.
On the shipping front, the latest data shows thateven accounting for transit by 'dark fleet' tankers, crude oil tanker traffic through the Strait of Hormuz may have fallen below 10% of normal levels.CICC accordingly notes:Lower inventory buffers will amplify the short-term price elasticity of oil in the event of trade disruptions,increasing the risk of a short-term spike, though CICC maintains its view of a Q3 Brent price average of $90 per barrel.
CICC points out that global oil demand in Q2 declined by nearly 4 million barrels per day year-over-year,and weak demand expectations could limit how long prices stay elevated;recently subdued spot premiums may already be reflecting this demand weakness.
A Goldman Sachs report similarly highlights two-way risks.The bank noted that Gulf exports briefly recovered to over 80% of pre-war levels in the first two weeks following the signing of the memorandum of understanding, but fell back below 50% after renewed tanker attacks in the Strait, creating a Persian Gulf supply gap of approximately 13.4 million barrels per day.
Goldman Sachs maintains its baseline forecast of $80/bbl for Brent crude in Q4 2026 and $75/bbl in 2027,but explicitly notes that near-term risks are skewed to the upside; if Gulf exports continue to stall, production rebounds are delayed, and a stronger demand response is forced, Brent could surge above $110/bbl in Q4. Conversely, if geopolitical tensions ease, output exceeds expectations, and demand recovery remains sluggish, oil prices could fall back into the $60 range by year-end.
Synthesizing views from two institutions, the current market pricing is not driven by one-sided bullish sentiment, but rather by 'elevated short-term supply shock elasticity and medium-term demand-driven negative feedback capping prices at elevated levels.'
II. Whether the CPI tailwind materializes depends on how oil prices transmit into core inflation
The transmission of oil prices into CPI is not a simple linear relationship.Gasoline prices declined 4.9% month-over-month in June, dragging CPI down by approximately 0.22 percentage points. It should be emphasized that the drop in energy prices reflected in June’s CPI largely captures the pullback in oil prices following the ceasefire and temporary resumption of Strait transit; the recent oil price rebound since July has not yet entered this data window. With oil prices now rebounding, this trend could reverse.
If oil prices continue to rise and transmit into core inflation and inflation expectations, market pricing of the Fed’s policy path could shift toward 'reflation concerns,'potentially driving U.S. Treasury yields and the dollar higher again, while U.S. equities could face dual pressure from rising rates and elevated energy costs.
However, given weak end-demand, companies tend to absorb higher costs by compressing margins, creating frictions in the pass-through from oil prices to CPI. Moreover, the duration oil prices can sustain elevated levels is itself constrained by demand.In its latest July report, the IEA forecasts global oil demand in 2026 will decline by approximately 1 million barrels per day year-over-year—the first annual contraction since the 2020 pandemic. Global demand in Q2 already fell by as much as 4.8 million barrels per day year-over-year. Weaker demand in Asia and slowing global economic growth together form a 'demand ceiling' capping oil prices.
In the short term, rising oil prices will erode the room for CPI to decline, but the risk of triggering runaway 'reflation' remains manageable in the medium term.
3. How to gain exposure to crude oil price movements?
Amid the current complex environment—where disruptions in the Strait of Hormuz are pushing oil prices higher and inflation expectations remain volatile—an increasing number of investors are asking how to participate in crude oil market trends through financial instruments. Below, we outline key instruments and practical strategies across four dimensions: U.S. equities, U.S. futures, commodity ETFs, and options.
1. U.S. Equities:
Holding shares of energy sector companies is the most accessible indirect approach for retail investors. These stocks are highly correlated with oil prices, but their returns are also influenced by company-specific factors such as operational performance, cost management, and dividend policies.
Investors seeking exposure to crude oil may focus on upstream exploration and production (E&P) stocks, which exhibit significant earnings elasticity during periods of rising oil prices. This approach suits investors who are bullish on the medium- to long-term oil price trend, willing to tolerate volatility in corporate fundamentals, and interested in dividend income.
Investors may consider the $Oil & Gas Integrated (LIST2224.US)$ sector.
U.S. CPI fell 0.4% month-over-month in June, marking its first monthly decline in about six years, bringing the year-over-year rate down to 3.5%, while core CPI declined to 2.6% YoY. The energy component plunged 5.7% month-over-month,temporarily reinforcing market expectations that inflation had entered a downtrend and weakening expectations for further rate hikes. However, after Iran announced the closure of the Strait of Hormuz on July 12, geopolitical risk premiums quickly returned. Brent crude oil rebounded strongly from a low near $70 per barrel, surging more than 15% in a single week,As of this writing, Brent crude futures have breached $90 per barrel, posting a cumulative gain of 27% since early July. I. Institutional Consensus: Short-Term Spike Amid Medium-Term Decline Compared with the initial Strait closure at the end of February, the most fundamental change in today’s market is that global oil inventory buffers have been significantly depleted.CICC noted that by the end of Q2, OECD oil inventories had deviated further below their five-year seasonal average—widening from approximately -1% at the end of February to around -8%. Nearly 300 million barrels were drawn down during this period, including roughly 200 million barrels from coordinated SPR releases; U.S. inventories alone declined by about 160 million barrels, with Cushing stocks dropping to historic lows. The WTI spot backwardation has essentially vanished, limiting further drawdown capacity. Meanwhile, the OECD’s SPR release program is winding down in Q3; if Strait transit remains disrupted, inventory drawdown pressure could shift further onto commercial stocks and Eurasian markets. On the shipping front, the latest data shows thateven accounting for 'black fleet' vessels transiting the Strait of Hormuz, tanker traffic may have already fallen below 1... of normal levels,
2. Futures: Direct trading of crude oil futures contracts
Crude oil futures are the core instrument for tracking oil prices. Key benchmarks include: $Crude Oil Futures (OCT6) (CLmain.US)$$Micro Crude Oil Futures (OCT6) (MCLmain.US)$$Brent Last Day Financial Futures (DEC6) (BZmain.US)$
The core advantage of futures lies in their leverage effect— Investors can control contracts with much higher notional value using only a small amount of margin, maximizing potential profits while hedging against price volatility risk through hedging strategies.
Key strategies:
- Go long during event-driven situations:When Strait transit is disrupted or inventory buffers are insufficient, go long on near-month contracts to capture short-term supply-driven premiums.
- Hedging:Investors holding long positions in energy stocks or commodity ETFs can use short futures positions to hedge against the risk of falling oil prices.
Investors should pay close attention to risks such as overnight gaps, margin calls, contract delivery, and rollover. When capital is limited, prioritize micro contracts and avoid using full margin.
3. Commodity ETFs:
ETFs currently offer the most convenient way for individual investors to gain exposure to crude oil, primarily falling into two categories:
(1) Commodity-based crude oil ETFs — Direct exposure to oil prices
These ETFs track oil prices by holding crude oil futures contracts. Investors can review relevant tickers via the $Oil ETFs (LIST21039.US)$ section.
U.S. CPI fell 0.4% month-over-month in June, marking its first monthly decline in about six years, bringing the year-over-year rate down to 3.5%, while core CPI declined to 2.6% YoY. The energy component plunged 5.7% month-over-month,temporarily reinforcing market expectations that inflation had entered a downtrend and weakening expectations for further rate hikes. However, after Iran announced the closure of the Strait of Hormuz on July 12, geopolitical risk premiums quickly returned. Brent crude oil rebounded strongly from a low near $70 per barrel, surging more than 15% in a single week,As of this writing, Brent crude futures have breached $90 per barrel, posting a cumulative gain of 27% since early July. I. Institutional Consensus: Short-Term Spike Amid Medium-Term Decline Compared with the initial Strait closure at the end of February, the most fundamental change in today’s market is that global oil inventory buffers have been significantly depleted.CICC noted that by the end of Q2, OECD oil inventories had deviated further below their five-year seasonal average—widening from approximately -1% at the end of February to around -8%. Nearly 300 million barrels were drawn down during this period, including roughly 200 million barrels from coordinated SPR releases; U.S. inventories alone declined by about 160 million barrels, with Cushing stocks dropping to historic lows. The WTI spot backwardation has essentially vanished, limiting further drawdown capacity. Meanwhile, the OECD’s SPR release program is winding down in Q3; if Strait transit remains disrupted, inventory drawdown pressure could shift further onto commercial stocks and Eurasian markets. On the shipping front, the latest data shows thateven accounting for 'black fleet' vessels transiting the Strait of Hormuz, tanker traffic may have already fallen below 1... of normal levels,
The largest among them is $United States Oil Fund LP (USO.US)$ , which tracks the WTI near-month futures contract, with approximately $2.2 billion in assets under management and a year-to-date gain of nearly 80%, making it the most actively traded crude oil ETF in the U.S. equity market.
Investors in crude oil ETFs should pay special attention to roll decay.When the futures curve is in contango (forward prices higher than near-term prices), the ETF incurs rolling costs each month as it sells the expiring near-month contract and buys the more distant one. This can cause the ETF’s long-term performance to deviate from spot prices. However, the market is currently in backwardation (forward prices lower than near-term prices), which benefits crude oil ETFs by turning what would normally be a drag—roll decay—into a positive roll yield.
(2) Oil & gas equity ETFs — Indirect exposure
These ETFs hold energy company stocks rather than futures contracts. Investors can review relevant tickers via the $Energy (LIST20757.US)$ section.
U.S. CPI fell 0.4% month-over-month in June, marking its first monthly decline in about six years, bringing the year-over-year rate down to 3.5%, while core CPI declined to 2.6% YoY. The energy component plunged 5.7% month-over-month,temporarily reinforcing market expectations that inflation had entered a downtrend and weakening expectations for further rate hikes. However, after Iran announced the closure of the Strait of Hormuz on July 12, geopolitical risk premiums quickly returned. Brent crude oil rebounded strongly from a low near $70 per barrel, surging more than 15% in a single week,As of this writing, Brent crude futures have breached $90 per barrel, posting a cumulative gain of 27% since early July. I. Institutional Consensus: Short-Term Spike Amid Medium-Term Decline Compared with the initial Strait closure at the end of February, the most fundamental change in today’s market is that global oil inventory buffers have been significantly depleted.CICC noted that by the end of Q2, OECD oil inventories had deviated further below their five-year seasonal average—widening from approximately -1% at the end of February to around -8%. Nearly 300 million barrels were drawn down during this period, including roughly 200 million barrels from coordinated SPR releases; U.S. inventories alone declined by about 160 million barrels, with Cushing stocks dropping to historic lows. The WTI spot backwardation has essentially vanished, limiting further drawdown capacity. Meanwhile, the OECD’s SPR release program is winding down in Q3; if Strait transit remains disrupted, inventory drawdown pressure could shift further onto commercial stocks and Eurasian markets. On the shipping front, the latest data shows thateven accounting for 'black fleet' vessels transiting the Strait of Hormuz, tanker traffic may have already fallen below 1... of normal levels,
The largest among them is $Energy Select Sector SPDR Fund (XLE.US)$, which has relatively lower flexibility compared to commodity ETFs—up approximately 31% year-to-date, while Brent crude oil futures have risen nearly 48% over the same period,overall tracking the trend but with less elasticity than oil prices themselves, though the advantage is smoother drawdowns.
Suitable for investors who wish to conveniently participate in oil price movements without engaging in the complexities of futures trading.Overall, commodity ETFs are better suited for short-term oil price tracking, while equity ETFs are more appropriate for medium- to long-term allocation.
4. Options:
The following uses $United States Oil Fund LP (USO.US)$ as an example to explain options strategies; this does not constitute investment advice.
Currently $United States Oil Fund LP (USO.US)$ Option volatility is at a historically high percentile, making option premiums relatively expensive and favoring option-selling strategies.
U.S. CPI fell 0.4% month-over-month in June, marking its first monthly decline in about six years, bringing the year-over-year rate down to 3.5%, while core CPI declined to 2.6% YoY. The energy component plunged 5.7% month-over-month,temporarily reinforcing market expectations that inflation had entered a downtrend and weakening expectations for further rate hikes. However, after Iran announced the closure of the Strait of Hormuz on July 12, geopolitical risk premiums quickly returned. Brent crude oil rebounded strongly from a low near $70 per barrel, surging more than 15% in a single week,As of this writing, Brent crude futures have breached $90 per barrel, posting a cumulative gain of 27% since early July. I. Institutional Consensus: Short-Term Spike Amid Medium-Term Decline Compared with the initial Strait closure at the end of February, the most fundamental change in today’s market is that global oil inventory buffers have been significantly depleted.CICC noted that by the end of Q2, OECD oil inventories had deviated further below their five-year seasonal average—widening from approximately -1% at the end of February to around -8%. Nearly 300 million barrels were drawn down during this period, including roughly 200 million barrels from coordinated SPR releases; U.S. inventories alone declined by about 160 million barrels, with Cushing stocks dropping to historic lows. The WTI spot backwardation has essentially vanished, limiting further drawdown capacity. Meanwhile, the OECD’s SPR release program is winding down in Q3; if Strait transit remains disrupted, inventory drawdown pressure could shift further onto commercial stocks and Eurasian markets. On the shipping front, the latest data shows thateven accounting for 'black fleet' vessels transiting the Strait of Hormuz, tanker traffic may have already fallen below 1... of normal levels,
(1) Covered Call:
Suitable for investors who already hold a $United States Oil Fund LP (USO.US)$ position, believe the price will not rise significantly in the short term, and wish to enhance returns in a sideways market. The investor holds 100 shares of USO and simultaneously sells one call option. The currently elevated implied volatility results in richer option premiums.
The advantage of this strategy is generating additional income from the existing position and providing some downside cushion; the drawback is that upside gains are capped—if oil prices surge above the strike price, the investor misses out on excess appreciation.
U.S. CPI fell 0.4% month-over-month in June, marking its first monthly decline in about six years, bringing the year-over-year rate down to 3.5%, while core CPI declined to 2.6% YoY. The energy component plunged 5.7% month-over-month,temporarily reinforcing market expectations that inflation had entered a downtrend and weakening expectations for further rate hikes. However, after Iran announced the closure of the Strait of Hormuz on July 12, geopolitical risk premiums quickly returned. Brent crude oil rebounded strongly from a low near $70 per barrel, surging more than 15% in a single week,As of this writing, Brent crude futures have breached $90 per barrel, posting a cumulative gain of 27% since early July. I. Institutional Consensus: Short-Term Spike Amid Medium-Term Decline Compared with the initial Strait closure at the end of February, the most fundamental change in today’s market is that global oil inventory buffers have been significantly depleted.CICC noted that by the end of Q2, OECD oil inventories had deviated further below their five-year seasonal average—widening from approximately -1% at the end of February to around -8%. Nearly 300 million barrels were drawn down during this period, including roughly 200 million barrels from coordinated SPR releases; U.S. inventories alone declined by about 160 million barrels, with Cushing stocks dropping to historic lows. The WTI spot backwardation has essentially vanished, limiting further drawdown capacity. Meanwhile, the OECD’s SPR release program is winding down in Q3; if Strait transit remains disrupted, inventory drawdown pressure could shift further onto commercial stocks and Eurasian markets. On the shipping front, the latest data shows thateven accounting for 'black fleet' vessels transiting the Strait of Hormuz, tanker traffic may have already fallen below 1... of normal levels,
(Using QQQ as an example to illustrate the options strategy; the on-screen visuals are for demonstration purposes only and do not constitute any investment advice or guarantee. Market conditions change frequently, and displayed prices may not reflect actual market values.)
(2) Cash-Secured Put:
Suitable for investors with a neutral-to-moderately bullish outlook on oil prices, who believe prices won’t decline sharply, have idle cash available, and are willing to buy USO at a specific price while waiting for a better entry point. In a high implied volatility environment, the premium income is attractive. If $United States Oil Fund LP (USO.US)$ the price rises or trades sideways, the option expires worthless and the investor keeps the full premium; if it falls below the strike price, upon assignment, the effective purchase price will be lower than the current market price.
The advantage of this strategy is the potential to profit in both rising and falling markets; the drawback is that significant declines in USO still result in unrealized losses, and upside gains are limited to the premium received.
U.S. CPI fell 0.4% month-over-month in June, marking its first monthly decline in about six years, bringing the year-over-year rate down to 3.5%, while core CPI declined to 2.6% YoY. The energy component plunged 5.7% month-over-month,temporarily reinforcing market expectations that inflation had entered a downtrend and weakening expectations for further rate hikes. However, after Iran announced the closure of the Strait of Hormuz on July 12, geopolitical risk premiums quickly returned. Brent crude oil rebounded strongly from a low near $70 per barrel, surging more than 15% in a single week,As of this writing, Brent crude futures have breached $90 per barrel, posting a cumulative gain of 27% since early July. I. Institutional Consensus: Short-Term Spike Amid Medium-Term Decline Compared with the initial Strait closure at the end of February, the most fundamental change in today’s market is that global oil inventory buffers have been significantly depleted.CICC noted that by the end of Q2, OECD oil inventories had deviated further below their five-year seasonal average—widening from approximately -1% at the end of February to around -8%. Nearly 300 million barrels were drawn down during this period, including roughly 200 million barrels from coordinated SPR releases; U.S. inventories alone declined by about 160 million barrels, with Cushing stocks dropping to historic lows. The WTI spot backwardation has essentially vanished, limiting further drawdown capacity. Meanwhile, the OECD’s SPR release program is winding down in Q3; if Strait transit remains disrupted, inventory drawdown pressure could shift further onto commercial stocks and Eurasian markets. On the shipping front, the latest data shows thateven accounting for 'black fleet' vessels transiting the Strait of Hormuz, tanker traffic may have already fallen below 1... of normal levels,
(Using QQQ as an example to illustrate the options strategy; the on-screen visuals are for demonstration purposes only and do not constitute any investment advice or guarantee. Market conditions change frequently, and displayed prices may not reflect actual market values.)
(3) Long Put Vertical Spread (Put Debit Spread):
Suitable for $United States Oil Fund LP (USO.US)$ investors with a mild bearish outlook on the underlying asset over the medium to long term who wish to hedge against downside risk at a controlled cost. This involves buying a put option with a higher strike price and selling a put option with a lower strike price, establishing the position with a net premium outlay. The maximum loss is capped at the net premium paid, which is significantly lower than the cost of buying a standalone put option.
The advantages of this strategy include controllable cost, limited risk, and partial insulation from changes in volatility; the drawbacks are limited profit potential and neutral exposure to time decay—unlike pure short-option strategies that directly benefit from theta decay.
U.S. CPI fell 0.4% month-over-month in June, marking its first monthly decline in about six years, bringing the year-over-year rate down to 3.5%, while core CPI declined to 2.6% YoY. The energy component plunged 5.7% month-over-month,temporarily reinforcing market expectations that inflation had entered a downtrend and weakening expectations for further rate hikes. However, after Iran announced the closure of the Strait of Hormuz on July 12, geopolitical risk premiums quickly returned. Brent crude oil rebounded strongly from a low near $70 per barrel, surging more than 15% in a single week,As of this writing, Brent crude futures have breached $90 per barrel, posting a cumulative gain of 27% since early July. I. Institutional Consensus: Short-Term Spike Amid Medium-Term Decline Compared with the initial Strait closure at the end of February, the most fundamental change in today’s market is that global oil inventory buffers have been significantly depleted.CICC noted that by the end of Q2, OECD oil inventories had deviated further below their five-year seasonal average—widening from approximately -1% at the end of February to around -8%. Nearly 300 million barrels were drawn down during this period, including roughly 200 million barrels from coordinated SPR releases; U.S. inventories alone declined by about 160 million barrels, with Cushing stocks dropping to historic lows. The WTI spot backwardation has essentially vanished, limiting further drawdown capacity. Meanwhile, the OECD’s SPR release program is winding down in Q3; if Strait transit remains disrupted, inventory drawdown pressure could shift further onto commercial stocks and Eurasian markets. On the shipping front, the latest data shows thateven accounting for 'black fleet' vessels transiting the Strait of Hormuz, tanker traffic may have already fallen below 1... of normal levels,
(Using QQQ as an example to illustrate the options strategy; the on-screen visuals are for demonstration purposes only and do not constitute any investment advice or guarantee. Market conditions change frequently, and displayed prices may not reflect actual market values.)
Conclusion
The temporary disruption at the Strait of Hormuz is partially offsetting the positive impact of cooling inflation. However, under the 'ceiling' of weak demand, oil prices also face limited upside potential for a sustained rally. Investors should currently focus on the interplay among strait transit conditions, inventory drawdowns, and inflation expectations, rather than fixating on any single oil price level. Whether these tailwinds get eroded ultimately depends on whether geopolitical disruptions escalate from mere price shocks into broader macro repricing.
Fellow investors, what do you think about crude oil prices in the second half of the year?
Lastly, we’d like to offer fellow investors a small perk—feel free to claim your optionswelcome package
*This promotion is exclusively available to invited HK users. Click to learn more.Detailed terms and conditions of the promotion >>
With market conditions complex and ever-changing, and numerous optionsStrategyavailable but you’re unsure how to choose? Futubull helps you set up an options strategy in three simple steps.Strategy, making investing simple and efficient from now on!
U.S. CPI fell 0.4% month-over-month in June, marking its first monthly decline in about six years, bringing the year-over-year rate down to 3.5%, while core CPI declined to 2.6% YoY. The energy component plunged 5.7% month-over-month,temporarily reinforcing market expectations that inflation had entered a downtrend and weakening expectations for further rate hikes. However, after Iran announced the closure of the Strait of Hormuz on July 12, geopolitical risk premiums quickly returned. Brent crude oil rebounded strongly from a low near $70 per barrel, surging more than 15% in a single week,As of this writing, Brent crude futures have breached $90 per barrel, posting a cumulative gain of 27% since early July. I. Institutional Consensus: Short-Term Spike Amid Medium-Term Decline Compared with the initial Strait closure at the end of February, the most fundamental change in today’s market is that global oil inventory buffers have been significantly depleted.CICC noted that by the end of Q2, OECD oil inventories had deviated further below their five-year seasonal average—widening from approximately -1% at the end of February to around -8%. Nearly 300 million barrels were drawn down during this period, including roughly 200 million barrels from coordinated SPR releases; U.S. inventories alone declined by about 160 million barrels, with Cushing stocks dropping to historic lows. The WTI spot backwardation has essentially vanished, limiting further drawdown capacity. Meanwhile, the OECD’s SPR release program is winding down in Q3; if Strait transit remains disrupted, inventory drawdown pressure could shift further onto commercial stocks and Eurasian markets. On the shipping front, the latest data shows thateven accounting for 'black fleet' vessels transiting the Strait of Hormuz, tanker traffic may have already fallen below 1... of normal levels,
Options Risk Disclosure:An option is a contract that gives the holder the right—but not the obligation—to buy or sell an underlying asset at a predetermined price on or before a specific date. Option prices are influenced by multiple factors, including the current price of the underlying asset, the strike price, time to expiration, and implied volatility. Implied volatility reflects the market’s expectation of future price fluctuations over the option's life and is derived by reversing the Black-Scholes option pricing model. It is commonly viewed as a gauge of market sentiment. When investors anticipate greater volatility, they may be willing to pay higher premiums for options to hedge their risk, resulting in higher implied volatility. Traders and investors use implied volatility to assess the attractiveness of option prices, identify potential mispricings, and manage risk exposure.
Disclaimer:This content does not constitute an offer, solicitation, recommendation, advice, opinion, or any guarantee regarding any securities, financial products, or instruments. The risk of loss in trading options can be substantial. In certain circumstances, your losses may exceed the initial margin deposit. Even if you set contingent orders such as 'stop-loss' or 'limit' orders, there is no assurance these will prevent losses. Market conditions may render such orders unexecutable. You may be required to deposit additional margin on short notice. If you fail to meet the margin call within the specified timeframe, your open positions may be liquidated. You remain fully liable for any deficit balance in your account resulting from such liquidation. Therefore, prior to trading options, you should thoroughly research and understand options and carefully consider whether such trading aligns with your financial situation and investment objectives. If you trade options, you should be familiar with the procedures for exercising options and handling expiration, as well as your rights and obligations upon exercise or expiration. Options trading involves substantial risk and is not suitable for all investors. Investors should carefully read"Characteristics and Risks of Standardized Options"
Risk Disclaimer: The above content only represents the author's view. It does not represent any position or investment advice of Futu. Futu makes no representation or warranty.Read more
Thumbs Up
9
Heart
2
Lol
1
Emm
1
2.1M Views
Report
Comments (3)
Write a Comment...
3
13
13