
SpaceX's second wave of lock-up expirations is here; how should investors position themselves in spa

Bull Bull Tech Intelligence | Post-IPO Lock-up Expiry Flood and Bond Market Warning: Can SpaceX Stabilize and Break Through?
As of July 19, $SpaceX (SPCX.US)$ share priceclosed at a record low of $123.99,down more than 40% from its intraday high of $225.64 in mid-Juneand has already fallen below its IPO price of $135.
According to S3 Partners,short interest in SpaceX currently stands at approximately 185–196 million shares, representing a staggering 29%–31% of the float—a 10-percentage-point increase over the past 10 trading days.The CIO of a small North American hedge fund commented: "Even if SpaceX announced it had conquered the moon and discovered gold there,there still wouldn’t be enough capital in the market to absorb these shares."—referring specifically to the upcoming wave of lock-up expirations. The market’s primary focus recently isthe first batch of lock-up expirations in August. Approximately 911 million shares will become tradable starting on the second trading day following the Q2 earnings release, equivalent to more than 1.4 times the current public float.This means that even if demand remains unchanged, supply will surge to more than double its current level.
If the stock market sell-off remains within the bounds of volatility, thenthe rapid deterioration in the bond marketmore clearly reflects a severe and comprehensive market repricing of risk surrounding SpaceX—SpaceX’s 30-year bond yield has climbed from 6.65% at issuance to 7.4%, approaching high-yield junk bond territory; credit default swap (CDS) spreads have widened to 158 basis points, significantly up from 110 basis points at the end of June.
With short-selling pressure, upcoming share lock-up expirations, and bond market warning signals all converging, the stock price will continue seeking its true equilibrium point after supply-demand rebalancing in the near term.The Q2 earnings report in August and the expiration of share lock-ups will be the most critical catalysts for determining whether this correction has reached its bottom.
Below, we will systematically analyze SpaceX’s current price structure and key levels from a technical perspective.
Recent stock price movement

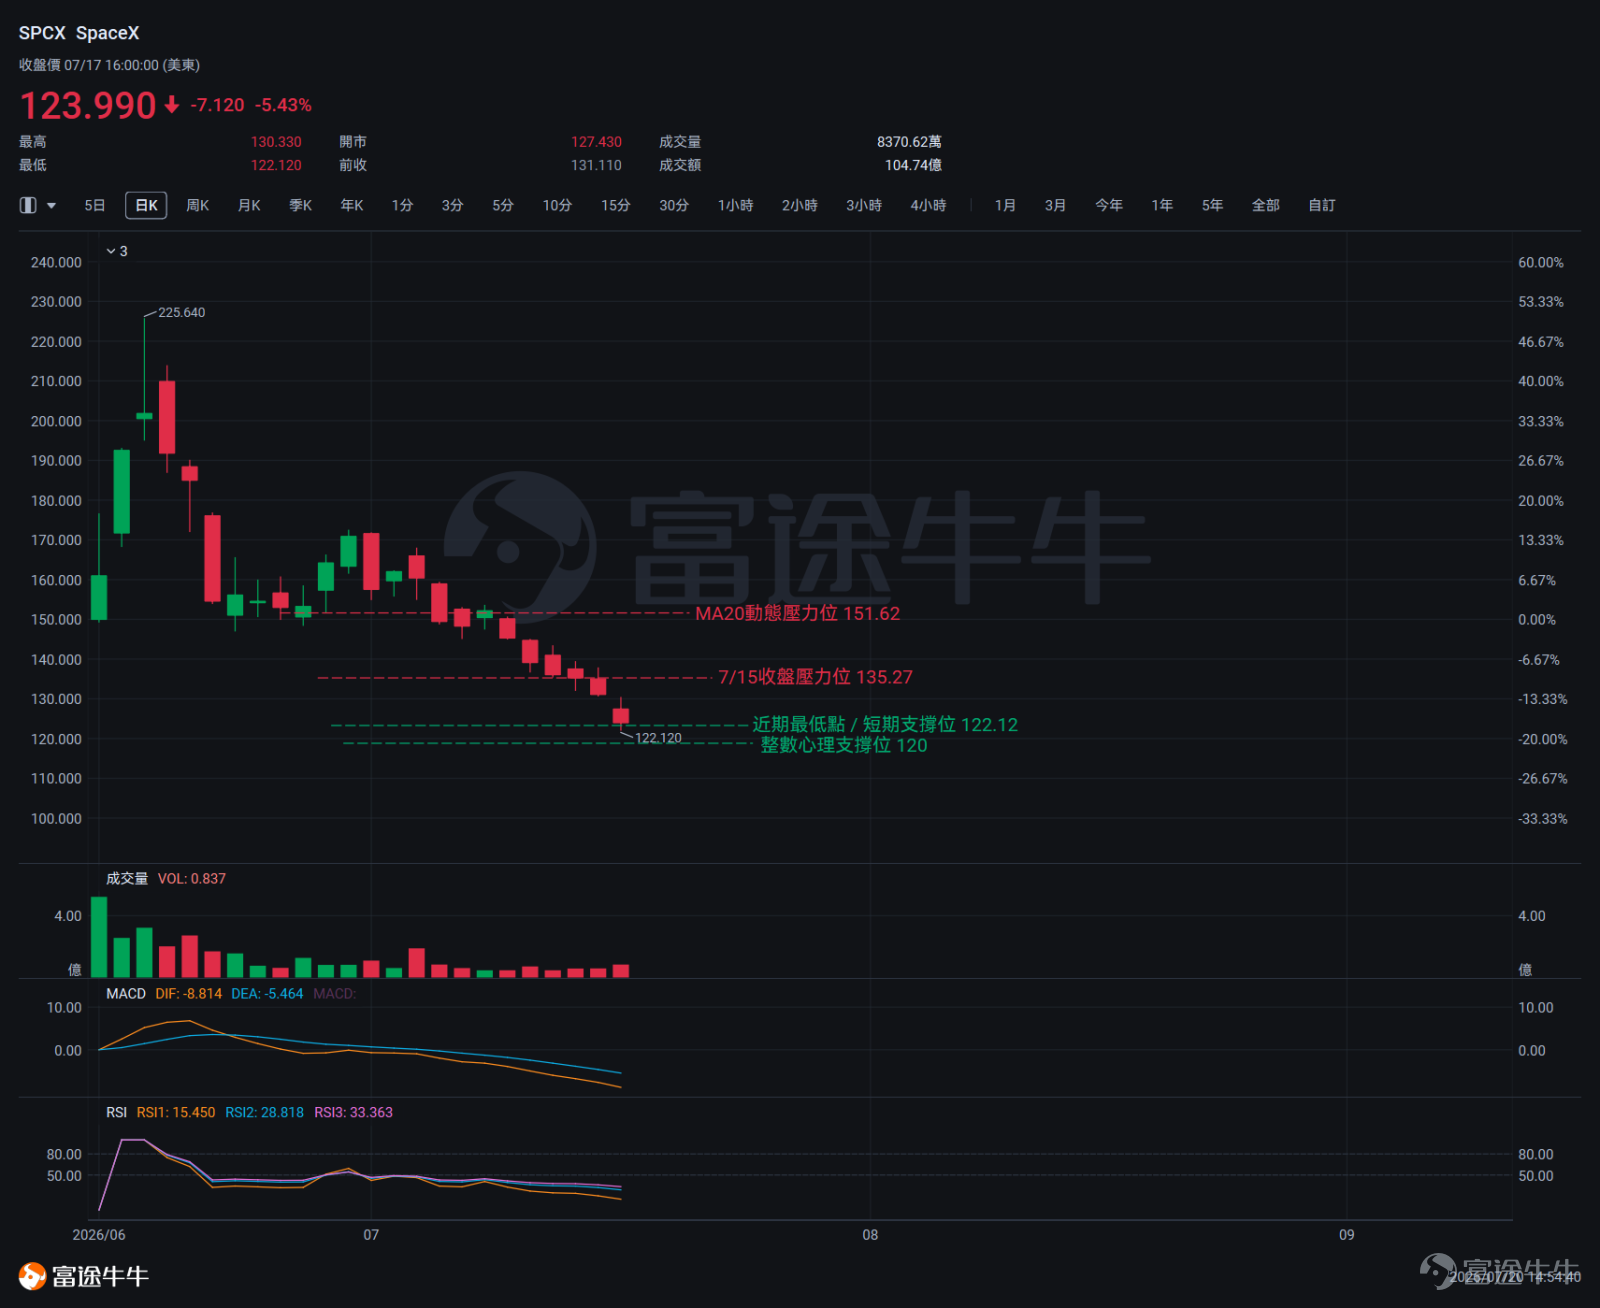
From the July 6 peak of $167.90, SpaceX declined steadily over 10 trading days to $123.99, marking a cumulative drop of approximately 26.1%,with the overall trend exhibiting a classic accelerating downtrend—price failed to establish any meaningful consolidation range, underscoring clear short-side dominance.The current price is below the 20-day moving average (MA20) at $151.62, indicating that the short-to-medium-term moving average structure has formed a resistance ceiling.The lower Bollinger Band ($124.01) has been decisively breached, signaling elevated market volatility.
Based on the patterns of the last 10 daily candlesticks,bearish signals continue to strengthen.From July 13 to 17, five consecutive large bearish candles appeared, each closing progressively lower and establishing an extended 'Three Black Crows' pattern (i.e.,a strong bearish continuation signal formed by consecutive large down candles). Prices continued to close lower with virtually no lower wicks, indicating uninterrupted bearish momentum during this period. On July 9, there was a single bullish candle (opened at $150.45 and closed at $152.16), but it was completely engulfed by a large bearish candle the next day—marking a failed bullish rebound attempt and reflecting the bulls’ near-total inability to mount effective counter-pressure during this phase.
On July 17, the stock opened at $127.43 and closed at $123.99. Although intraday bullish momentum pushed prices up to a high of $130.33, the gains could not be sustained, and the price was driven back down to close near the session low, also setting a new recent low of $122.12.
Overall, the concurrent appearance of the extended Three Black Crows pattern and the decisive break below the lower Bollinger Band constitutes a textbook signal for trend continuation. Although the upper wick on July 17 reflects intraday bullish attempts, the closing price indicates that bulls still lack sufficient strength to support a meaningful reversal.Whether a bottom can be confirmed around the $122.12 level will be the key focus going forward.
Key Technical Indicator Analysis
Moving Averages (MA):The 20-day moving average (MA20) is at $151.62; the current price of $123.99 is approximately 18.3% below MA20, indicating that the short-term moving averages have formed strong resistance and are in a bearish alignment.
RSI:The current reading is 28.82, which falls within the oversold zone.
Bollinger Bands:The current stock price of $123.99 has broken below the lower Bollinger Band at $124.01, and the bands are in a state of high volatility expansion.
Comprehensive assessment
The current price is sandwiched between key support and multiple layers of resistance.
On the support side,$122.12 was the intraday low on July 17,If this level holds after being tested multiple times, it could establish a basis for a short-term rebound; if broken, the nearest reference zone below would bethe psychological $120 round number level,Round-number levels often exhibit strong psychological support effects, but they do not constitute robust technical support.
On the resistance side,$124.01 (the lower Bollinger Band) has transitioned from support to resistance.Whether the rebound can effectively reclaim and hold above this level is the first threshold for determining if a short-term stabilization has初步 taken hold;$135.27 (July 15 closing price congestion zone) serves as secondary resistance; $151.62 (20-day moving average) is the intermediate-term trend resistance level,Until this level is breached, the overall moving average structure remains bearish.

Risk Disclaimer: The above content only represents the author's view. It does not represent any position or investment advice of Futu. Futu makes no representation or warranty.Read more


Comments (20)
to post a comment
45
92