
Inflation data fell more than expected, and capital inflows into US equities drove a modest weekly gain of 1.60% in Bitcoin | Bitcoin | Research Report | Cryptocurrency Market Analysis | Late Stage of Bear Market
During the week of July 12–18, the global crypto market exhibited a complex dynamic shaped by short-term macro liquidity tightening and medium-to-long-term structural policy easing. With U.S. core inflation in June cooling significantly, macro financial conditions shifted toward easing, providing tailwind support for Bitcoin.
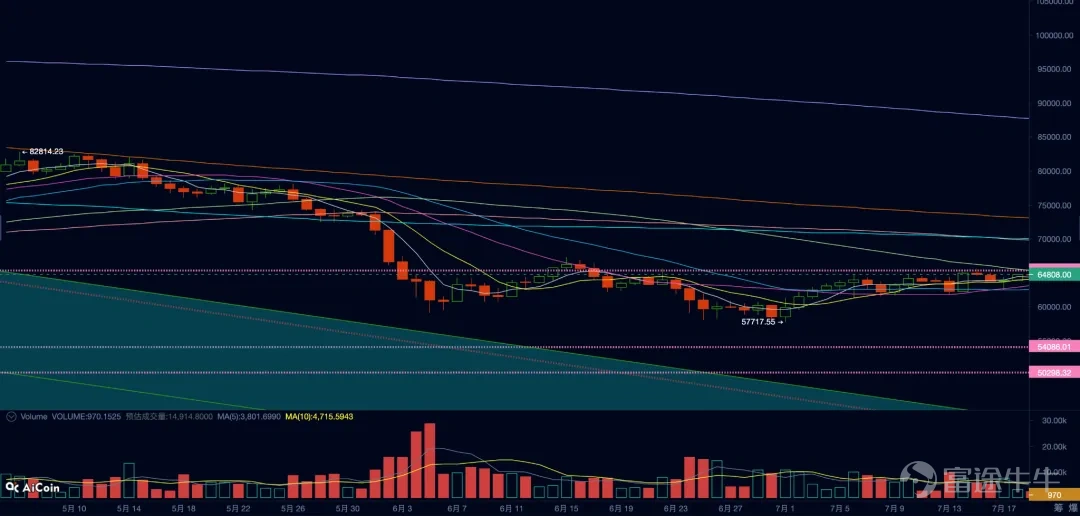
Due to declining Fed net liquidity and a pullback in U.S. tech stocks, the transmission of macro-driven capital flows into crypto markets was only partial. This was supported by net inflows into Bitcoin ETFs and a significant decline in exchange spot balances, resulting in a modest weekly gain of 1.60% for Bitcoin, closing at $64,796. Ultimately, this week exhibited divergence between macro and crypto markets, confirming spot-driven dominance and achieving marginal accumulation across the market.
Although a mild recovery has occurred, according to EMC Labs’ Bitcoin cycle analysis model, Bitcoin remains in the late stage of a bear market, with overall losses still severe. The market is simultaneously undergoing painful deleveraging while searching for a bottom amid an uncertain macro-financial environment.

Bitcoin Daily Price Chart
Macro Finance
This week, the key macro-financial driver was the U.S. June inflation data released on July 14. The data showed a clear structural easing of inflation: headline CPI fell year-over-year to 3.50%, below the prior reading of 4.20% and market expectations of 3.80%. Core CPI also declined year-over-year to 2.60% (from 2.90% previously), and PPI dropped to 5.50% (from 6.00%). This disinflationary data alleviated market fears of a Fed rate hike in July, although interest rate swap markets still indicate a high likelihood of one more hike this year.
At the micro-liquidity and hard interest rate data level, dollar liquidity tightened marginally this week. The Fed’s net liquidity provision decreased by 1.27% week-over-week, reflecting short-term capital withdrawal pressure. Simultaneously, SOFR rose by +0.07% to 3.62%, confirming higher short-term wholesale funding costs and tighter liquidity in the banking system. However, both the Treasury and FX markets responded positively to the structural disinflation. The 2-year U.S. Treasury yield edged up +2 bps to 3.71%, reflecting lingering hawkish commentary from Fed officials; meanwhile, the 10-year Treasury yield—a better proxy for long-term inflation and growth expectations—fell by -3 bps to 4.54%. The U.S. Dollar Index weakened, declining -0.22% to close at 100.75. The concurrent decline in long-end yields and the dollar significantly eased discount rate pressures on risk asset valuations.
In terms of traditional risk assets and macro transmission, the three major U.S. equity indices experienced notable pullbacks and style rotation. The Nasdaq tumbled -2.90% to close at 25,520.24; the S&P 500 fell -1.55% to 7,457.69; and the Dow Jones Industrial Average declined modestly by -0.93% to 52,146.42.
The sharp correction in U.S. equities was not driven by deteriorating fundamentals, but rather by profit-taking following fully priced-in expectations ahead of the inflation release. Additionally, later in the week, some Fed officials warned that core inflation remains above target, triggering a defensive rotation out of high-valuation tech stocks—particularly in the semiconductor memory segment—into value-oriented sectors.It should be noted that despite the stronger-than-expected disinflation in June, market expectations for additional rate hikes in the second half of the year remain elevated.
Crypto Markets
This week, Bitcoin opened at $63,773 and closed at $64,796, posting a weekly gain of 1.60%. It reached a high of $65,560 and a low of $61,751 during the week, resulting in an overall price range of 5.97%. While prices moved upward in a volatile manner, spot market liquidity showed signs of contraction, with the 7-day average daily spot trading volume declining to 60,239 BTC—a 8.91% drop from the previous week—indicating severely insufficient market confidence.
From the perspective of capital flows, the market exhibited clear channel divergence and spot accumulation characteristics. On one hand, Bitcoin ETFs—one of the main sources of incremental capital—recorded net inflows totaling $92 million for the week. On the other hand, stablecoin supply slightly decreased by $125 million. Meanwhile, exchange-held spot Bitcoin showed strong outflow momentum, with exchange balances declining by 11,825 BTC this week. This deep accumulation of spot coins from exchanges into non-exchange on-chain addresses significantly alleviated selling pressure during market volatility.
In derivatives and leverage metrics, market structure displayed moderate and rational characteristics. Open interest rose to $58.66 billion, up 1.58% for the week. However, funding rates remained low, showing no signs of speculative leverage buildup or overheating. Weekly derivatives liquidation data indicated balanced long-short dynamics, with no evident risk of deleveraging-driven liquidations.
On-chain profitability and holder behavior indicate the market is currently in a brutal coin redistribution phase. The overall MVRV ratio rose to 1.23, reflecting mild profit-taking pressure. In terms of realization willingness, the aggregate SOPR remained flat at 1.00, and short-term holder SOPR also held at 1.00, suggesting short-term holders are mostly holding positions at breakeven or with minimal gains/losses. Beneath this calm surface, long-term holder SOPR dropped sharply to 0.81 (a weekly change of -0.53), indicating some long-term holders transferring coins on-chain opted to sell at a loss. The on-chain profit-to-loss ratio for the week stood at 0.38, confirming losses still dominate. Regarding coin movement, long-term holder supply decreased by 17,255 BTC, while short-term holder supply increased by 31,842 BTC—evidence that weaker hands among long-term holders are undergoing painful liquidation typical of late bear markets.
In summary, although external fiat inflows into crypto markets this week were constrained by stablecoin contraction, robust ETF net inflows and significant net outflows of spot Bitcoin from exchanges continued to drive on-chain accumulation. The restrained derivatives market and extremely low funding rates have ruled out risks of a leverage-driven crash. Therefore, Bitcoin’s current price action is fundamentally spot-driven, characterized by ongoing market clearing and price reconstruction.
Market Implications
Integrating macroeconomic and crypto market data, the complete causal chain for this week is as follows:
Structural slowdown in U.S. core inflation (CPI fell to 3.50%) → Anchored expectations of medium-to-long-term policy pivot (DXY dropped to 100.75; 10-year Treasury yield fell to 4.54%) → Release of long-term macro tailwinds (easing/tailwind) → However, constrained by the Fed’s short-term liquidity tightening (-1.27%) and profit-taking pullbacks in U.S. equities (Nasdaq down -2.90%), macro capital failed to flow into crypto at scale via stablecoins (stablecoin supply down slightly by $124.73 million), leading to a partial transmission from macro trends to crypto markets. Under this mechanism, Bitcoin diverged from U.S. tech equities, supported instead by strong on-chain spot accumulation and ETF inflows ($91.77 million), enabling price reconstruction through spot-driven market clearing and bottom formation.
Outlook
Current market dynamics align with the transition from the 'decline phase' to the 'bottoming phase' as defined by the EMC Labs BTC Cycle Analysis Model. Loss-driven selling still dominates on-chain behavior, but whether buying power around the $60,000 level—particularly inflows from equity markets—can offset this selling pressure will determine Bitcoin’s subsequent price trajectory.Based on this assessment, closely monitor whether incremental capital can continue flowing in, as well as developments in the U.S.-Iran conflict and macroeconomic financial data.
Next week, key items to watch include:
ECB interest rate decision and Lagarde’s press conference (Thursday, July 23): Markets widely expect rates to remain unchanged next week (with a probability of approximately 84% to 95%). The focus will be on Lagarde’s policy guidance regarding a potential rate cut in September. A hawkish signal would push the euro higher and lift global bond yields, exerting upward pressure on interest rates and weighing on Bitcoin; a dovish shift would ease global risk-free rates, benefiting crypto assets.
U.S. macroeconomic and employment data: including the Leading Indicators on Monday, July 20; Initial Jobless Claims on Thursday, July 23; and S&P Global Flash PMI preliminary readings and New Home Sales on Friday, July 24. These data releases will directly shape forward-looking expectations ahead of the Fed’s FOMC meeting on July 28–29. Stronger-than-expected data would boost the DXY and U.S. Treasury yields, pressuring Bitcoin; weak data would reinforce expectations of rate cuts, acting as a liquidity catalyst for Bitcoin.
Geopolitical and energy risk monitoring: Potential threats from Middle East tensions to oil shipments through the Strait of Hormuz. An escalation in geopolitical conflict that triggers a sharp spike in oil prices could reignite global stagflation concerns (similar to the logic behind eurozone inflation rising to 3.2% in May), pushing up the DXY and prompting safe-haven outflows from high-risk assets, posing downside risks for Bitcoin.
The above analysis is provided by EMC Labs.
———————————————————————
About EMC Labs
EMC Labs is a partner of Victory Securities, and together they have launched the only virtual asset fund approved by the SEC to accept stablecoin subscriptions—the Victory EMC BTC Cycle Fund. EMC Labs was co-founded by seasoned virtual asset investors and data scientists, with a core team hailing from JD.com Finance, Bell Labs, Marsbit, and other companies. EMC Labs has invested substantial resources in building a professional engine to analyze Bitcoin’s on-chain data and technical indicators.
Disclaimer
Investment involves risks, and investors should take note. The value of securities and investments can go up as well as down and is not guaranteed. Investors may not get back the original investment amount, and past performance is not necessarily indicative of future results. Victory Securities’ securities trading services are provided by Victory Securities Limited (hereinafter referred to as “Victory Securities”). This document was prepared and authorized for release on this platform by Victory Securities Limited, and the information contained herein is for reference purposes only. Victory Securities Limited reserves the right to make changes or terminate at any time without prior notice. All information provided on this platform, including this document and its contents, may not be reproduced, linked, reposted, or otherwise copied for publication or commercial use by any media, website, or individual without prior written authorization from Victory Securities. Authorized users must acknowledge that the source material originates from Victory Securities when using this document and its content, and commit to complying with relevant laws and all international conventions regarding internet usage, refraining from illegal purposes or unlawful use of this document. Violators will bear all associated legal and financial responsibilities. Data or figures quoted in this document may come from third parties; Victory Securities does not guarantee the accuracy of such third-party data or materials, nor will it assume liability for the fairness, accuracy, timeliness, completeness, or correctness of any data, forecasts, and/or opinions contained herein, nor the benchmarks upon which such forecasts and/or opinions are based. Any forward-looking statements in this document do not constitute guarantees of future performance, and actual circumstances or developments may differ significantly. This document is not and should not be considered or construed as an offer, invitation, solicitation, recommendation, advice to buy or sell any investment products, or as a basis for investment decisions, nor should it be interpreted as professional advice. Readers or those making investment decisions should fully understand the risks involved and the legal, tax, and accounting characteristics and consequences, and decide whether investing aligns with personal objectives and risk tolerance. Seek appropriate professional advice if necessary. In certain countries, the distribution and circulation of this document may be restricted by law or regulation, and recipients should be aware of and comply with such restrictions.
Risk Disclaimer: The above content only represents the author's view. It does not represent any position or investment advice of Futu. Futu makes no representation or warranty.Read more
Comments
to post a comment