
Major tech earnings reports are pouring in, and Apple's market cap has surpassed $5 trillion for the

NiuNiu Tech Intelligence | Google drops over 4% in a single day—market concerns grow as latest Gemini model fails to meet benchmarks, delaying launch?
July 16 $Alphabet-C (GOOG.US)$The stock opened high but closed low, dropping more than 4% in a single day.The primary reason was Bloomberg’s report thatGoogle’s flagship AI model, Gemini 3.5 Pro, has been delayed by several months, primarily due to its coding capabilities falling short of internal benchmarks.Additionally, the model has shown insufficient stability in real-world programming scenarios such as multi-file collaboration, toolchain invocation, and long-task workflows. It still lags significantly behind OpenAI’s GPT-5.6 (SWE-bench score: 96.2%) and Claude Fable 5 (SWE-bench score: 95%).
Moreover, Buffett recently acknowledged in a live CNBC interview that his failure to invest in Google early on was a 'mistake' and explicitly stated that Google is now 'more likely to be a winner.'This statement could provide short-term sentiment support for its share price.
Below, we will systematically analyze the current price structure and key levels from a technical perspective.
Recent stock price movement

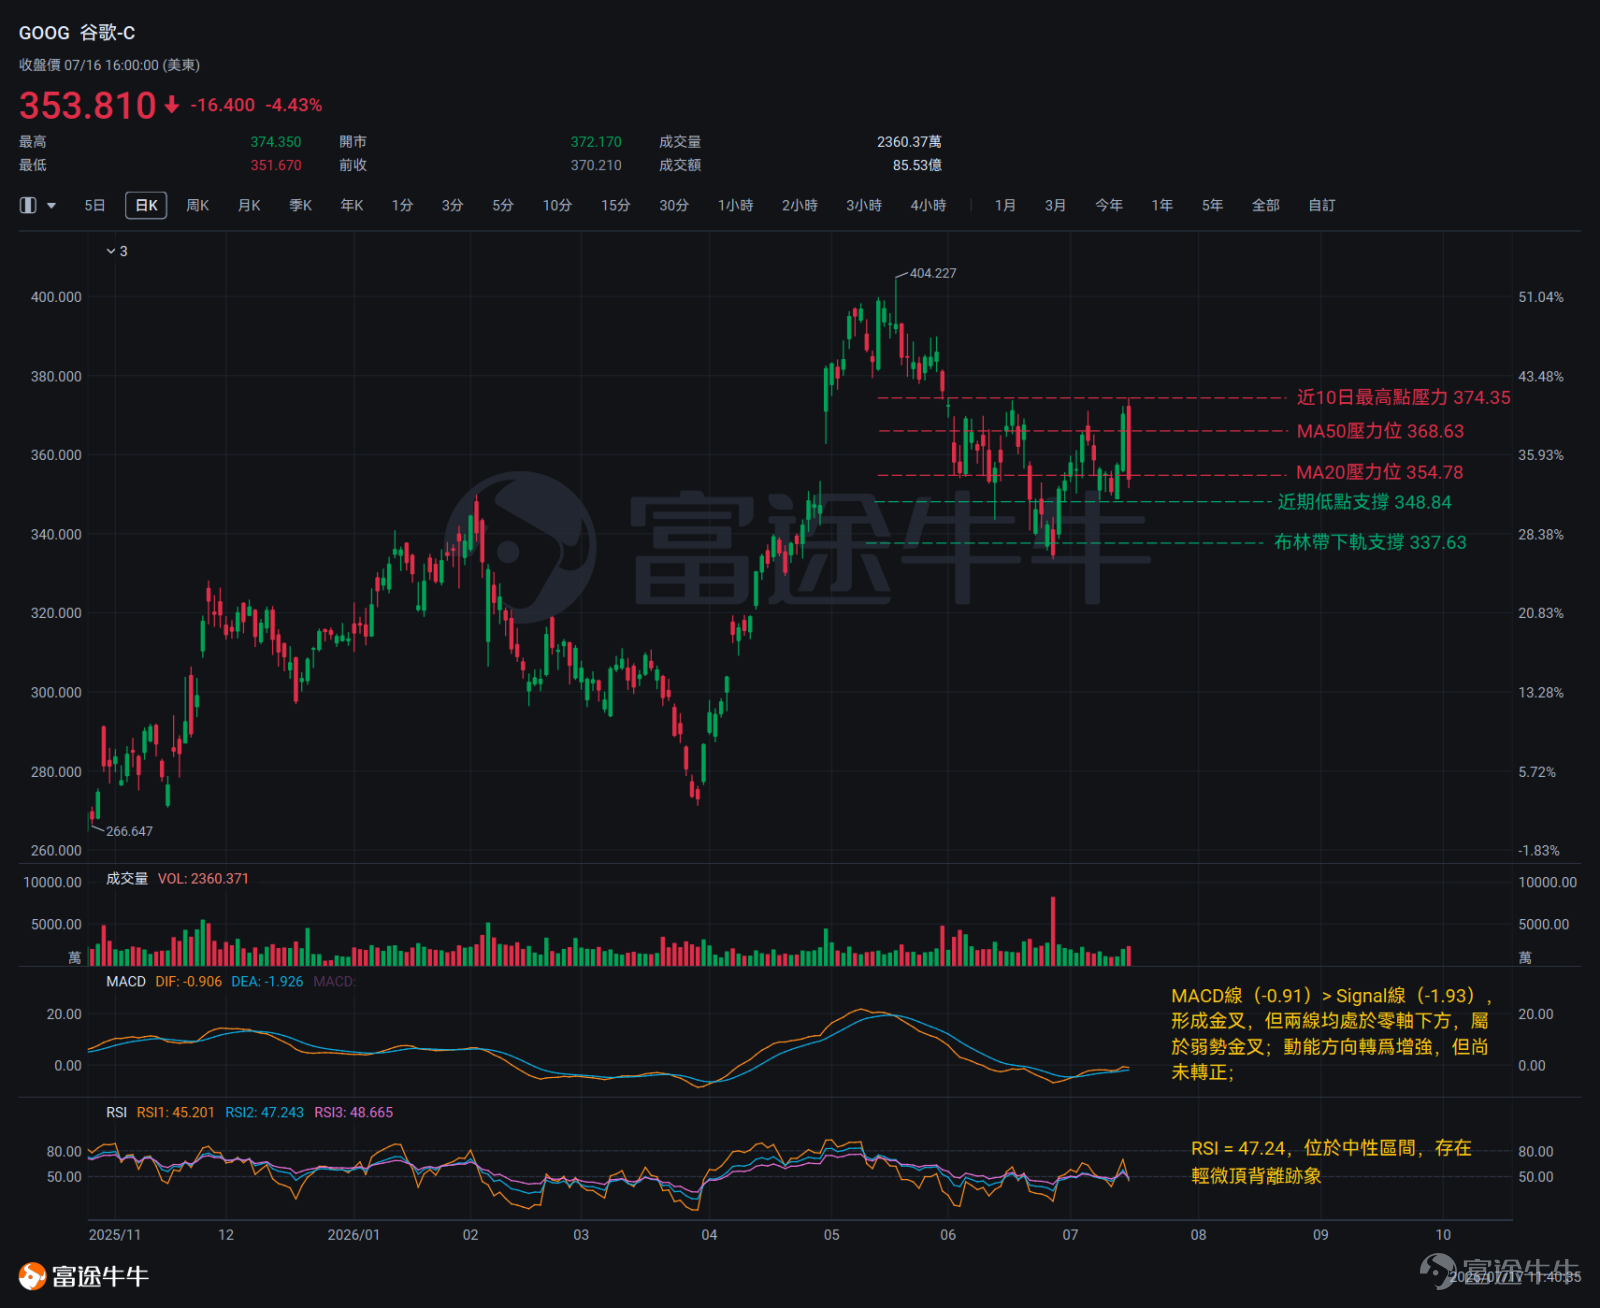
Google's current overall structure remains weak,with its closing price at $353.81, below both the 20-day moving average (MA20) of $354.78 and the 50-day moving average (MA50) of $368.63,and the short-term moving averages are in a bearish alignment.The stock price is trading between the middle Bollinger Band ($354.78) and the lower band ($337.63), just below the middle band, and has consistently failed to reclaim it effectively, making the middle band a clear overhead resistance level.
Looking at the price action over the past 10 trading days, the stock tested the July 14 low near $348.84 multiple times before rebounding. On July 15, it rose to a short-term high near $374.35 but then dropped sharply on July 16, resulting in high volatility.
Three sets of candlestick signals have appeared sequentially in recent sessions. On July 14, the stock opened lower but quickly rallied, posting a strong intraday recovery.The area around $348.84 has been tested multiple times without being breached, establishing a reference support zone.On July 15, resistance was clearly evident—opened at $356.01, peaked at $372.14, and closed at $370.21.Combined with the following day's price action, this can be interpreted as a signal of rejection at high levels.On July 16, a large bearish candle opened at $372.17 and closed at $353.81, completely engulfing the prior day’s bullish real body. The open gapped up above the previous day’s close but then declined sharply throughout the session, occurring near the $374 resistance zone, forming a bearish engulfing pattern.This indicates a significant top reversal.
Key Technical Indicator Analysis
Moving Averages (MA):MA20 = $354.78, MA50 = $368.63; current price is below both moving averages, showing a short-term bearish alignment.
RSI:The current RSI value is 47.24, within the neutral range. Over the past 10 days, the stock price rebounded from the $350 area to $370 before pulling back. The RSI failed to confirm this rally by making a corresponding higher high, showing a slight bearish divergence.
MACD:MACD line (-0.91) > Signal line (-1.93), forming a golden cross; however, both lines remain below the zero axis, indicating a weak bullish crossover.
Bollinger Bands:The current price ($353.81) lies between the middle Bollinger Band ($354.78) and the lower band ($337.63), just below the middle band. Bollinger Band width is 34.29, showing no significant contraction; the middle band is exerting clear downward pressure, and the price has not yet effectively reclaimed it.
Comprehensive assessment
On the support side,$350.67 coincides with the July 13 closing price and a recent high-volume trading zone; $348.84 was the intraday low on July 14.This level has been tested multiple times without being breached.Forms a strong short-term support;If this level is decisively broken to the downside,Watch for the risk of a move toward the lower Bollinger Band at $337.63.
On the upside, resistance lies at$354.78, where the 20-day moving average (MA20) converges with the middle Bollinger Band—this is the nearest resistance level to the current share price;The stock is currently trading below this level and has failed to break above it;$368.63 corresponds to the 50-day moving average (MA50), forming a key medium-term resistance level; the zone between $372.14 and $374.35 represents a dense resistance area where recent rallies have been rejected twice.
Overall, the immediate focus of the bulls-versus-bears battle is whetherthe stock can hold the strong short-term support at $348.84. If it stabilizes above this level and breaks through $354.78, attention may shift toward a potential move toward the MA50 at $368.63. Conversely, a breakdown below $348.84 would raise concerns about further declines toward the lower Bollinger Band at $337.63.

Risk Disclaimer: The above content only represents the author's view. It does not represent any position or investment advice of Futu. Futu makes no representation or warranty.Read more


Comment (1)
to post a comment
10
26