
Rumors swirl that top-tier PE firms are acquiring Workday! Could this trigger a valuation re-rating

Bull Bull Tech Intelligence | IBM's earnings miss drags down the software sector—what’s next for traditional SaaS?
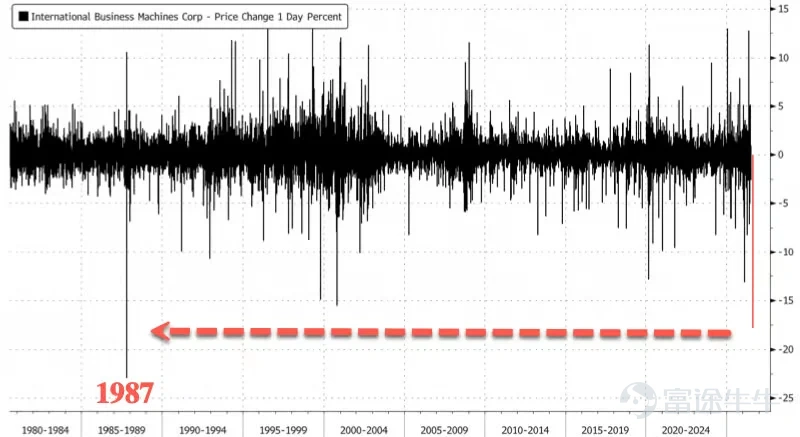
Before the market opened on July 14, $IBM Corp (IBM.US)$ issued an earnings warning that caught the market off guard.The stock closed down 25.21% that day, marking its worst single-day drop on record, surpassing even 1987.

While the figures in the warning itself were not catastrophic, the signal it revealed alarmed the market far more than the numbers alone. Goldman Sachs immediately issued a clear warning,directly stating that this IBM incident 'will fully validate a bearish scenario for software' and anticipating broad-based selling pressure across the software and services sector.
The true core of the earnings gap: The collapse of Transaction Processing
Breaking down the internal structure of the software business is key to understanding the scale of this earnings gap.
According to analysts at UBS and Goldman Sachs, weak sales of IBM’s mainframes (zSeries) directly hit its high-margin Transaction Processing (TP) business, which is estimated to have declined by a mid-teens percentage year-over-year in Q2. The issue lies in the fact that TP accounts for nearly 30% of IBM’s total software segment revenue—this is the real leverage behind the software growth rate dropping sharply from an expected 11% to just 5%.
The AI infrastructure boom has diverted funding away from software.
To understand the root cause of this earnings shortfall, one key premise must first be established:Reallocation of enterprise IT budgets does not equate to an overall expansion of IT spending.
Storage chip shortages triggered by AI data center construction have significantly driven up NAND and DRAM prices, leading to broad-based price increases across servers and AI computing infrastructure. Banks—the core customer base for IBM—are bearing the brunt of these rising costs.
The market’s verdict was clearer than any analyst report: on the day of IBM’s sharp drop, $PHLX Semiconductor Index (.SOX.US)$ its index components generally rose, $Micron Technology (MU.US)$ +4.92%、 $SanDisk (SNDK.US)$ +5.01%、 $Intel (INTC.US)$ +4.5%、 $NVIDIA (NVDA.US)$ +4.06%; while $ServiceNow (NOW.US)$ fell 5.76%, $Workday (WDAY.US)$ down 3.49%, $SAP SE (SAP.US)$ down 3.23%, $Salesforce (CRM.US)$ down 2.14%.
AI is redefining the boundary between 'buying vs. building'
A more profound structural threat is emerging from another direction: as AI-powered code generation tools mature, the decision boundary for enterprises between 'building in-house vs. purchasing' is quietly shifting. $Starbucks (SBUX.US)$ With annual software spending of approximately $400 million, the company is currently testing internally developed systems that could replace Microsoft’s inventory management tools and IBM’s specialized maintenance tools. This doesn’t mean every company will become a software developer, but it reflects a reality: the widespread adoption of AI coding tools has substantially lowered the marginal cost barrier for enterprises to replicate standardized software functionalities internally.SaaS products with highly homogeneous features and low customer switching friction will be the first to feel this pressure.
Is this an idiosyncratic issue or an industry-wide signal?
Does the panic spreading rapidly through the market after IBM’s sharp drop equate to a verdict on the entire software sector? Several analysts remain cautious about this view.
Barclays’ Andrew Keches explicitly noted: IBM has acknowledged company-level execution issues, including the failure to close several large contracts on schedule. More importantly, IBM chose to proactively disclose this news more than a week ahead of its official earnings release.This behavior itself suggests that the gap is more of an isolated incident rather than a signal of systemic deterioration across the industry.
Goldman Sachs’ James Schneider also noted that weakness in IBM’s Data & Automation software business stems partly from internal execution issues, and stated that he would hold off on adjusting valuation models until management provides further clarity during next week’s earnings call.
However, caution does not equate to optimism. UBS’ Robert Ruple characterized IBM’s warning as a potential 'harbinger'—possibly signaling that other software, IT services, and hardware companies may issue similar alerts during the upcoming Q2 earnings season. Jefferies’ Jeffrey Favuzza directly highlighted the market’s current central concern:“Is IBM’s performance ‘a preview of what lies ahead for us’?”Earnings reports from ServiceNow and SAP are due next week, which should provide the market with clearer answers.
Shift in SaaS Valuation Framework
Over the past decade, the valuation logic for publicly traded SaaS companies has rested on a core assumption: highly predictable subscription-based revenue combined with strong growth compounding justifies price-to-sales (P/S) multiples significantly above earnings levels.
However, historical data from the Bessemer Venture Partners (BVP) Cloud Index shows that median SaaS growth rates have declined from over 35% in the mid-2010s to around 20% today.If AI further suppresses seat growth, customer renewal rates, and vendor pricing power, a shift in investors’ valuation anchors will be nearly inevitable—away from P/S multiples toward price-to-earnings (P/E) ratios, free cash flow, and actual operating margins.
For companies that can clearly demonstrate AI’s ability to expand their own revenue—not just increase model compute costs—this shift presents an opportunity; for those experiencing slowing growth without corresponding profit realization, the shift implies a systemic downward adjustment in their valuation anchor.
IBM’s recent plunge does not signal the end of enterprise software, nor does it indicate a full-scale collapse of the SaaS business model. The real signal is this: the narrative framework that 'ARR growth can compound consistently for a decade while price-to-sales multiples keep rising' has now been called into question by reality.
IBM’s warning has rung like an alarm bell, placing this quarter’s enterprise software earnings window in a state of heightened sensitivity.The following five dimensions will offer more discerning signals than the traditional metric of 'whether revenue beat expectations':
New ARR and Remaining Performance Obligation (RPO):These reflect revenue visibility over the next 12 to 24 months. If RPO growth significantly lags behind revenue growth, it may suggest that the sales pipeline is accumulating order backlog pressure rather than signaling a genuine rebound in demand.
Net Revenue Retention (NRR) and customer churn data:The expansion spending capacity of existing customers is the most direct indicator of whether AI threats have materially eroded the business model. A systemic decline in NRR signifies a loss of pricing power, not merely a slowdown in customer acquisition.
Seat-based growth vs. usage-based billing revenue ratio:The degree of transition from subscription-based to usage-based billing reveals whether a company is proactively responding to structural shifts in demand driven by the AI era.
The actual contribution of AI products aligns with their gross margin.:If AI is merely a cost item rather than a revenue amplifier, the valuation premium will be unsustainable.
Free cash flow and sales efficiency ratio:In a slowing growth environment, profit quality and capital efficiency will become the key anchors for repricing.
IBM's recent stock price movement

From a technical pattern perspective,IBM has entered a clearly accelerating downtrend.On July 14, the closing price of $217.07 plummeted by over 73 points from the previous day's $290.23, sharply breaking below both the 20-day moving average (MA20 at $274.69) and the 50-day moving average (MA50 at $262.45). It also breached the lower Bollinger Band ($232.77) and is now trading outside the band, indicating extremely elevated volatility.
However, this breakdown was not sudden; clear pattern-based warnings preceded it. On July 7, after five consecutive bullish candles pushed the price up to a high of $311.80, the close settled only slightly lower at around $306.13, forming a notably long upper shadow—signaling initial signs of waning bullish momentum and emerging selling pressure. The following day (July 8), a bearish candle closed at $302.05, partially confirming this signal.
Subsequently, bearish candles appeared consecutively on July 10 and July 13: the July 10 candle closed at $287.56, already erasing part of the prior day’s gain (July 9 closed at $295.30), gradually revealing technical signs of top formation and setting the stage for the subsequent sharp decline.
The massive bearish candle on July 14 completed the final breakdown: opened at $226.37, hit an intraday low of $213.22, and closed at $217.07, with sellers dominating throughout the session from open to close.The trend structure has been severely damaged.
The three-phase price action is clearly delineated:Price rallied then reversed, suggesting a potential top formation → two consecutive bearish candles indicating waning momentum → a sharp, large bearish candle confirming accelerated breakdown.
Key Technical Indicator Analysis
Moving Averages (MA):MA20 = $274.69, MA50 = $262.45; the stock price is significantly below both moving averages. Although the MA50 remains below the MA20 (no death cross yet), the price has deviated substantially downward, reflecting an expanding bearish divergence.
RSI:The current reading is 30.35, near the lower boundary of the neutral zone. No bullish divergence is present yet (only one low point, insufficient to form a divergence pattern). A second low at a similar level will be needed to confirm potential divergence.
MACD:MACD line (2.12) < Signal line (6.43); although still above the zero line, it is rapidly approaching it, indicating sharply weakening momentum. No divergence signal is present, and downward momentum continues to unfold.
Bollinger Bands:The price has broken below the lower Bollinger Band ($232.77), exhibiting a classic accelerating downtrend structure. Closing at $217.07—well outside the lower band—signals extreme volatility expansion, with both oversold risk and persistent downside momentum coexisting.
Comprehensive assessment
IBM’s current technical setup remains under significant pressure.
On the support side,$213.22 is the intraday low from July 14 and serves as the most relevant near-term support level;a break below this level would leave the stock without clear structural support, further exposing downside risk;$217.07 is the current closing price—holding above this level in the short term would allow room for consolidation, while a breach would quickly drive the price down to test the $213.22 support.
On the resistance side,$232.77 marks the lower Bollinger Band and represents the nearest rebound resistance;even if a technical rebound occurs, breaking above $232.77 will not be easy. From a medium-term perspective,the zone between $262.45 (50-day MA) and $274.69 (20-day MA) forms a dual moving average resistance band, which is a critical area to validate any trend recovery;until the trend structure shows substantial improvement, this resistance zone cannot be ignored and can serve as a reference for the upper limit of any medium-term rebound.

Risk Disclaimer: The above content only represents the author's view. It does not represent any position or investment advice of Futu. Futu makes no representation or warranty.Read more


Comments
to post a comment
13
39