
Gold prices have climbed above $4,600. Is the metals bull market back?

Has gold hit bottom? — AI narratives, U.S. Treasury risks, and three key variables determining gold’s direction
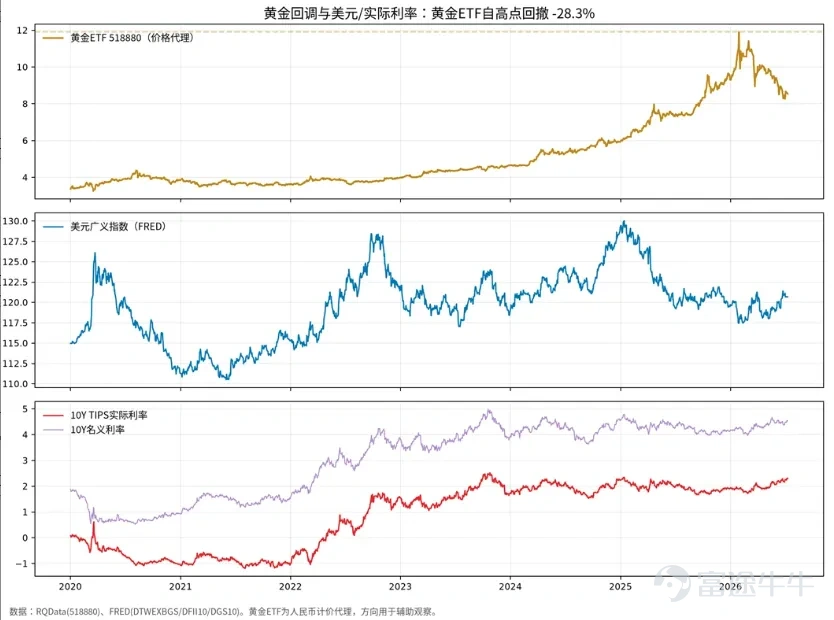
"Has gold hit bottom?" — This question can’t be answered by looking only at gold’s price chart; we must assess whether the macro narrative weighing on gold has started to loosen. In this cycle, using the renminbi-denominated tradable proxy for gold, prices have retraced approximately 28% from their January 2026 peak. On the surface, it’s attributed to a "strong dollar and high rates," but at its core, it’s a race between the "AI narrative" and the "U.S. Treasury reality." We’ll follow this thread and break it down into three parts, quantifying wherever possible.
I. How the AI Narrative Is Suppressing Gold: Dollar Suction, AI-Driven Debt, and Real Interest Rates
Gold’s primary pricing anchor has never been inflation itself, but rather real interest rates (nominal rates minus inflation expectations) and the U.S. dollar. To understand this recent pullback, we must examine how the U.S. "betting correctly on AI" simultaneously pushed up both of these factors.
First, AI is siphoning global capital and propping up the U.S. dollar. The surge in AI-related capital expenditures has turned U.S. tech stocks into a 'black hole' for global funds: investors worldwide are continuously pouring money into dollar-denominated assets to gain exposure to core AI names like NVIDIA, Microsoft, and Broadcom. Looking at the Nasdaq index, AI-driven stocks have kept rising steadily—serving as the clearest proxy for 'AI/tech risk appetite siphoning funds into dollar assets.' Meanwhile, the Federal Reserve’s broad trade-weighted dollar index has remained elevated near 120 (around 120.7 as of July 2, 2026). A stronger dollar naturally weighs on gold priced in dollars—this is precisely what is meant by the 'AI-driven dollar siphon.'
Second, AI-related debt and AI stocks together are pushing up real interest rates. On one hand, mega-cap tech firms are increasingly financing their multi-hundred-billion-dollar AI infrastructure projects through bond issuance ('AI debt'), and this massive new supply is driving up bond yields—the nominal yield on 10-year U.S. Treasuries has rebounded to around 4.54% (as of July 9, 2026). On the other hand, the strong profit momentum in tech stocks has kept risk appetite elevated and repeatedly delayed market expectations for rate cuts. With nominal rates rising while inflation expectations remain relatively stable, real interest rates have been pushed higher: the 10-year TIPS real yield stands at approximately 2.31%, near its highest level since 2020. Gold pays no interest; when holding U.S. Treasuries offers tangible positive real returns, gold’s relative appeal diminishes—this is the most direct mechanism suppressing gold prices.
Third, the narrative is self-reinforcing. Once 'AI reshaping macro dynamics' became consensus, capital flowed into AI while simultaneously exiting safe-haven assets. Gold, as a 'legacy-world safe haven,' has been temporarily sidelined. Institutional investors uniformly attribute this recent pullback to three converging factors: rising bond yields, a stronger dollar, and renewed enthusiasm for tech stocks—all of which have driven gold prices down from their highs.


But here’s a crucial caveat: the AI narrative explains 'why gold is falling,' but it doesn’t answer 'whether gold has already peaked.' That’s because the logic suppressing gold hinges on the assumption that 'AI can sustainably extend the life of the U.S. dollar and U.S. fiscal health'—an assumption that is precisely the 'near-term fire' we will dissect in Chapter Two.
II. The Near-Term Fire: AI Is Distant Water, U.S. Debt Is the Immediate Flame
A more fundamental assessment is this: AI is distant water; U.S. debt is the immediate flame. No matter how powerful AI becomes, it won’t translate into near-term cash flow for the U.S. Treasury—and the U.S. debt hole is a fire that grows larger every single day.
First, both debt levels and interest payments are spiraling out of control. According to FRED data, U.S. federal debt has climbed to roughly $39 trillion (as of Q1 2026) and continues to rise. More critically, net annualized interest expenses by the federal government have already reached about $1.22 trillion—and this figure is moving in lockstep with the expanding debt burden (see chart below). This reflects the compounding effect of 'high debt × high rates': as older low-yield bonds mature, they are being refinanced at much higher yields, causing interest costs to snowball. By official fiscal accounting, net interest payments have now become the second-largest expenditure item after Social Security.
Second, supply is expanding without limit, while demand is structurally weakening. Debt issuance knows no ceiling, yet demand is receding: foreign ownership of U.S. Treasuries has structurally declined (foreign holders account for roughly 30% of publicly held debt, led by Japan, the UK, and mainland China), signaling the end of the era when 'foreigners would absorb unlimited U.S. debt.' The burden is increasingly falling on domestic money market funds, hedge funds, and the Federal Reserve system to absorb new issuance. Infinite supply meeting peaking demand—that’s the quantitative essence behind 'persistently high Treasury yields with no buyers.'
Third, this dynamic is precisely generating structural buying pressure for gold. When a country’s debt can no longer be organically serviced through growth and must instead be diluted via inflation or monetization, the rational response for central banks globally is to reduce dollar reserves and increase gold holdings. According to the World Gold Council, global central banks purchased a net 863 tonnes of gold in 2025 (down from about 1,092 tonnes in 2024 but still historically high); in Q1 2026, net purchases totaled 244 tonnes (up 3% year-over-year and 17% quarter-over-quarter); and the share of central banks planning to increase gold reserves has risen to a record high. This represents a slow-moving, long-term support force entirely independent of the AI narrative.

Thus, Chapters One and Two are two sides of the same coin: the AI narrative (a near-term strength) is pressuring gold prices downward, while the reality of U.S. debt (a longer-term concern that is worsening) is providing underlying support. Whether gold has bottomed depends on which of these two forces shifts direction first—and the signals for that shift lie in the following three monitoring variables.
III. Which Bubble Bursts First? Three Quantifiable Variables That Determine Gold’s Direction
Whether gold has an opportunity isn’t determined by some 'expert calling a bottom,' but by the direction in which the following three sets of variables move. This article presents only an observational framework and trackable indicators—no judgment on gold prices is offered.
Observation One: Can AI truly capture global productivity gains through 'declining token costs → widespread application adoption' to extend the life of the U.S. dollar?
This lies at the heart of the 'AI bubble vs. U.S. Treasury bubble—which bursts first?' debate. The logic chain is: sustained declines in token prices → mass adoption of AI applications → U.S. tech giants siphon global productivity gains → U.S. corporate earnings and fiscal health benefit → the U.S. dollar and Treasuries get a lifeline. Trackable indicators include: (1) the rate of decline in token prices of leading large models (cost curve); (2) penetration and monetization of AI applications (cloud providers’ AI revenue, enterprise AI adoption rates); and (3) whether the Nasdaq/AI sector continues to outperform gold (i.e., whether the AI narrative is still 'winning'). If this chain holds, AI continues to support the dollar and maintains downward pressure on gold; if cost reductions in tokens fail to translate into adoption and profitability ('narrative overextension'), the AI-driven support for the dollar weakens. An extreme scenario to consider—but not base assumptions on—is whether the U.S. could use AI dominance to redistribute global wealth and extend its debt runway. This is a low-probability, high-impact tail event worth monitoring but not anchoring forecasts to.
Observation Two: Is the AI gap between China and the U.S. widening, and can the U.S. maintain its technological hegemony?
The U.S. dollar’s reserve currency status ultimately rests on America’s comprehensive national strength and technological hegemony. If the U.S.-China AI gap widens and the U.S. monopolizes AI gains, the dollar’s 'intrinsic value' rises, pressuring gold; if the gap narrows and AI capabilities become multipolar, the dollar’s technological premium erodes, supporting gold (as a 'non-sovereign reserve asset'). Trackable indicators include: (1) the performance gap between Chinese and U.S. frontier models (benchmarks, compute accessibility); (2) progress in domestic Chinese chips and large models; and (3) the degree of 'de-Americanization' in the global AI supply chain. This aligns with the broader de-dollarization trend—record central bank gold purchases and reserve diversification are quantifiable manifestations of this underlying shift.
Observation Three: Can U.S. inflation subside and prompt a restart of rate cuts? (This is the most direct cyclical trigger.)
The first two observations are slow-moving variables; this one is fast-moving and represents the most immediate cyclical trigger for gold prices. The current situation is nuanced: headline U.S. CPI YoY stands at approximately 4.27% (May 2026, boosted by energy and other volatile components), while core CPI YoY has already eased to around 2.96%—suggesting that inflation 'stickiness' resides mostly in volatile categories like energy, whereas core inflation is moderating. On the policy front, the federal funds rate is about 3.63% (June 2026). Market pricing for near-term rate cuts remains cautious, and real rates are unlikely to fall soon, continuing to weigh on gold. Trackable indicators include: (1) the pace of decline in core CPI/PCE; (2) the Fed’s dot plot and the rate-cut path implied by interest rate futures; and (3) signs of labor market weakening. Once disinflation is confirmed and rate cuts resume, driving real rates lower, that will be the strongest cyclical signal for a gold rally.

Conclusion: Has Gold Bottomed? Return Judgment Authority to Observable Signals
Synthesizing the three observations: this recent pullback in gold is driven by the near-term dominant force of the 'AI narrative' (dollar strength from capital inflows + elevated real rates)—a real and undeniable dynamic. However, the structural, slower-moving, long-term support for gold—the 'imminent U.S. debt crisis + de-dollarization-driven central bank buying'—remains intact and is, in fact, intensifying.
Therefore, there is no single answer to the question 'Has gold hit bottom yet?'—it depends on three sets of variables: in the short term, inflation and interest rate cuts (i.e., the direction of real interest rates); in the medium term, the AI landscape between China and the U.S. and U.S. technological dominance in the dollar system; and in the long term, whether AI can genuinely extend the lifespan of U.S. debt. If inflation—especially core inflation—is confirmed to be receding, rate cuts resume, and central bank gold purchases continue unabated, the signal for a cyclical bottom in gold will become clearer. Conversely, if the AI narrative continues to dominate everything else and real rates remain elevated, downward pressure on gold will persist. This article does not draw conclusions about gold prices but clearly lays out these three trackable variables—the opportunity for gold hinges on how these three factors evolve.
Risk Disclaimer: This article constitutes research-oriented discussion on macroeconomic trends and major asset classes. All facts and data referenced are sourced from public channels (FRED, U.S. Department of the Treasury, World Gold Council, RQData, etc.) and have been verified. The content herein does not constitute investment advice or a basis for trading decisions, nor does it make any predictions regarding future prices of gold, the U.S. dollar, U.S. Treasuries, or any other assets. Past performance and current conditions do not guarantee future results. Data sources: FRED (DTWEXBGS/DFII10/DGS10/GFDEBTN/A091RC1Q027SBEA/CPI), World Gold Council, RQData (518880).
Risk Disclaimer: The above content only represents the author's view. It does not represent any position or investment advice of Futu. Futu makes no representation or warranty.Read more
Comments
to post a comment