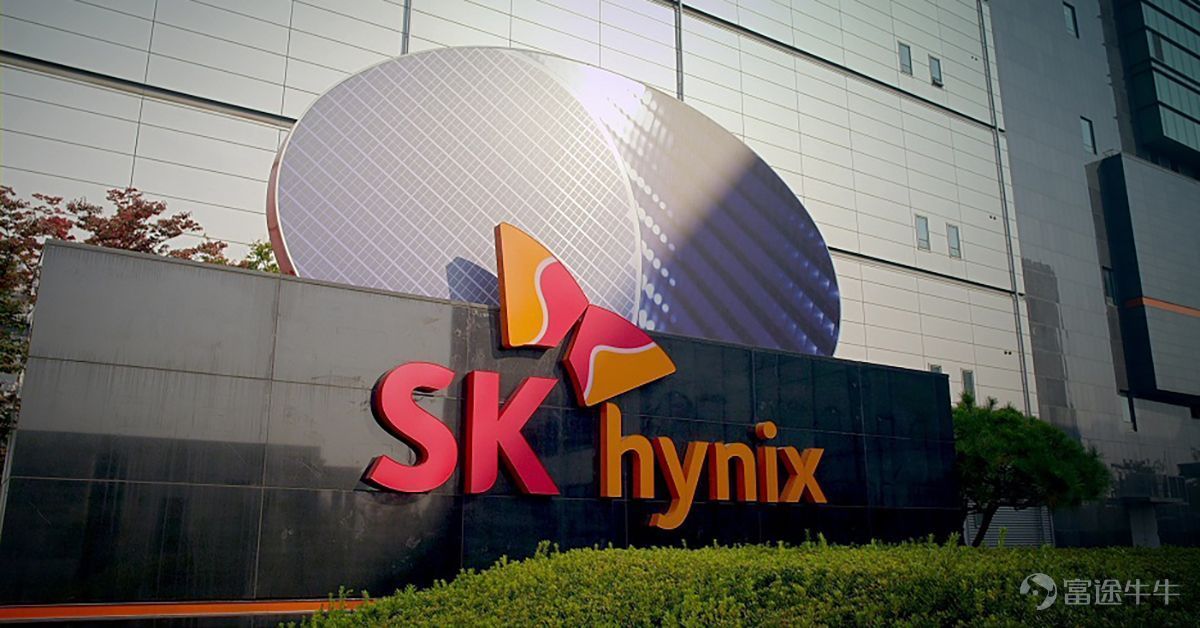

Storage giants launch collective buybacks: Where does the supercycle stand?

Hot Stock Commentary | SK Hynix U.S. ADR Debut: A Trading Perspective

💡 Key Takeaways
$SK hynix (SKHY.US)$ Listed on Nasdaq in the form of ADRs, with an offering price of $149; on its first trading dayclosed at $168.01, representing a12.76% premium over the offering price.。Three key questions: whether the primary offering price leaves room for profit, whether secondary market support is solid, and whether cross-market premiums are structurally justified—all received positive answers on the first day. The ADR traded at a ~15.5%–15.6% premium to the closing price of the Korean-listed shares, constrained by the strict 2.5% conversion quota from Korean shares to ADRs, which hampers arbitrage flows;the premium is unlikely to vanish and may even widen.。Oversubscribed by more than 7x, with global long-term capital endorsing the sustainability of HBM demand, compounded by the CEO's forecast of the most severe memory shortage in history by 2027,The strong first-day performance may signal that SK Hynix’s pricing power is shifting from the Korean equity market to the U.S. market, and that memory assets are evolving from cyclical, price-driven instruments into growth-oriented assets.
🔍 I. Event Background
$SK hynix (SKHY.US)$ This offering, listed on the Nasdaq in ADR form, priced at $149 per share, raised approximately $26.5 billion. On its first day,it opened at $170、closed at $168.01showing a stable overall trajectory and positive market reception.
🔍 II. Trading Perspective: Significance of the Listing Performance
From a trading perspective, focus on three key aspects: whether the primary offering left room for profit, whether secondary market support was solid, and whether cross-market premium exhibited structural strength.SK Hynix’s first-day results were broadly positive across all three dimensions.
2.1 Price difference between Level 1 and Level 2
The ADR was priced at $149 this time, and openeddirectly jumping to $170, with the secondary market immediately willing to pay14.1% above the offering price. It reached an intraday high of $177, up18.8% from the offering price; it closed at $168.01, still12.76% above the offering price. This pricing did not "over-milk primary market demand,"The underwriting side has still left room for tradable profit margins in the secondary market. If allocations at the primary level were fully subscribed, it would generally be difficult to see this magnitude of stable premium.
2.2 Trading Volume and Holdings
Day-one trading volume was approximately 1.058 billion ADR shares, with a turnover of USD 18.4 billion,higher thanSK Hynix’s Korean-listed shares, which saw about USD 8 billion in turnover over the past five trading days. Compared with comparable peers, Micron and Western Digital recorded turnovers of USD 31 billion and USD 20.7 billion respectively over the same period, indicating SK Hynix held its own quite well.Broad market participation, with both new and existing capital present—with primary-market allocation holders taking profits and secondary-market buyers actively stepping in to support prices, resulting in a relatively solid holdings structure.
2.3 Cross-Market Price Differential
The closing price of the locally listed Korean shares, when converted into equivalent ADR value, was approximately USD 145.15 to 145.40, based on whichThe ADR closed at $168.01, representing a premium of approximately 15.5%–15.6% over the Korean-listed shares, with the intraday high briefly reaching a premium of around 21.7%. This premium can be broken down into three components: first, a tradability premium (stemming from trading hours, USD settlement, research coverage, hedging instruments, and index fund access); second, scarcity due to the initial ADR float representing only 2.5% of total shares outstanding; and third, structural constraints on arbitrage—conversion from Korean shares to ADRs is limited, preventing efficient price convergence unlike Chinese ADRs, thereby allowing the structural premium to persist.
🔍 III. First-Day Share Price and Valuation Performance
3.1 Valuation Anchoring Toward Micron
Prior to listing, SK Hynix’s forward 12-month P/E ratio based on its Korean share price was approximately 5.4x–6.2x, compared to Micron’s同期 range of roughly 6.66x–7.0x. Factoring in the 15.5% ADR premium over the Korean share equivalent on the first trading day, SK Hynix’s ADR implies a forward P/E of about 6.35x,already clearly approaching Micron’s valuation range. At the close of the first trading day, SK Hynix’s ADR market capitalization reached$1.2246 trillion,,overtakencompared to Micron’s $1.1060 trillion on the same day. However, it should be noted that this includes a contribution of over 15% from the ADR premium channel.The real signal is that the discount should narrow—not that all discrepancies should vanish entirely.
3.2 Repricing Based on Asset Characteristics
The significance of SK Hynix’s ADR lies in enabling global capital to directly trade the core theme—HBM, DDR5, and AI server demand—in a more familiar format.What distinguishes this memory cycle from historical ones is that HBM customization has intensified, each wafer now consumes more resources, and with a higher proportion of LTAs (Long-Term Agreements) signed, future earnings growth will gradually shift from being driven by price increases to being driven by capacity ramp-up. If the view that memory is evolving from a cyclical commodity into a growth-oriented segment holds true, then SK Hynix’s repricing in the U.S. market is not an event-driven phenomenon but reflects a structural change in its asset characteristics.
3.3 Long-Term Capital Endorsement of the HBM Cycle
The first-day performance essentially represents a vote on the sustainability of the HBM upcycle.With oversubscription exceeding sevenfold and participation from global long-term funds, technology growth funds, and sovereign wealth funds, the offering clearly carries a medium-term cyclical bet. Combined with SK Hynix’s CEO statement—“2027 will witness the most severe memory shortage in history, and supply-demand imbalances could persist beyond 2030”——the strong first-day performance can be interpreted as capital markets temporarily assigning high confidence to this supply-demand outlook.
3.4 Structural Correction of Korea’s Valuation Discount
As of July 8, 2026, the KOSPI’s forward P/E ratio stood at approximately 6.17x; excluding Samsung and SK Hynix, the Korean market’s 12-month and 24-month forward P/E ratios were 10.1x and 8.6x, respectively.The Korean market is extremely undervalued, primarily due to the combination of high profits and low multiples in memory-heavy stocks such as Samsung and SK Hynix.SK Hynix’s decision to list in the U.S. effectively represents an attempt to partially decouple its valuation from 'Korean market pricing.'The significant first-day premium suggests the market at least acknowledges the necessity and partial effectiveness of this move.。Furthermore, if SK Hynix is subsequently included in the MVIS US Listed Semiconductor 25 Index, its weight cap within the SMH framework could reach approximately 5%, translating into estimated passive inflows of roughly $3.5–3.8 billion; inclusion in SOXX would imply inflows of around $200 million or less. Anticipation of index inclusion also serves as a significant sentiment amplifier.
🔍 IV. Implications for the Semiconductor Industry
4.1 The company now has access to a larger capital pool and a higher valuation anchor.
The deeper significance of this listing lies in the upgrade of its capital structure and investor base.Proceeds will primarily fund Yongin Fab 1, Cheongju P&T 7, and advanced equipment procurement, strengthening HBM and advanced DRAM production capacity.In a CNBC interview, SK Chairman Chey Tae-won stated that beyond the advanced packaging facility in Indiana, the company is evaluating additional U.S. investment opportunities and would consider building a memory manufacturing plant if conditions are favorable; he also announced potential AI data center and related technology investments on the scale of tens of billions of dollars.
4.2 The global capitalization pathway for semiconductors is undergoing restructuring.
Historically, valuations of many leading Asian semiconductor firms were constrained by local liquidity and investor base structures.The success of SK Hynix’s ADR demonstrates that top-tier semiconductor assets can absolutely secure new valuation benchmarks and access a much larger pool of capital through U.S. capital markets. This is especially important for Korean tech companies—if their assets are sufficiently core and their investment story is global enough, the U.S. market is willing to absorb and reprice them.
4.3 Equipment, materials, and packaging segments will receive second-order catalysts
The use of raised capital is very clear: fabs, packaging, EUV tools, and advanced equipment.The capital chain linking AI memory financing → capacity expansion → equipment orders has now been established, directly enhancing order visibility for upstream equipment and materials suppliers and generating a second-order catalytic effect across the entire semiconductor supply chain.
🔍 5. ADR arbitrage pathway: Can the premium disappear?
In the initial listing phase, the effective ADR issuance quota accounted for only 2.5% of the company’s total shares outstanding, and this quota has already been largely utilized. The widely cited conversion cap of 15%–20% stems from an analogy with SK Hynix’s Frankfurt-listed GDR rules—where the conversion cap is set at 20%, though only 9% has been used so far. The market previously speculated that the Nasdaq ADR might adopt a similar ratio.
The standard theoretical arbitrage path is: buy ordinary shares in Korea → deposit them with KSD to request ADR creation → wait 3–5 trading days for conversion to complete → sell the ADRs in the U.S. to lock in the price differential.However, due to the strict 2.5% cap on new ADR creation from Korean shares, there was virtually no remaining capacity in the early listing phase. Only when existing ADR holders redeem their holdings can new slots become available—meaning that while a price gap exists, it does not necessarily imply immediate arbitrage opportunities.This aligns with the long-standing logic behind TSMC ADRs consistently trading at double-digit premiums—In a one-way constrained market, premiums become institutionalized rather than arbitraged away.
For comparison: in freely convertible markets, Chinese ADRs are a typical example—fully bidirectional conversion with no hard quotas, allowing price gaps to be quickly arbitraged back, resulting in near-parity over the long term.The premium on SK Hynix ADRs essentially reflects three bets: ADRs are more convenient to hold and face stronger overseas demand; conversion from Korean-listed shares to ADRs is restricted, limiting supply from adjusting quickly; thus, the ADR's premium over Korean shares is unlikely to disappear and may even widen.Sources of trading returns include: continued outperformance of the ADR versus Korean shares; U.S. investors persistently paying a higher liquidity premium; and index inclusion, ETFs, options, leveraged ETFs, and other instruments continuously amplifying demand on the U.S. side.
⚠️ Risk Warning
Key sources of risk in ADR trading include:
· Unexpected narrowing of the premium; marginal increase in ADR supply
· Difficulty borrowing Korean shares for shorting or rising securities lending costs
· Exchange rate volatility eroding the price differential
· Time-zone differences between markets preventing real-time hedging
· U.S. SEC Rule 105 and short-selling restrictions during the IPO phase
· Significant price volatility during the 3- to 5-day conversion period
💡 VI. Future Outlook
ADRs will maintain a double-digit premium over Korean-listed shares in the long term; Korean shares will be pulled upward by ADRs rather than marginalized, gradually rising due to arbitrage-related lock-ups and valuation re-rating. When discussing SK Hynix, the market will increasingly look at the ADR first, then the Korean-listed shares.Once this occurs, pricing dominance will have completed its most critical shift.
From a continuous tracking perspective:
· Medium- to long-term allocation-oriented tracking: $VanEck Semiconductor ETF (SMH.US)$takes precedence over $iShares Semiconductor ETF (SOXX.US)$。 If SK Hynix is subsequently included, $VanEck Semiconductor ETF (SMH.US)$ Offers more direct exposure and higher exposure to global leaders.
· Thematic rotation tracker: $Roundhill Memory ETF (DRAM.US)$。 Suitable for observing market risk appetite toward the storage sector, but may not be ideal for large-position holdings.

Sources: Xin Lu Xin Yu, Sina Finance, Wei Ce Shen Ji, TECHSTOCK, invezz.com, Zeng Guan Shi Jing
[Investment Advisory Information]
Yu Shilin, Licensed Representative, CE Number: ATQ882
[Disclaimer]
This report is prepared by Futu Securities International (Hong Kong) Limited (“Futu Securities”). Without the prior written consent of Futu Securities, this report and the information contained herein may not be (i) reproduced, copied, or stored in any form, or (ii) directly or indirectly distributed or transmitted to any other person for any purpose. The information in this report is derived from sources that Futu Securities believes to be accurate and reliable as of the date of publication. However, this report is not intended to contain all information required by investors and may be subject to delays, obstructions, or interceptions in delivery. Futu Securities does not expressly or impliedly warrant or represent the adequacy, accuracy, completeness, reliability, or fairness of such information or opinions. Accordingly, Futu Securities and its affiliates (collectively, the “Futu Group”) shall not be liable for any losses of any kind (including, but not limited to, direct, indirect, or consequential losses) arising from any actions taken by third parties relying on the contents of this report. The views, recommendations, suggestions, and opinions expressed in this report do not necessarily reflect the positions of Futu Securities or its affiliates and are subject to change without notice. Futu Securities has no obligation to update any information or opinions contained herein. This report is provided for general informational purposes only and is intended solely for the general reference of Futu Securities’ clients, without regard to any specific recipient’s investment objectives, financial situation, or particular needs. Nothing in this report constitutes or should be construed as an offer, recommendation, or solicitation by any member of the Futu Group to buy or sell any securities, investments, or other financial instruments. It should not be interpreted as an offer or invitation to purchase or sell securities. Any decision to purchase securities mentioned in this research report should take into account publicly available information, including relevant prospectuses. The products referenced in this report may not be suitable for all investors; readers should fully consider relevant factors and seek professional advice before making any investment decisions. This report is provided to recipients on the basis that they are capable of independently evaluating investment risks and exercising independent judgment regarding investment decisions. In certain jurisdictions or countries, the distribution, issuance, or use of this report may violate local laws, regulations, rules, or registration or licensing requirements. This report is not intended for distribution to, or use by, any person or entity in such jurisdictions or countries. Hong Kong investors with questions regarding Futu Securities’ research reports should contact Futu Securities directly. The Central Entity (CE) number of the author’s SFC license is disclosed next to the author's name on the front page of this report. The analyst primarily responsible for preparing this report confirms that: (i) the opinions expressed in this report accurately reflect his/her personal views about the listed corporations covered in the report; and (ii) none of the compensation he/she has received, currently receives, or will receive—directly or indirectly—is linked to the specific recommendations or views expressed in this report. The analyst further confirms that neither he/she nor any related parties have traded the securities of the listed corporations covered in this report during the 30 calendar days prior to, or within three business days following, the publication of this report. The analyst and any related parties do not serve as senior management of the listed corporations covered in this report and hold no financial interest in them. In this report, Futu Securities holds no financial interest equal to or exceeding 1% of the market capitalization of the listed company and has had no investment banking relationship with the company in the past 12 months. None of our employees are employed by the listed company.
Risk Disclaimer: The above content only represents the author's view. It does not represent any position or investment advice of Futu. Futu makes no representation or warranty.Read more

Comments
to post a comment
1
3