
Bullish Tech Intel Bureau | No Longer Bitcoin’s “Shadow”! The Valuation Reset and Technical Dynamics Behind Robinhood’s Over 50% Rebound Since May
On April 29, 2026, Robinhood released its Q1 earnings report, showing a 47% year-over-year plunge in crypto revenue and total trading revenue falling $100 million short of analyst expectations. The stock dropped 11% in after-hours trading. Judging solely by market reaction, this was a disappointing earnings report.
However, if you dig into the details, three points merit closer consideration:
1. Gold subscription members reached 4.3 million,up 36% year-over-year,with 40% of new customers signing up directly as Gold members
2. Margin lending balance stood at $17 billion,up 93% year-over-year, setting a new all-time high
3. Prediction market trading volumehit a new all-time high
crypto revenue is cyclical,whereas incremental revenue from subscription memberships and prediction markets is structural.However, the market’s valuation logic for Robinhood remains anchored in the 'crypto revenue proxy' narrative, which—viewed today—represents a significant mispricing.
At the end of May, $Robinhood (HOOD.US)$ it halted its decline near $73 (down 27% from its year-to-date high) and began a rebound trend. Last Thursday (July 2), it briefly surged toward the $120 psychological level during trading but failed to break through, closing at $112.73. The overall upward rebound trend remains intact.
Many believe Robinhood's recent rally was entirely driven by Bitcoin's rebound, but that’s not actually the case. While Bitcoin was indeed around $80,000 at the end of May, it dropped 19.8% in June and fell below $60,000 by month-end.As Robinhood’s stock rose from $73 to $110, Bitcoin moved in the opposite direction, indicating that Robinhood’s share price is no longer solely driven by Bitcoin’s performance in a 'single-track' manner.
First signal: WonderFi closing
On June 1, Robinhood announced the completion of its acquisition of Canadian crypto platform WonderFi for approximately $180–250 million, adding around 300,000 Canadian crypto users. Combined with prior expansions into the UK and Europe, Robinhood International now has over 1 million funded accounts—This has transformed Robinhood’s internationalization from a concept into trackable operational metrics.
Key catalyst: The explosive growth of World Cup prediction markets
In a report published in June, Bernstein analyst Gautam Chhugani stated:Robinhood’s prediction market revenue is projected to reach $586 million in 2026, a 286% increase from $150 million in 2025.
This is not just a long-term projection—it is backed by real data. Fueled by the intense excitement around the 2026 World Cup, Kalshi, the industry-leading prediction market platform, recorded $5.1 billion in weekly trading volume during the first week of the tournament. Trading volume surged in June, exceeding $31 billion for the month; Polymarket reported $10.8 billion in monthly trading volume in June, with a single World Cup winner contract surpassing $3 billion in volume; Rothera, Robinhood’s joint prediction market venture with Susquehanna International Group, recorded $2 billion in notional trading volume in June alone, capturing 7% of the prediction market’s total share.
Market acceleration: 'The World is Flat' Global Strategy Launch Event
At this event, Robinhood unveiled a comprehensive suite of products redefining the company’s strategic positioning, including Robinhood Chain, Stock Tokens, Agentic Trading, Robinhood Earn, and Robinhood’s geographic expansion plans.Successfully shifted the market's valuation framework for Robinhood from a 'U.S. retail brokerage' to a 'global fintech and DeFi infrastructure platform.'
Collective upward momentum from Wall Street
Multiple institutions have collectively raised their price targets for Robinhood: Mizuho lifted its target from $115 to $130 (maintaining an 'outperform' rating), stating that Robinhood has the potential to become the 'first truly global online brokerage hyperscaler'; BTIG reaffirmed its buy rating with a $125 price target; Piper Sandler also maintained its buy recommendation with a lofty $135 target; and Goldman Sachs raised its target to $121.
In summary, the rally from $73 to $110 was not driven by a Bitcoin rebound or favorable policy developments, but rather by structural changes within the company itself.The following will systematically review Robinhood’s recent price action patterns and key technical levels from a technical perspective.
Robinhood (HOOD)

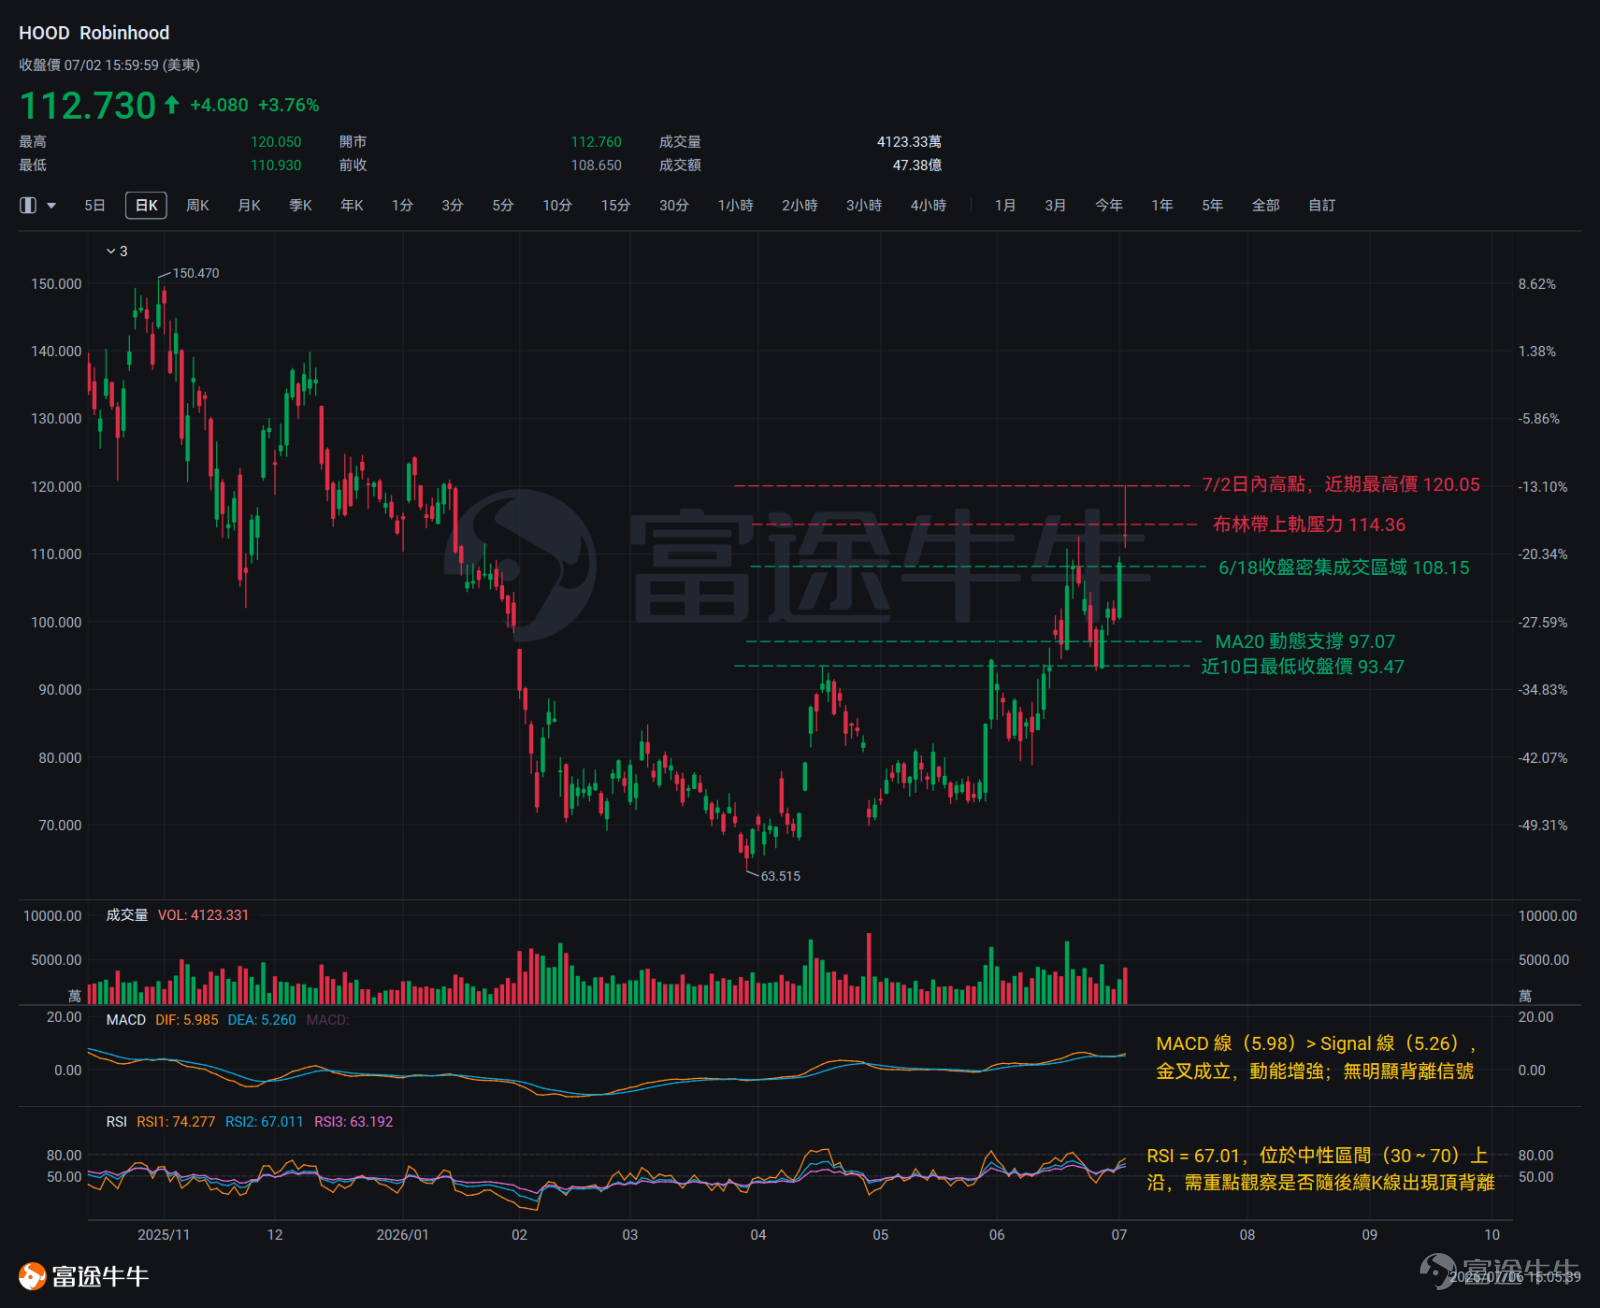
From an overall structural perspective,Robinhood’s short- to medium-term trend remains firmly bullish.The current share price of $112.73 has clearly moved above both the 20-day moving average ($97.07) and the 50-day moving average ($86.58). Both moving averages are sloping upward in a bullish alignment, indicating a clear directional trend. In terms of momentum, the stock rebounded over 29% in less than two weeks—from the June 25 low of $92.80 to the July 2 high of $120.05.Bullish conviction is notably strong.
The bottoming structure on the candlestick chart has now been confirmed twice.On June 25, a classic hammer candlestick formed—opening at $98.79, dipping as low as $92.80, and closing at $93.47, clearly indicating bullish intent to take control. Entering July, technical indicators began showing notable top-warning signals. On July 2, the stock opened at $112.76 and closed at $112.73, with a lower shadow of approximately $1.80 and an upper shadow stretching about $7.32—bulls pushed the price up to $120 intraday, only to be strongly rejected by bears by the close, forming a pattern resembling a shooting star. This formation occurred near a short-term relative high.This carries bearish top-warning significance. Close attention should be paid to whether the price decisively breaks below the $112.73 level in subsequent sessions; if such a breakdown has not yet been confirmed, there remains a probability that the current uptrend will continue.
Key Technical Indicators Interpretation
Moving Average (MA):The 20-day moving average (MA20) stands at $97.07, and the 50-day moving average (MA50) at $86.59; MA20 has crossed above MA50, forming a golden cross, with both lines sloping upward in a bullish alignment. However, the price is significantly extended above the moving averages, warranting caution regarding mean-reversion pressure.
RSI:The current RSI reading is 67.01, sitting near the upper boundary of the neutral range (30–70). Over the past 10 trading days, the closing price has rebounded from $93.47 to $112.73, reflecting sustained upward momentum. Watch for potential RSI bearish divergence as new candles form.
MACD:The MACD line (5.98) is above the Signal line (5.26), confirming a golden cross with strengthening bullish momentum; no clear divergence signal is present.
Bollinger Bands:The current share price of $112.73 lies between the middle Bollinger Band ($97.07) and the upper band ($114.36), just $1.63 away from the upper band. Dynamic resistance exists near the upper band; monitor whether the price can sustain a close above it upon testing.
Technical Comprehensive Analysis
On the support side,The first line of support sits at $110.93 (the intraday low on July 2).If this level is breached,watch for buying support around $108.15.—This zone aligns with the upper edge of the closing price congestion band from around June 18, representing the primary turnover area over the past 10 days. If this level holds effectively, it could serve as a reference signal marking the end of a short-term pullback. Deeper support lies further below.The medium-term core support lies at the dynamic 20-day moving average of $97.07; the bottom protection zone is between $93.47 and $92.80 (the low range seen on June 25), which marked the starting point of this rebound and serves as the decisive support range for bulls versus bears.
On the resistance side,The upper Bollinger Band at $114.36 acts as the near-term dynamic resistance level,which the stock price is highly likely to test in the short term. If it touches this level but fails to close above it, caution toward a potential pullback is warranted; conversely,if the price can decisively break above and close firmly above $114.36, upside room could open further. The next key level to watch is the absolute high of $120.05 reached on July 2. Should prices stabilize above $120.05, prior top-warning signals would automatically become invalid, significantly increasing the probability of an accelerating uptrend.

Risk Disclaimer: The above content only represents the author's view. It does not represent any position or investment advice of Futu. Futu makes no representation or warranty.Read more


Comment (1)
to post a comment
22
27