
SAP's earnings ignite software stocks! Is capital rotating from 'hard' to 'soft' again?

Niu Niu Tech Intelligence Bureau | Meta's move to sell computing power reignites concerns over AI capital spending—could this be an opportunity for software stocks like Microsoft and Palantir?
On July 1, U.S. software stocks staged a collective rebound, with notable names including $Palantir (PLTR.US)$ surging 7.77% in a single day, $Microsoft (MSFT.US)$ and others rallying more than 3%.The real catalyst behind this software rally wasn’t positive news from any individual software company, but rather a piece of news that initially appeared unrelated to the software sector— $Meta Platforms (META.US)$announced plans to sell its idle AI computing capacity.
Why did this news cause such a significant market impact?
Because it undermined the central assumption underpinning AI hardware trades over the past year: that computing power is absolutely scarce, and tech giants’ capital expenditures can only keep rising. Once this assumption starts to erode, the entire valuation framework for the AI hardware supply chain must be reassessed. More specifically, the 'Meta selling compute capacity' event essentially sent a critical signal to the market:The focal point of the AI value chain is shifting from 'building infrastructure' to 'monetizing infrastructure.'Over the past two years, the core market logic pricing the semiconductor sector (SMH) has been that hyperscale cloud providers would continue to ramp up AI infrastructure spending at an exponential rate for multiple years. SMH’s valuation embeds substantial expectations of 'unlimited capex expansion.'As this expectation begins to waver, capital will inevitably seek new valuation anchors—and software companies previously oversold amid the 'capex arms race' narrative will have an opportunity to re-enter institutional focus.
More in-depth analysis of related developments:"Meta’s ‘Selling Compute Power’ Shakes AI Trades! Examining Short-Term Dynamics: Is It a ‘False Sell-Off’ or a Genuine ‘Inflection Point’?"
Another subtle aspect of this software sector rebound is its timing: July 1.
Due to quarter-end portfolio rebalancing effects, institutions were busy adjusting positions and had not yet begun establishing new ones;July 1 marks the start of Q3—the very moment when large funds can redeploy capital, making the deeply oversold software sector relatively attractive.
A key technical inflection point for the software sector occurred around June 25: $iShares Expanded Tech-Software Sector ETF (IGV.US)$ A breakdown below the $76 double support level triggered a concentrated release of bearish sentiment—Short sellers entered while long positions stopped out, forming a classic 'false breakout' structure.Subsequently, IGV began a strong rebound on June 26, reclaiming $76 and forming a textbook bear trap reversal.
For the software sector, the first half of 2026 will be an extremely painful period of valuation reset—while the second half may bring these companies their long-awaited rally. Below, we will analyze the current technical structures and key near-term levels to watch for popular software stocks Palantir and Microsoft.
Microsoft (MSFT)
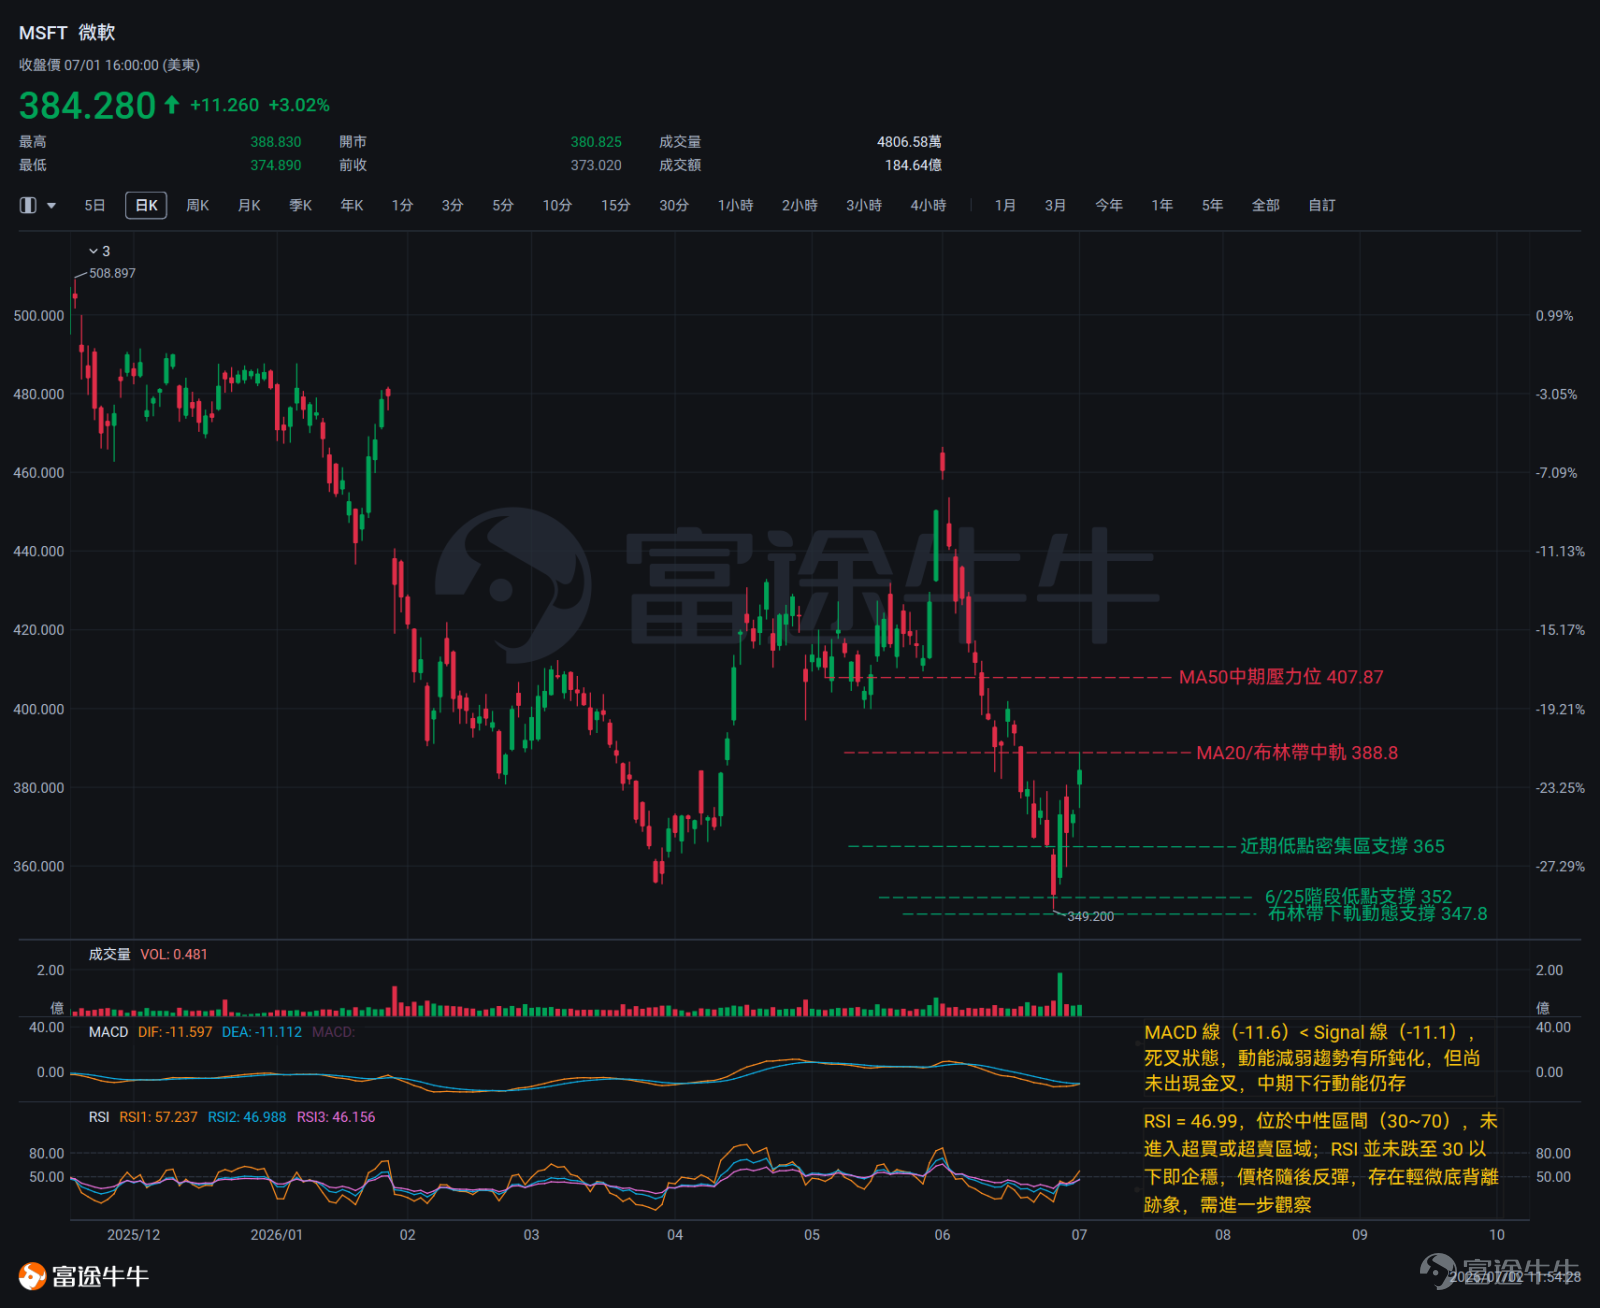
Microsoft’s medium-term trend remains in a bearish downtrend dominated by sellers.The current price of $384.28 sits below both the 20-day moving average ($388.80) and the 50-day moving average ($407.87), with moving averages in a classic bearish alignment. The MACD has been in a prolonged death cross and trading below the zero line, indicating significant medium-term bearish pressure. Regarding Bollinger Bands, the price is positioned between the middle and lower bands, suggesting short-term volatility has not yet compressed.
However, the stock’s price action over the past four trading sessions is forming a bottoming structure worthy of attention. On June 25, a long-bodied bearish candle closed at $352.83,confirming the final leg down of this phase.The following day (June 26) immediately formed a bullish engulfing pattern—with the bullish candle’s body fully covering the prior day’s bearish body, accompanied by increased volume, delivering a relatively strong reversal signal from the lows.Although a candle with a long lower wick appeared on June 29, the price on June 30 did not break below the June 25 low of $352.83, meaning the bearish setup failed to confirm.
On July 1, the stock briefly rallied to $388.83, precisely testing the confluence of the 20-day moving average and the Bollinger Bands’ middle band before pulling back, ultimately closing at $384.28 and forming a bullish candle with a pronounced upper wick.Whether a confirmed pullback occurs the next day is a key observation point for determining if the current short-term rebound has topped out.
Overall,Recently, Microsoft’s price action has formed a structure of 'bullish engulfing support at lows—sideways consolidation near the bottom—rebound meeting resistance—awaiting confirmation after resistance.' The medium-term downtrend has not yet reversed, but bulls and bears are currently locked in a tug-of-war around the 20-day moving average (MA20) at $388.8.
Key Technical Indicators Interpretation
Moving Average (MA):MA20 = $388.8, MA50 = $407.87; the moving averages are in a bearish alignment (MA20 below MA50), and the share price is trading below both averages, indicating the medium-term bearish structure remains intact.
RSI:The current RSI reading is 46.99, within the neutral range (30–70), and has not entered overbought or oversold territory. Compared to the recent low (around $352.83 on June 25), the RSI did not fall below 30 before stabilizing, and the stock subsequently rebounded—showing a mild bullish divergence (price made a new low while RSI did not reach a deeper oversold level). Further observation is needed.
MACD:The MACD line (-11.6) is below the Signal line (-11.11), maintaining a bearish crossover. While the pace of momentum deterioration has slowed, medium-term downside momentum still persists.
Bollinger Bands:The current share price of $384.28 sits between the Bollinger Bands’ middle band ($388.8) and lower band ($347.8), in the lower-middle region. Volatility is in an expansion phase and has not yet contracted, implying significant short-term price swings remain possible.
Technical Comprehensive Analysis
On the upside,$388.8 is the immediate resistance level,serving as dual resistance from both the 20-day moving average and the Bollinger Band middle band. The price touched this level intraday on July 1 but pulled back. If the closing price in subsequent sessions can effectively break above and hold above $388.8, the short-term structure could extend its upward move.Watch the recent high-concentration zone near $390 for potential extension; the medium-term recovery target is at $407.87 (50-day MA).It should be noted that under the current medium-term bearish alignment, a single-day breakout still requires confirmation through increased trading volume.
On the downside,the area around $373 is the most critical short-term support zone recently—closing prices on June 23, 29, and 30 clustered within the $368–$374 range, creating significant accumulation through dense turnover.If this zone is breached, Microsoft will face downward pressure toward $352.83 (the June 25 low); $352.83 represents the most crucial structural support recently—if broken, the lower Bollinger Band at $347.8 will become the next dynamic reference level.
Palantir (PLTR)
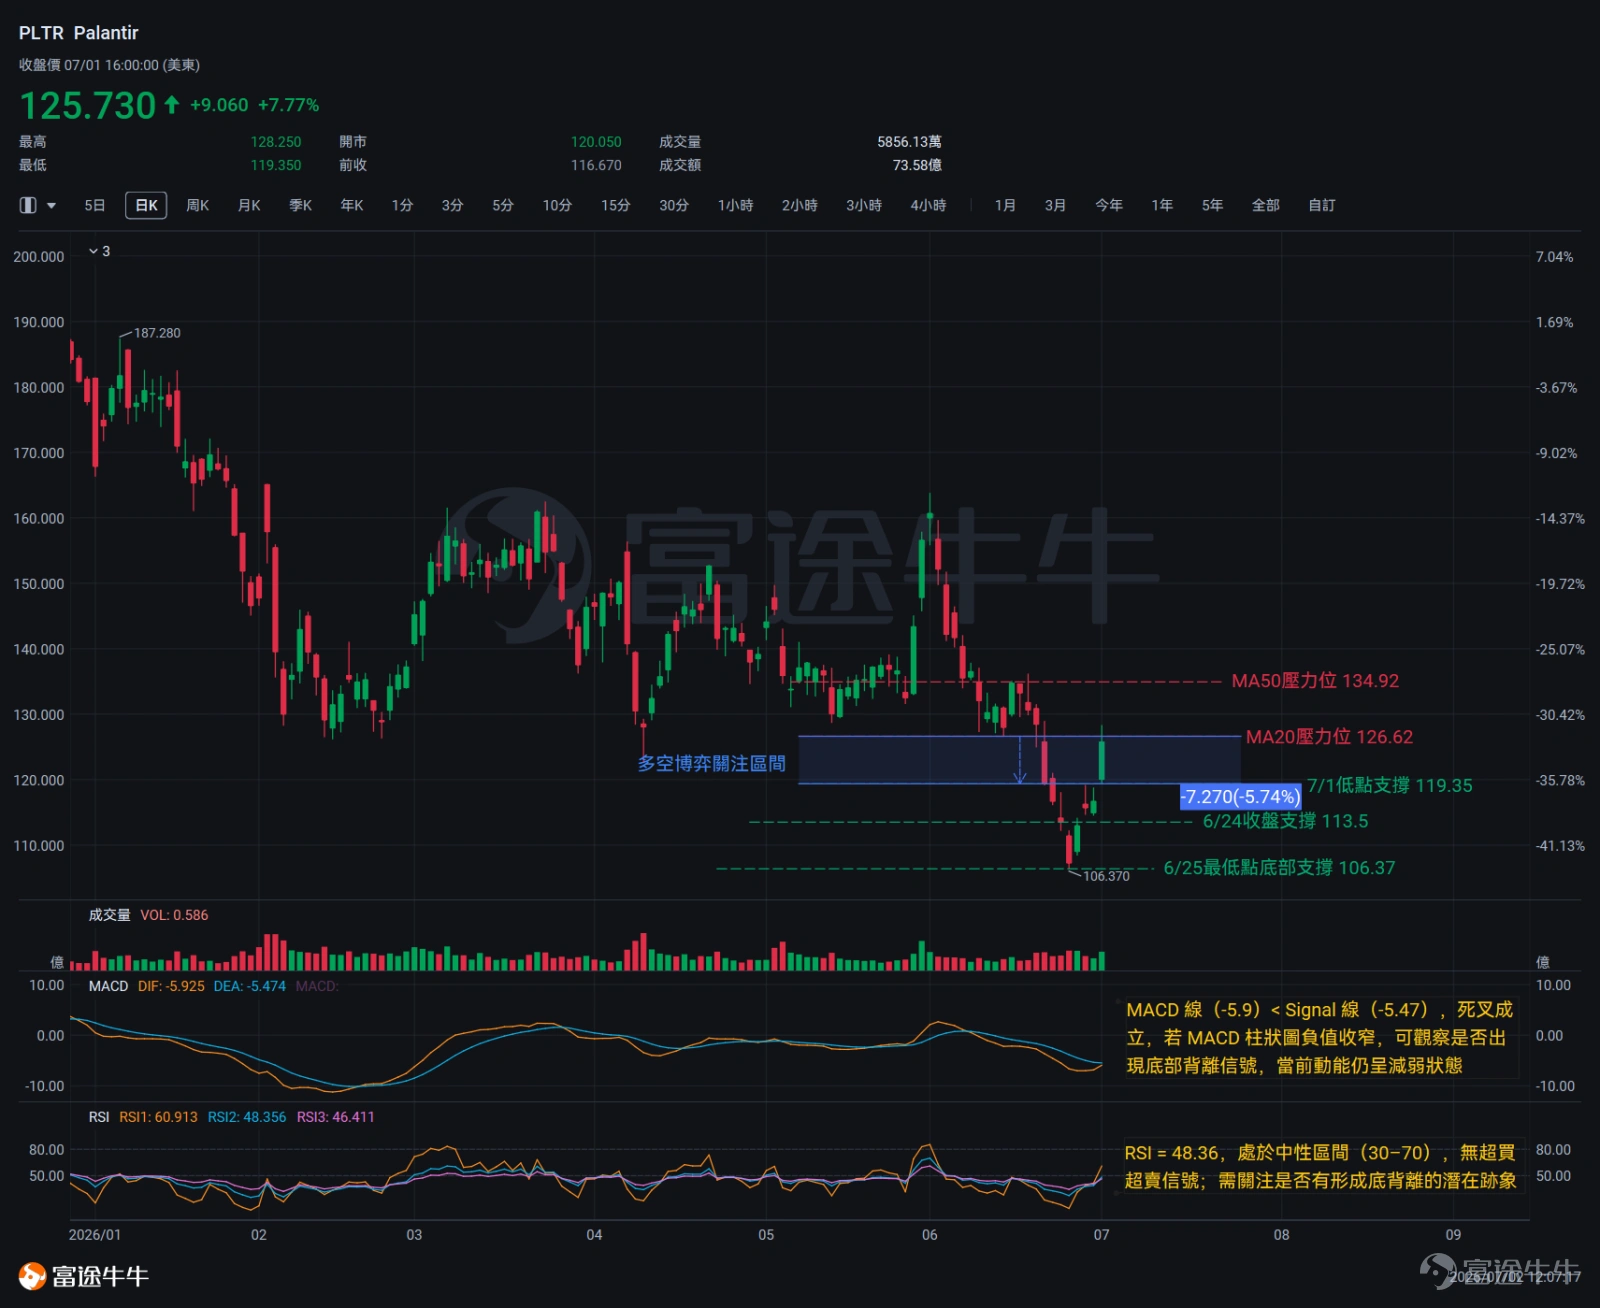
Palantir also remains in a medium-term bearish trend.The current price of $125.73 sits below both the 20-day MA ($126.62) and the 50-day MA ($134.92), with moving averages maintaining a bearish排列; the MACD remains in a long-term death cross and trades below the zero line; price is positioned between the middle Bollinger Band ($126.62) and the lower band ($106.91), with no clear reversal signal yet established.
The pattern formed by the last 10 daily candlesticks is highly informative. From June 17 to 25, six consecutive bearish candles drove the downtrend, with four of them—from June 22 to 25—sequentially making new lows ($119.5 → $116.7 → $113.5 → $107.27),during which bears fully dominated the momentum.On June 25, it hit a low of $106.37, confirming a阶段性 extreme.
A turning point emerged on June 26:The stock opened at $109.04 that day, dipped to a low of $108.47, and closed at $112.93, forming a small-bodied candle with a relatively long lower shadow—a hammer-like pattern. This formation near a short-term low suggests potential bottoming signals; however, the small real body requires confirmation from subsequent price action. Although the market closed lower on June 29, it did not break below the June 25 low of $106.37, so the bearish pattern remains unconfirmed.
On July 1, the stock gapped up at the open to $120.05, reached an intraday high of $128.25, and closed at $125.73, forming a strong bullish candle,which is the most robust signal in recent price action,yet attention should be paid to the upper shadow between the high of $128.25 and the close of $125.73, indicating notable selling pressure in the $126–$128 range,as bulls failed to sustain gains above the 20-day moving average (MA20) at $126.62 after testing it.
Overall pattern analysis suggests thatRecently, Palantir has formed a price structure characterized by 'a sharp decline to test lows—bottom support—news-driven rebound.' However, the upper shadow on July 1 highlights the $126–$128 zone as near-term resistance, and the latest closing price on July 1 has yet to surpass the MA20, leaving the sustainability of this rebound subject to further confirmation.
Key Technical Indicators Interpretation
Moving Average (MA):MA20 = $126.62, MA50 = $134.92; the current price trades below both moving averages, reflecting a bearish alignment (MA20 < MA50 and price < MA20). Although the short-term moving average shows signs of turning upward, the death cross configuration has not yet been resolved.
RSI:The current RSI stands at 48.36, within the neutral range (30–70), showing no overbought or oversold signals; watch for potential signs of a bullish divergence.
MACD:The MACD line (-5.9) is below the Signal line (-5.47), confirming a bearish crossover. However, given the recent rebound in share price from $107 to $125, if the MACD histogram’s negative values narrow, watch for a potential bullish divergence signal. Momentum remains in a weakening state.
Bollinger Bands:The middle Bollinger Band is at $126.62 and the lower band at $106.91, with the stock price trading between them. Volatility is in an expansion phase and has not yet entered a contraction stage. The price has rebounded from near the lower band toward the middle band, making the middle band’s resistance the key level to monitor.
Technical Comprehensive Analysis
$126.62 (20-day moving average / middle Bollinger Band) is the immediate breakout target.The current closing price has not yet firmly closed above this level. If $126.62 is breached and sustained,the next resistance to watch is $128.25 (the intraday high on July 1, a short-term congestion zone);if market sentiment continues to improve,the medium-term recovery target is $134.92 (50-day moving average),but given the prevailing downtrend has not yet reversed, each resistance level requires confirmation via a breakout on rising volume to be considered valid.
$119.35 (the intraday low on July 1) is the most critical short-term support within the recent rebound structure.—If this level is breached, it implies the low of the strong bullish candle on July 1 has been broken, damaging the integrity of the rebound structure and raising the risk of a retest of recent lows. Looking further down,$113.50 is a repeatedly tested zone near the June 24 closing price; if this level is breached, downside pressure toward $106.37 (the intraday low on June 25) will re-emerge. Should $106.37 be lost, the lower Bollinger Band near $106.91 would become the sole dynamic support reference.
Risk Disclaimer: The above content only represents the author's view. It does not represent any position or investment advice of Futu. Futu makes no representation or warranty.Read more


Comments
to post a comment
18
55