
SpaceX officially joins the Nasdaq 100—can it spark a rebound rally?

Bullish Tech Intel Briefing | SpaceX Countdown to Nasdaq Inclusion! Has a 12% Plunge Created a 'Golden Pit'?
Over the past two weeks,$SpaceX (SPCX.US)$ it has experienced volatile trading since its IPO: an initial sharp selloff from its peak sparked market concerns, followed by a boost from news of its inclusion in the Nasdaq-100, leading to visibly divergent investor sentiment in the current price range.
The most explosive catalyst was undoubtedly the official announcement by Nasdaq on June 26—SpaceX will officially join the Nasdaq-100 index on July 7, 2026.Market estimates suggestthis adjustment will trigger approximately $4.3 billion in forced passive buying.On the trading day following the announcement (June 29), SPCX gained strength in pre-market trading, and call option buyers rushed in, propelling the stock to rebound sharply from its recent low-volatility range.
In the meantime,SpaceX completed its first bond offering since going public from June 22 to June 26,—a total of $25 billion issued in five tranches, with coupon rates ranging from 5.35% to 6.65% and maturities spanning from 2031 to 2056.
On the operational front,SpaceX is engaged in advanced talks with Charter Communications regarding mobile phone collaboration,expectations of convergence between satellite communications and mobile internet continue to gain traction among institutional investors. Meanwhile, Rocket Labit announced an $8 billion acquisition of Iridium Communications, intensifying the wave of satellite-communications mergers and acquisitions and driving a broad-based rebound across space-related equities.
Below is a technical breakdown of SPCX’s current price structure and key levels.
SpaceX (SPCX)

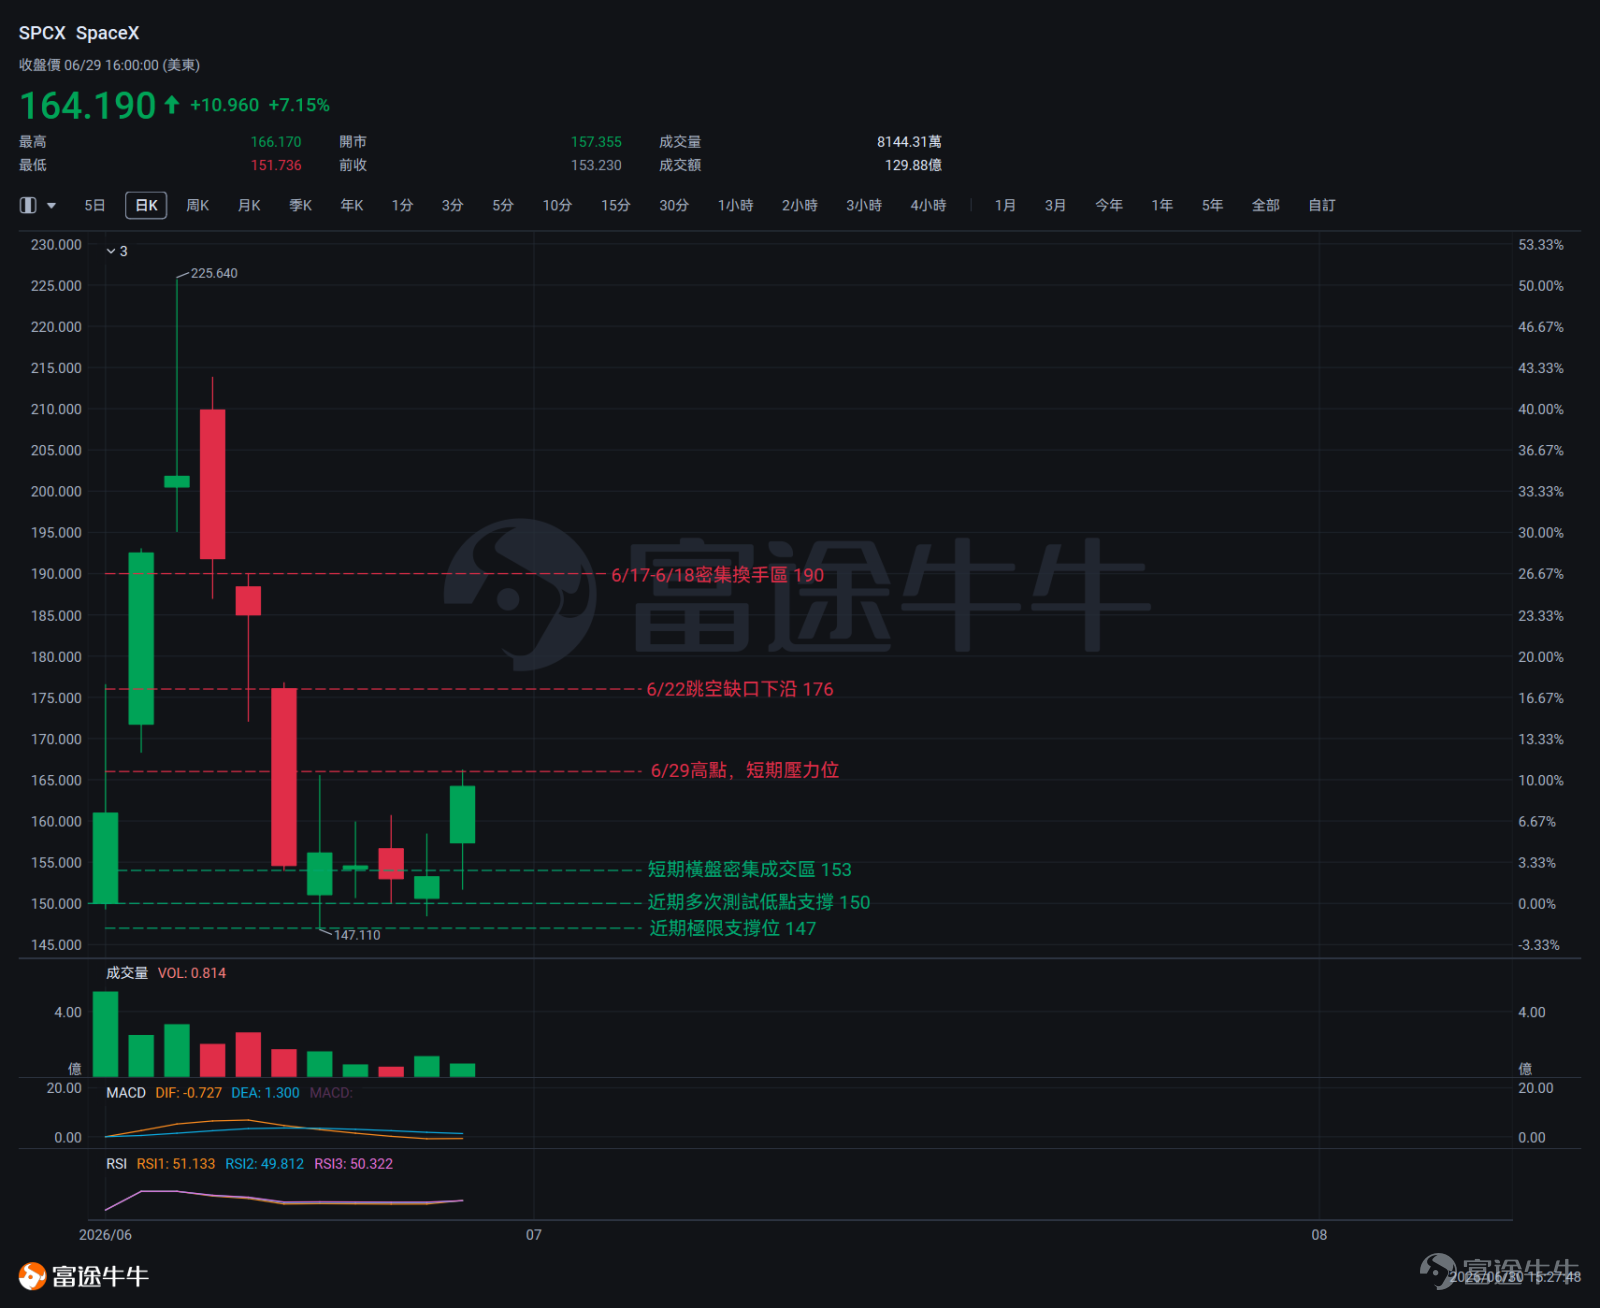
On June 22, a large bearish candle with virtually no upper shadow confirmed SpaceX's short-term accelerating downtrend:Opening near $176 and closing at $154.60, bears dominated throughout the session, resulting in a single-day decline of approximately 12%.
This was followed by a consolidation phase as prices stabilized.On June 23, a hammer-like pattern emerged: the price briefly tested a low of $147.11 before closing around $156.11, with the lower shadow roughly 1.8 times the length of the real body. After aggressive selling pressure, buyers stepped in to push the price back up, signaling a potential bullish reversal—though confirmation via subsequent bullish candles is still needed. From June 24 to 26, the stock traded sideways within a narrow range between $153 and $154.54. The three candlesticks during this period featured small real bodies and prominent upper and lower shadows, reflecting significant market indecision, with directionality remaining unclear.
On June 29, a bullish candle opened near the lower end of the recent consolidation zone (with a low of $151.73) and closed strongly at $164.19—the largest gain seen in this consolidation period. Its long lower shadow indicated persistent buying support at lower levels.Overall, between June 22 and June 29, multiple intraday lows clustered within the $147.11–$151.74 range, forming the early structure of a Tweezer Bottom—a pattern typically appearing near the end of a downtrend, suggesting that sellers are losing momentum and buyers are stepping in with strong support.If the price tests the $150 level again and holds firm, the validity of this pattern will be further reinforced.Although the medium-term structure remains bearish, short-term stabilization signals have now emerged; however, breakout confirmation still requires further observation.
Bullish and Bearish Signal Interpretation
Bullish signals:
[June 23 Hammer Candle at Low]Following a sharp decline, a candle with a lower shadow longer than its real body appeared, indicating that bearish pressure failed and bulls pushed the price back up.
[$150 support tested multiple times without breaking]From June 23 to 26, the lows of four consecutive daily candles all failed to decisively break below the $147–$150 zone, indicating strong buying interest on repeated tests
[Strong bullish candle on June 29 pulling up from lows]The price dipped to $151.7 that day before closing at $164.19, marking the largest bullish candle in the recent consolidation range and signaling short-term buying interest
Bearish signals:
[Large bearish candle on June 22]Sellers dominated throughout the session, with a single-day decline of approximately 12%, reflecting strong bearish momentum
[Significant resistance zone overhead]Heavy overhead supply looms above, with notable resistance levels at $176, $190, and $225; any rebound will need to absorb substantial selling pressure
[Successive lower highs]$225.64 → $213.80 → $176.75 → $166.17 — highs have been consistently declining, with no higher high formed
Technical Comprehensive Analysis
At the current stage,USD 150 is the most critical support level for bulls.From June 23 to 26, the lows of four consecutive candlesticks all fell within the range of USD 147.11 to USD 150.72. Despite repeated tests, prices have not decisively broken below this zone, forming a solid base of support backed by concentrated buying interest.There is also some accumulation of positions near USD 153. From June 24 to 26, closing prices clustered between USD 153 and USD 154.54, indicating concentrated short-term holding costs in this area, which serves as a secondary support reference level.
On the upside, key resistance levels include:USD 166.17 is the nearest resistance level (the intraday high on June 29).Upon a confirmed breakout above this level,the next target is around USD 176,near the lower edge of the recent gap. Filling this gap would require clear volume confirmation;The USD 190 area corresponds to a high-volume consolidation zone from June 17–18, where trapped long positions are heavily concentrated, posing significant resistance to any potential rebound.
Overall, ifThe key level at USD 150is being tested again and holding; monitor the strength of any rebound and changes in trading volume;If it breaks below USD 150 and closes firmly under that level, be alert to further downside risk, with the next reference level around USD 147. If the resistance at USD 166.17 is decisively breached on strong volume, watch whether the gap up to USD 176 can be filled and how supply is absorbed in the dense zone near USD 190.

Risk Disclaimer: The above content only represents the author's view. It does not represent any position or investment advice of Futu. Futu makes no representation or warranty.Read more


Comments (8)
to post a comment
51
52