
SAP's earnings ignite software stocks! Is capital rotating from 'hard' to 'soft' again?

Futubull Volatility Hunter | Microsoft Surges Over 5% in a Single Day: When Bull-Bear Divergence Fuels Volatility, How Does 'Smart Money' Position Itself?
Hello everyone, and welcome to this week's 'Bullish Volatility Hunter'.
$Microsoft (MSFT.US)$ The stock’s trajectory in 2026 caught the market off guard. Shares tumbled from a record high of around USD 550 to a recent low near USD 350,down more than 35% year-to-date, with an additional drop of over 20% in June alone.—marking Microsoft’s worst quarterly performance since 2000.
The core narrative behind the sell-off isn’t complicated:AI infrastructure spending is burning cash far faster than the market anticipated, yet the results so far have failed to convince investors.FY2026 Q3 earnings showed revenue of $82.8 billion, beating expectations, and Azure growth of 40% appeared impressive on the surface. However, the Q4 capital expenditure guidance exceeded $40 billion, pointing to a record annual capex of $190 billion, prompting an immediate market sell-off.
Meanwhile, prominent short-seller Michael Burry turned bullish on Microsoft, calling the drop to USD 350 a prime buying opportunity. Of the 35 Wall Street analysts covering the stock, 34 still maintain a 'buy' rating, with an average price target of USD 563.53—implying nearly 50% upside potential. This sharp internal divergence has made Microsoft one of the most fiercely contested battlegrounds between bulls and bears in the tech sector today.
Bullish Perspectives
The strongest evidence comes from the earnings report itself:Annualized revenue from AI-related businesses has already surpassed $26 billion, with AI alone contributing 22–26% of Azure's growth rate. This isn't just a concept—it's trackable revenue that continues to accelerate each quarter.
Azure’s growth remains robust, underpinned by a solid core business:Azure grew by 40%, with Q4 guidance at 39–40%. Microsoft 365 Commercial Cloud revenue rose 17%, while Consumer Cloud revenue increased 29%. Microsoft’s enterprise software exhibits strong lock-in effects, making its revenue highly predictable—customer switching costs are extremely high, so even with Azure price increases, churn remains low.
Valuation has returned to a reasonable range:Following a 35% pullback, Microsoft (MSFT) now trades at approximately 23x forward P/E, below its historical average and also below valuation levels of peers benefiting from AI infrastructure demand. Most institutional investors view this price as a 'discounted buying opportunity.'
Capital expenditures represent strategic investment, not waste:Some investors believe the current $190 billion in capital expenditures is aimed at capturing a historic window of opportunity in AI computing infrastructure.
Bearish arguments
Return on capital expenditures is currently negative and unlikely to turn positive in the near term:Money has already been spent, but the timeline for realizing returns remains highly uncertain. Azure’s growth rate dipped slightly from 40% in Q1 to 39% in Q2—a marginal deceleration signal. If capital expenditures continue to rise while growth fails to accelerate, this equation will never balance.
The competitive landscape is unfavorable, and the company’s moat is being eroded:AWS and Google Cloud are not only continuously investing in infrastructure but also fiercely competing in AI applications. More importantly, OpenAI itself is commercializing standalone AI products, and Microsoft’s partnership with OpenAI is far from unshakable—it could evolve into a competitive relationship in the future.
Technical indicators and external risks are compounding:From a technical perspective, the head-and-shoulders top pattern has not yet fully broken down. Approximately 49% of Microsoft’s revenue comes from outside the U.S., so a stronger dollar will systematically weaken the translated value of its overseas earnings. If the upcoming earnings report in July again shows capital expenditures exceeding expectations, it could trigger a new wave of selling pressure.
During this prolonged tug-of-war between bulls and bears, rather than betting on who’s right or wrong in the narrative battle, investors might consider a different angle:The fierce battle itself presents opportunity—the rapidly elevated volatility is the most certain asset.
IV Structure Analysis

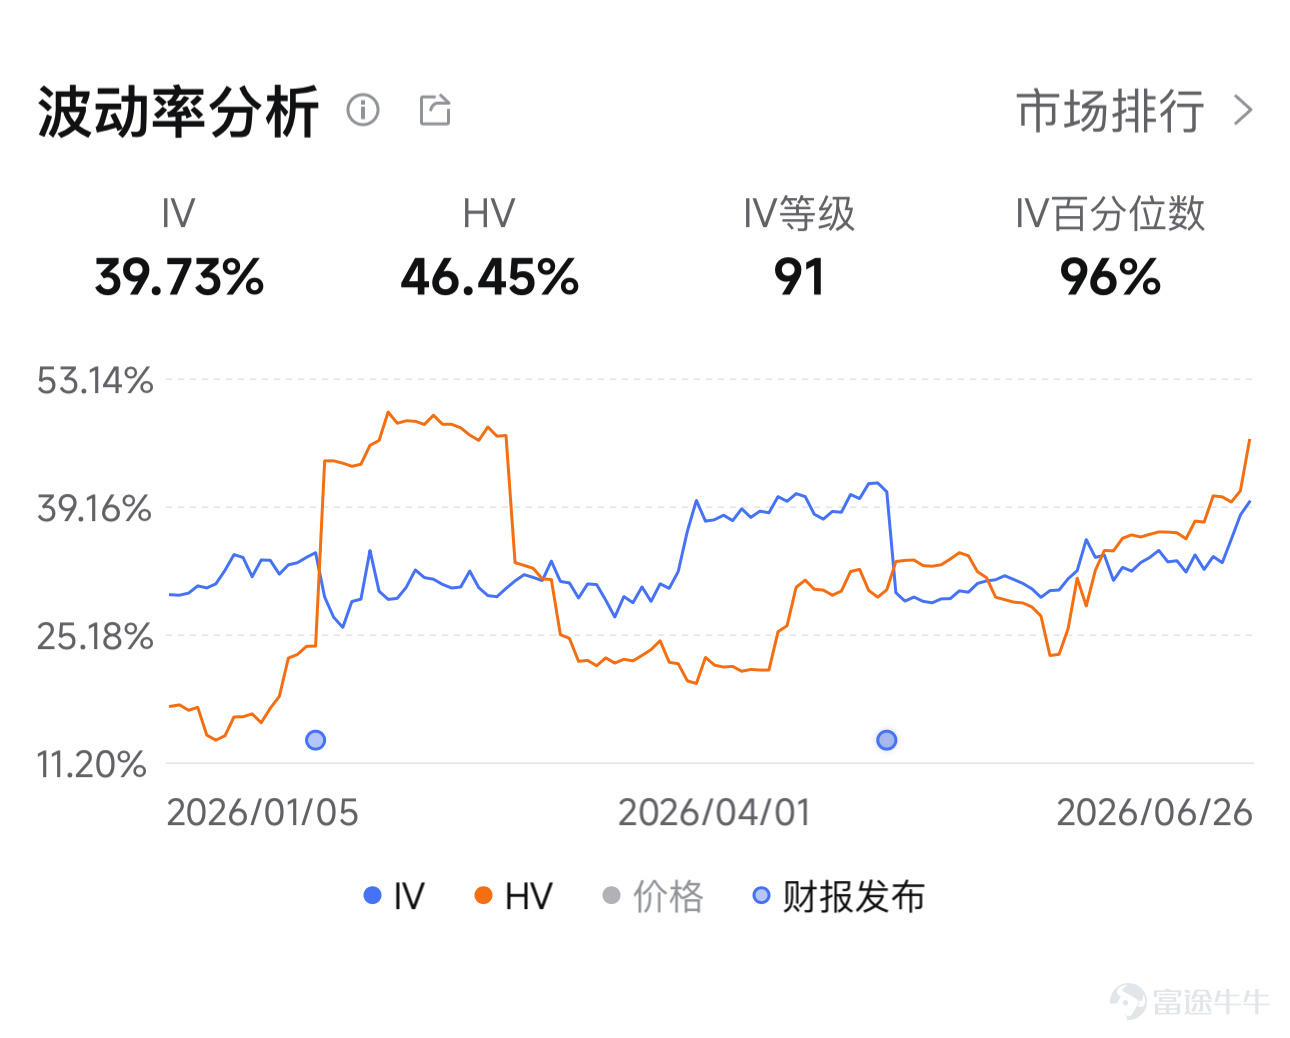
Microsoft’s implied volatility (IV) stands at 39.7%, with an IV rank of 91 and IV percentile of 96—its most expensive level in the past year;However, its historical volatility (HV) over the same period is as high as 46.5%, resulting in an IV/HV ratio of just 0.86. For option sellers, this is an important reminder: while the absolute premium is indeed rich (rank 91, percentile 96—the most expensive in a year), an IV/HV below 1 indicates there’s no ‘inflated IV’ premium to capture through mean reversion. The safety margin must come from selecting strike prices sufficiently distant from the current price.
In other words, there are currently two reasons why Microsoft is suitable for option sellers:First, the absolute option premium is substantial; second, implied volatility (IV) is at its highest level of the year, and is likely to decline once the tech-driven panic subsides. However, its marginal benefit is thin—even negative—which means the strike price must be set further out and more conservatively.
Limited-time high IV premium option strategy
Microsoft’s implied volatility (IV) is currently at its highest level of the year, supported by this wave of panic-driven safe-haven demand. Once sentiment in the tech sector stabilizes and volatility contracts, option premiums will shrink. Selling options now—while IV remains elevated—allows option sellers to collect rich premiums.
From a technical perspective, Microsoft’s current share pricehas already broken below the 20-day moving average (MA20) at $400.11 and the 50-day moving average (MA50) at $410.52, with these moving averages now acting as overhead resistance. The 14-day RSI stands at just 40.48, placing it in oversold territory. The stock has just bounced off the lower Bollinger Band at $342.07, with the middle band at $400.11 and the upper band at $458.15. The trend remains weak, and the current move is a rebound following an oversold condition.
Covered Call Strategy Reference
Suitable for:Investors who already hold Microsoft shares and wish to collect option premiums during this rebound to reduce their cost basis
Suggested contract: July 17, 2026, $410 CALL
Reference strike prices:$410 (approximately 8% above the current price; closely aligned with the 50-day moving average at $410.52—this moving average has already been breached and now acts as resistance; the stock would first need to reclaim the 20-day moving average and then break above the 50-day moving average to pose a 'threat' to this contract)
Suggested expiration date:2026-07-17
Suggested premium:Approximately $270 per contract (1 contract = 100 shares), equivalent to a reduction in holding cost of $2.7 per share (actual prices can be checked in the Futubull app: Stock → Options Chain).
Cash Secured Put strategy reference
Suitable for:Investors willing to take delivery of Microsoft shares at around $335
Reference contract: 260717 335 PUT
Reference strike prices:$335 (approximately 12–13% below the current price; positioned below the lower Bollinger Band at $342.07 and the recent monthly low of $349.20, providing ample buffer space)
Suggested expiration date:2026-07-17
Suggested premium:Approximately $160 per contract, equivalent to a reduction in holding cost of $1.6 per share; if assigned below $335, the effective purchase price would be approximately $333.4.
(All strategies mentioned above are for illustrative purposes only and do not constitute investment advice or any form of guarantee)
 Finally, here's a small perk for fellow investors. Welcome, fellow investors, to claim your benefit.Options Beginner Pack
*This event is exclusive to invited HK users. Click to learn more.Detailed event rules>>

Risk Warning
An option is a contract that gives the holder the right, but not the obligation, to buy or sell an asset at a fixed price at any time on or before a specific date. The price of an option is influenced by various factors, including the current price of the underlying asset, the strike price, the time to expiration, and implied volatility. Implied volatility reflects the market's expectation of the option’s volatility over a certain period in the future. It is derived inversely from the Black-Scholes (BS) pricing model and is generally considered an indicator of market sentiment. When investors expect greater volatility, they may be more willing to pay higher prices for options to help hedge risks, leading to higher implied volatility. Traders and investors use implied volatility to evaluate.Option priceto enhance attractiveness, identify potential mispricing, and manage risk exposure.
Disclaimer
This content is for reference only and should not be considered as an offer, solicitation, invitation, or advice to buy or sell any investment product or make any investment decision. It should also not be interpreted as professional advice. Options contracts are derivative products and may not be suitable for all investors. You should carefully consider your own investment experience, investment objectives, financial resources, and other relevant conditions before deciding whether to participate in such transactions. The risk of loss in trading options contracts can be substantial. In some cases, losses may exceed the initial margin deposited. Even if you have set contingent orders, such as 'stop-loss' or 'limit' orders, they may not prevent losses. Market conditions may render such orders unexecutable. You may be required to deposit additional margin within a short period. If you fail to provide the required amount within the specified time, your open positions may be liquidated. However, you will still be responsible for any shortfall in your account resulting from such liquidation. Therefore, before trading, you should study and understand index options and carefully consider whether such trading is suitable for you based on your financial situation and investment objectives. If you trade options, you should be familiar with the procedures for exercising options and the rights and obligations upon expiration.
Risk Disclaimer: The above content only represents the author's view. It does not represent any position or investment advice of Futu. Futu makes no representation or warranty.Read more


Comments (4)
to post a comment
24
37