
With regulatory barriers easing and institutional investment ramping up, is Bitcoin launching a rebo

Bitcoin briefly fell below the $60,000 mark—what’s the outlook ahead?
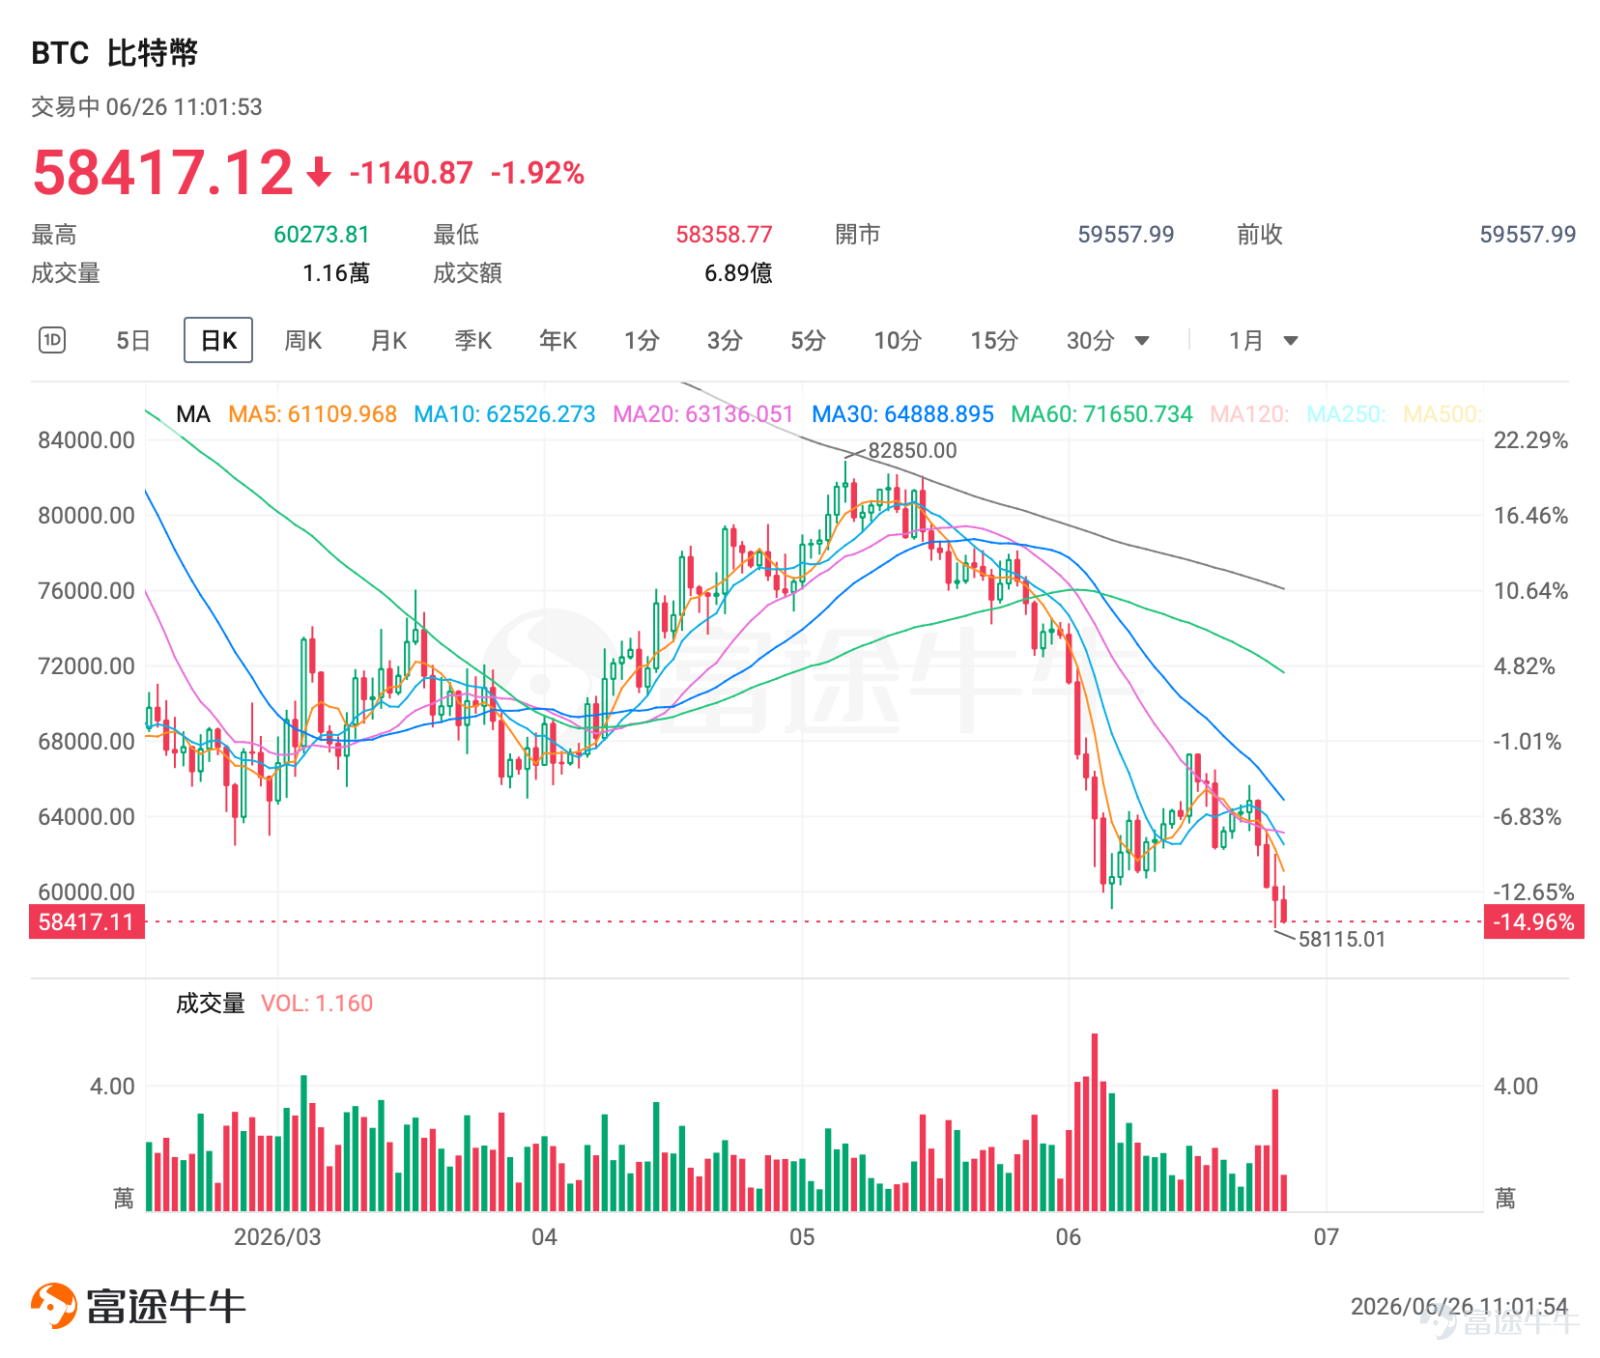
At the moment you opened the market quote interface, most holders likely felt a sinking feeling in their stomachs: $Bitcoin (BTC.CC)$ the long-held psychological support level of $60,000 has officially been breached. As of this writing, $Bitcoin (BTC.CC)$ prices dipped as low as $58,115, marking a nearly 10% decline over the past five trading days.

What’s driving the sell-off? Triple pressure converges to break through the $60K support
This Bitcoin breakdown results from a confluence of macroeconomic, capital flow, and derivatives-related headwinds. Each layer of pressure continues to drain market liquidity, triggering cascading sell-offs.
First pressure point: Rising expectations of Federal Reserve rate hikes are weighing on non-yielding assets across the board.
Following Waller’s debut remarks, market expectations for a rate cut this year have sharply diminished, with probabilities now pricing in a 25-basis-point hike in October exceeding 60%, further bolstering the U.S. dollar index. $Bitcoin (BTC.CC)$ As a non-yielding asset, Bitcoin faces significantly higher opportunity costs for holding.
According to sosovalue data, approximately $2.92 billion has flowed out of U.S. Bitcoin spot ETFs as of June 24, directly weakening buying support.

Second layer of pressure: U.S. AI chip stocks are aggressively attracting capital, continuously diverting funds away from the crypto market.
A Deutsche Bank research report explicitly highlighted the key difference between this downturn and previous bear markets:Institutional capital is shifting en masse from the crypto sector into AI-focused technology segments. $Micron Technology (MU.US)$ Storage chip stocks and others continue to outperform independently, with their high-growth narrative drawing substantial new capital. Funds previously allocated to Bitcoin are now reducing BTC positions and increasing allocations to US tech equities. Without fresh inflows, the crypto market is left to trade on existing liquidity, making it highly susceptible to sharp declines even under modest selling pressure.
At the same time, $Strategy (MSTR.US)$ The high-leverage model is also undergoing reassessment.As a major Bitcoin holder, Strategy has suffered consecutive sharp losses recently, and its preferred shares (STRC) have also plummeted. The market is now concerned that Strategy’s high-leverage approach—borrowing to buy Bitcoin—faces credit reassessment amid Bitcoin’s prolonged downtrend. The financing mechanism that supported Bitcoin buying over the past two years is showing cracks. Higher funding costs for STRC will constrain Strategy’s ability to purchase Bitcoin, and its sale of 32 BTC in early June—breaking its long-standing pledge never to sell—has further heightened market concerns.

Third layer of pressure: Nearly USD 10 billion in quarterly options expired on June 26, creating magnetic selling pressure from market makers.
This recent decline coincided with the largest quarterly options expiry of Q2.Bitcoin options with a notional value exceeding USD 9 billion on Deribit are expiring en masse—the maximum pain point.(The strike price with the highest open interest—i.e., the price at expiry that causes the greatest number of option holders to incur losses.)USD 70,000,As options expiry approaches, option sellers typically attempt to buy or sell the underlying asset to steer the price toward a closing level favorable to their positions.
Moreover, since a large volume of put options is clustered around strike prices between USD 58,000 and USD 60,000, market makers acting as sellers must continuously sell in the spot market to maintain delta-neutral hedging.

The market exhibits a classic 'magnet effect,' with prices persistently pulled downward, amplifying short-term volatility. In simple terms, the sustained selling pressure in the 48 hours before expiry is mechanically driven by derivatives settlement rules—not by pure bearish sentiment on fundamentals.
How low could it go? Key support levels analysis
USD 60,000 has shifted from strong support to a key resistance level. Attention should now focus on three critical support zones to distinguish between short-term bounce ranges and deeper medium-term correction territory.
Short-term first line of defense: USD 58,000
This zone marks the starting point of the upward trend since September 2024 and aligns closely with the 200-week moving average, serving as a key technical support area. If prices fall to this level accompanied by shrinking trading volume and weakening sell pressure—combined with today’s options expiration—there could be an opportunity for an oversold bounce. Often, markets experience brief relief following large-scale expirations.

Secondary strong support: USD 57,000 on-chain liquidation zone
If Bitcoin breaks below USD 58,000 on high volume, the next key area to watch is the dense on-chain liquidation zone between USD 57,000 and USD 58,000. This region likely holds significant leveraged positions, which could trigger cascading liquidations.

Medium-term value support range: USD 50,000–55,000
The 2024 trading range formed a dense accumulation zone within this interval. Should the USD 57,000 support fail, downside potential would extend toward this range, making it an attractive area for phased, value-oriented positioning. According to Coinglass data, currently $Bitcoin (BTC.CC)$ the average cost basis of long-term holders is also around USD 49,800, making USD 50,000 a critical psychological threshold.

History shows that Bitcoin halving from its highs is not uncommon. In 2022, it fell from over USD 48,000 to as low as USD 13,000, representing a maximum drawdown of nearly 70%. We are far from such an extreme scenario now, and the current correction remains within manageable bounds.The key isn’t guessing the bottom but being prepared for all scenarios.
What should Bitcoin investors do?
The market is currently in a classic state of 'extreme fear,' but interestingly, on-chain data shows that long-term holders are actually slowing down their selling.
This suggests that the real panic is coming from short-term leveraged traders and sentiment-driven players—long-term believers with substantial positions have not surrendered en masse.For retail investors, since it’s impossible to pinpoint the exact bottom, it’s better to focus energy on position management and psychological discipline.
Spot holders—keep your hands off and wait patiently
If you’re fully invested in spot positions with no leverage, the worst thing you can do right now is capitulate in panic.
– Stay away from the price chart:If checking the price every five minutes only makes you more anxious, close the app, step away from the market entirely, and set alerts only for key price levels.
– Wait for confirmation signals before acting:The most critical technical signal right now is whether the daily candle can close above USD 60,000. If it does, a short-term bottom may be forming; if daily closes remain consistently below 60,000, a reversal may not yet be confirmed.
– Hold your existing positions and avoid adding new ones recklessly:Do not blindly add to your position just because the asset seems cheap before a clear trend reversal emerges. A more reliable entry confirmation signal is when price stabilizes with strong volume at a key support level.
Dollar-cost averaging investors – build a watch-position in stages
If you have consistent cash flow and follow a dollar-cost averaging strategy, periods of extreme fear present an excellent opportunity to lower your average holding cost.
Recommended approach:
– Enter in stages: Do not deploy all your capital at once. Consider using a 'tiered support-level accumulation strategy'—for example, buy a small initial position in the $58,000–$59,000 range, add a second tranche if prices fall further to the $50,000–$55,000 zone, and allocate a third portion only in extreme scenarios if prices drop below $50,000.
– Trade time for space: Invest a fixed amount weekly or monthly, ignoring short-term volatility.
What’s ahead? Volatility is Bitcoin’s norm; risk management is the core of long-term survival.
This time, $Bitcoin (BTC.CC)$ The recent pullback below $60,000 resulted from a confluence of short-term factors—tightening macro liquidity, capital rotation, and derivatives settlement—and does not undermine Bitcoin’s long-term narrative of scarcity.
In the near term, Bitcoin is likely to consolidate sideways while forming a bottom.Following options expiry, if no new negative catalysts emerge, a rebound attempt may occur around $58,000. However, macro variables—such as Federal Reserve policy and U.S. equity market performance—will remain dominant, making a V-shaped recovery unlikely. The medium-term outlook hinges on the macro environment: if inflation data continues to justify Fed tightening, Bitcoin could see further downside; if rate-hike risks ease and the U.S. dollar weakens, Bitcoin may reclaim the $60,000–$70,000 range or higher.
For ordinary investors, short-term price movements are unpredictable, but most irreversible losses can be avoided through position sizing and emotional discipline.Those who successfully navigate a full market cycle—from bull to bear—always maintain ample cash reserves, avoid leverage, and stay emotionally unaffected by market swings.
 Fellow investors, what do you think will happen to BTC after it breaks below 60,000 USD?
Futubull’s Fear & Greed Index is now live!Pinpoint market sentiment turning points with precision—the ultimate compass for timing your entries and exits. Tap to unlock your personalized investment insights~
(Note: Please update Futubull to the latest version.)

Risk Disclaimer: The above content only represents the author's view. It does not represent any position or investment advice of Futu. Futu makes no representation or warranty.Read more


Comments (5)
to post a comment
11
19