
"AI Bottleneck Trade" Ignites Upstream Sector—Who’s Raking in the Profits?
Niu Niu Technical Intelligence Bureau | SanDisk and Micron Technology Both Hit New All-Time Highs! How Much Longer Can These 'Cash Machines' Keep Delivering?
Within just a few days, Bank of America raised $SanDisk (SNDK.US)$ the target price to $2,100, Mizuho increased it from $1,825 to $2,200, and Cantor Fitzgerald pushed it all the way up to $2,900; all three firms share the same underlying thesis: the NAND supply shortage will persist through the end of 2028, driven by continuously expanding AI demand. As of June 15 in U.S. Eastern Time,SanDisk's stock price officially broke through $2,100, hitting a new all-time high, with a year-to-date gain exceeding 692%, leading the Nasdaq 100 and S&P 500 indices.
$Micron Technology (MU.US)$ The rally is driven by multiple overlapping factors. On the institutional side, Daiwa Securities initiated coverage with a Buy rating (target $1,600), Wolfe Research doubled its price target to $1,250, TD Cowen significantly raised its target to $1,500, and Goldman Sachs also increased its target to $900. On the fundamentals side, Micron Technology’s earnings report on June 24 represents the most significant near-term pricing event—institutional consensus expects Q3 earnings per share (EPS) to surge more than 932% year-over-year.
The catalysts behind both stocks are clearly defined, yet their technical patterns differ in timing and risk profiles. This edition of Bull Bull Intelligence will analyze each in detail.
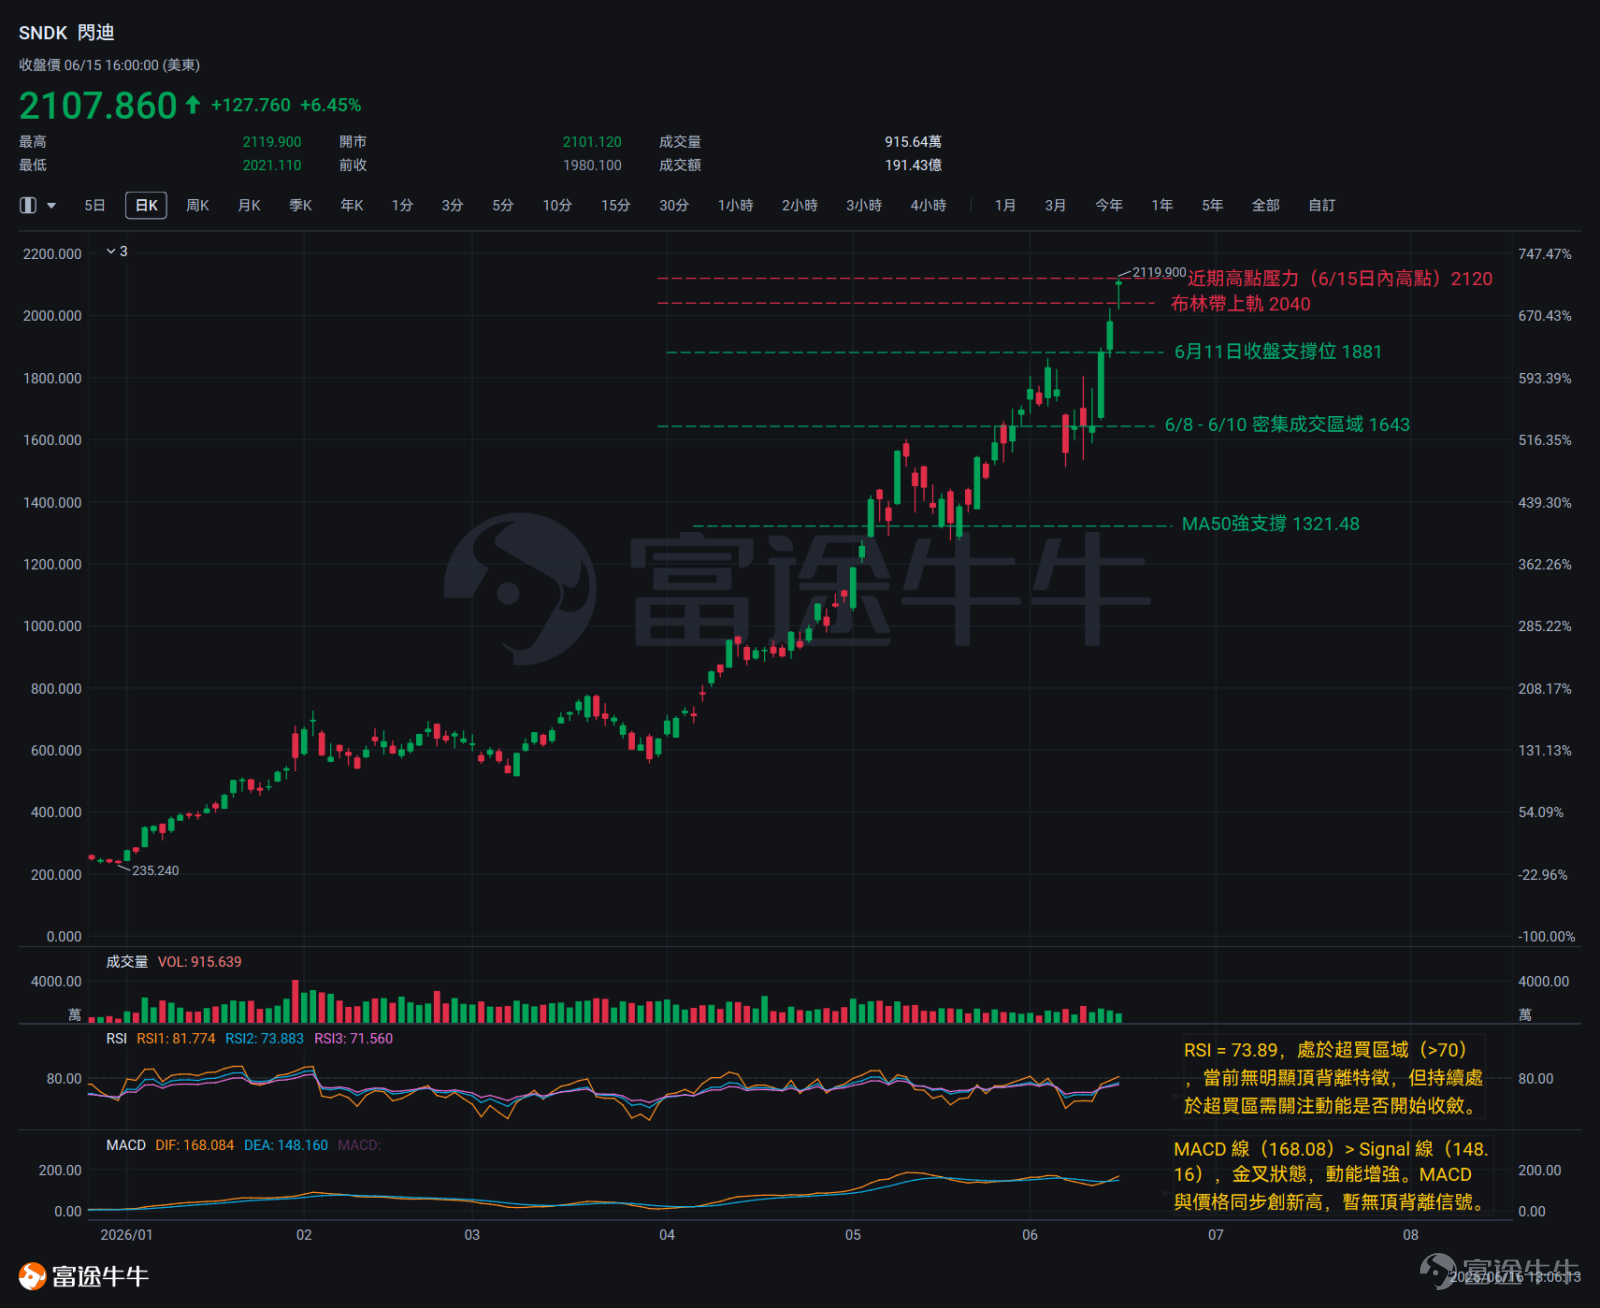
SanDisk

The closing price of $2,107.86 on June 15 marked SanDisk’s highest-ever closing level since its IPO and the first time it closed above the upper boundary of its normal price fluctuation range—the Bollinger Bands’ upper band stood at $2,040.61 at that time. Breaking above this line signifies:The price has exited the statistically defined 'normal volatility range,' theoretically opening upside potential, but also indicating a pronounced short-term deviation from the mean. This implies that without sustained fresh buying interest, downward pressure toward the moving average could emerge at any time.
This breakout was supported by a relatively complete structural sequence formed over the past two weeks. The move began from the June 5 intraday low (closing at $1,559.32): that day ended with a large bearish candle, leaving no doubt about bear dominance. A critical transition then occurred between June 8 and June 10, when prices consolidated narrowly around $1,640—this low-volume sideways movement indicated that selling momentum from the prior decline had largely exhausted itself, as the market awaited renewed directional clarity. The answer came on June 11 with a strong bullish candle (closing at $1,881.51): a single candle broke decisively out of the consolidation zone with significant gains, completely engulfing the prior three days’ trading range—This three-phase bottom formation—'decline, stabilization, then rally'—sent a relatively clear upward signal.
Following this confirmation signal, the price action remained robust:Closing at $1,980 on June 12 and $2,107 on June 15, successive bullish candles posted progressively higher closes, with each day’s open staying above the previous day’s close—a classic sign of consistent buyer support and lack of seller resistance. June 15 further confirmed bullish strength: closing at $2,107 with short upper and lower wicks, reflecting tight intraday price action that left little room for bears to counterattack.
Key Technical Indicators Interpretation
Moving Average (MA):The 20-day moving average (MA20) stands at $1,338.08 and the 50-day moving average (MA50) at $1,005.07; the current price trades well above both, forming a strong bullish alignment with upward-sloping averages, indicating ample trend momentum.
RSI:The current reading is 73.89, placing it in overbought territory (>70). No clear bearish divergence is evident at this point—RSI has moved in sync with price to reach a new short-term high, so divergence has not yet materialized. However, prolonged stay in overbought territory warrants monitoring for any signs of momentum convergence.
MACD:The MACD line (168.08) is above the Signal line (148.16), indicating a bullish crossover and strengthening momentum. Both MACD and price have simultaneously reached new highs, showing no bearish divergence signal for now.
Bollinger Bands:The stock price of $2,107.86 has broken above and surpassed the upper Bollinger Band ($2,040.61). The bands are significantly expanding, reflecting a sharp increase in recent volatility, with price currently trading strongly above the upper band.
Technical Comprehensive Analysis
SanDisk’s current price ($2,107.86) is only about 12 points below its intraday high of $2,119.90 reached on June 15. Within this context,The $2,120 level represents the most immediate near-term resistance.On June 15, the price touched $2,119.90 intraday but closed back at $2,107.86, indicating some selling pressure around the $2,120 area. Should price test this level again, the key will be whether it can close firmly above it.If a breakout occurs without a corresponding increase in volume, caution is warranted regarding a potential false breakout followed by a pullback. The upper Bollinger Band at $2,040 serves technically as a dynamic resistance/support level.Price is now trading above this level; should a pullback occur in the near term, this zone is likely to become a key area of contention between bulls and bears.
Support levels are structured in three tiers. The first tier is at $2,021—the intraday low from June 15 and also the lower boundary of the most recent candlestick—A break below this level would imply that the June 15 up-move structure has been fully invalidated, likely putting downward pressure on short-term bullish momentum.Second level: $1,981, the closing price on June 12, which served as the starting point for several recent consecutive upward moves.A break below this level indicates that the recent upward momentum is already fading.Third level: $1,881, the closing price of the strong bullish candle on June 11, and also the starting point from which this rally fully began from the bottom.A breach below this level would signal that the structure of this strong uptrend has been fundamentally compromised, requiring a reassessment of the medium-term outlook rather than viewing it merely as short-term volatility.
Micron Technology (MU)

First, consider a set of figures: Micron Technology’s low on June 5 was $864, and its closing price on June 15 was $1,088—a rebound of approximately 25.9% within 10 trading days. These numbers reflect the basic pattern of Micron’s recent price action—not a steady advance, but a sharp rebound following a steep decline.This constitutes what technical analysts refer to as a 'V-shaped recovery.'Only by understanding this context can we more accurately assess the significance of the current price level:The moving average structure appears healthy (price has risen above the 20-day MA at $911 and the 50-day MA at $692), but this rapid surge followed an intense period of volatility, with the current price already deviating by about 19% above the 20-day MA. Consequently, short-term mean-reversion pressure is real and should not be overlooked.
Where a market falls determines where it rebounds from. Micron experienced two consecutive down days from June 4 to June 5, with a fierce sell-off: on June 5, it opened at $944 and closed at its intraday low of $864, with extremely short upper and lower shadows—indicating sellers dominated the session without giving buyers any breathing room.Such a price pattern typically signals concentrated 'panic selling,' reflecting extreme pessimism in market sentiment—but it also establishes the basis for an oversold condition.The three-day consolidation from June 8 to June 10 represents a period of accumulation prior to re-establishing direction: prices traded in a narrow range, with neither buyers nor sellers showing clear dominance.June 11 marked the true turning point—a single-day gain exceeding 10% (opening at $904 and closing at $996)—completely engulfing the prior two days’ trading range, signaling a moderately strong reversal.The consecutive bullish sessions from June 12 to June 15 effectively confirmed this structure.
Key Technical Indicators Interpretation
Moving Average (MA):The 20-day moving average (MA20) stands at $911.29, and the 50-day moving average (MA50) at $692.08. The short- and medium-term moving averages are in bullish alignment, with price trading well above both lines and upward-sloping trajectories, indicating a healthy structure; however, near-term mean-reversion pressure warrants caution.
RSI:The current RSI reading is 66.56, sitting in a neutral-to-high zone (<70), but approaching the warning threshold. Over the past 10 days, the price surged sharply from $864 to $1,088, yet the RSI has not surpassed its prior high, forming an early sign of mild bearish divergence—caution is advised.
MACD:The MACD line (89.69) lies below the Signal line (94.13), forming a bearish crossover, indicating weakening momentum; continued monitoring of subsequent price action is required.
Bollinger Bands:The current price resides in the upper portion between the middle Bollinger Band ($911) and the upper band ($1,158). The bands are expanding, reflecting heightened volatility and room for further trend extension, with no extreme overbought signals yet observed.
Technical Comprehensive Analysis
Let’s first address the most immediate hurdle: $1,097.This was the intraday high reached on June 15 but not held at the close. Whether this level can be breached will, to some extent, determine the near-term market direction. If the stock closes above $1,097 and sustains that level,the next reference target would be the upper Bollinger Band at $1,158.It is also the theoretical upper boundary of this rebound within the technical framework.
Support levels are divided into three tiers. The first tier is $995—the breakout point of the strong bullish candle on June 11,when the price surged directly from $904 to $996, with the breakout occurring around $995, after which prices continued to rise;if the price retraces to $995 in the future, it would signal that the breakout effect from June 11 is starting to weaken, warranting heightened caution. The second tier is around $950: during the three-day consolidation period from June 8 to June 10, the price repeatedly oscillated near $950, often finding decent support upon retesting.The third tier is the 20-day moving average (MA20, currently at $911): this is a dynamically shifting support level and represents the final line of defense for maintaining the current reversal structure.—based on the current MA20 level, a drop to $911 would represent a roughly 16% decline from the current price of $1,088;once this level is breached, the technical V-shaped reversal structure will face substantial threat, requiring a reassessment of the market outlook.

Risk Disclaimer: The above content only represents the author's view. It does not represent any position or investment advice of Futu. Futu makes no representation or warranty.Read more


Comments (6)
to post a comment
51
128