
With regulatory barriers easing and institutional investment ramping up, is Bitcoin launching a rebo

Crypto Market Summary for May: Tightening Macro Constraints End Bitcoin’s Rally, Sending Market Back into Deep Bear Market Liquidation Phase | Bitcoin | Research Report | Cryptocurrency Market Analysis
May 2026,$Bitcoin (BTC.CC)$ The market failed to sustain the rally that began in April and, under the combined pressures of renewed macro constraints, dual capital channels turning into outflows, rapidly weakening spot buying power, and exposed fragility in derivatives leverage, has reverted to the late-stage liquidation trajectory typical of a cyclical bear market.
On the macro level, U.S. inflation has reaccelerated and the labor market remains resilient, further compressing the Federal Reserve's room for monetary easing. The U.S.-Iran conflict and restricted transit through the Strait of Hormuz have added upward pressure on energy prices, while high real interest rates, a strong U.S. dollar, and tightening liquidity channels collectively create external headwinds for crypto assets.
On the internal structural front, the crypto market in May exhibited a typical pattern of strength early in the month followed by weakness later. In the first half of the month, capital inflows, ETF channels, and derivative leverage jointly drove Bitcoin higher. In the second half, both stablecoin and ETF inflow channels weakened, spot buying power on exchanges declined sharply, short-term holders entered unrealized loss territory, and long positions in derivatives were passively liquidated due to insufficient spot market support.
Core assessment for May: The rally that began in March–April has fizzled out, and the market has returned to the prolonged deleveraging phase characteristic of the late stage of a cyclical bear market. Tightening macro liquidity constraints, outflows through dual funding channels, unrealized losses among short-term holders, and leveraged liquidations collectively confirm this state. Meanwhile, accumulation by long-term holders and improvements in supply structure indicate the market is approaching the necessary token redistribution process for bottom formation—but the transition to a new phase has not yet been completed. Key variables to watch in June include whether macro financial conditions ease, whether stablecoins resume inflows, whether ETF channels provide support, and whether short-term holders exit their unrealized loss zones.
Macro Financial Conditions: Macro headwinds and constrained liquidity
Given that the U.S.-Iran conflict is unlikely to resolve in the near term and transit through the Strait of Hormuz remains constrained, crude oil prices have risen and are gradually transmitting cost pressures downstream. Geopolitical commodity shocks are now a key background constraint shaping global equity and risk asset pricing. For crypto assets, the macro environment is no longer merely an external narrative variable—it directly constrains funding costs, liquidity channels, and the transmission efficiency of risk appetite. Market expectations for a dovish policy cycle have been systematically compressed; high real rates, a strong dollar, shrinking liquidity channels, and geopolitical commodity shocks together impose significant constraints on digital assets.
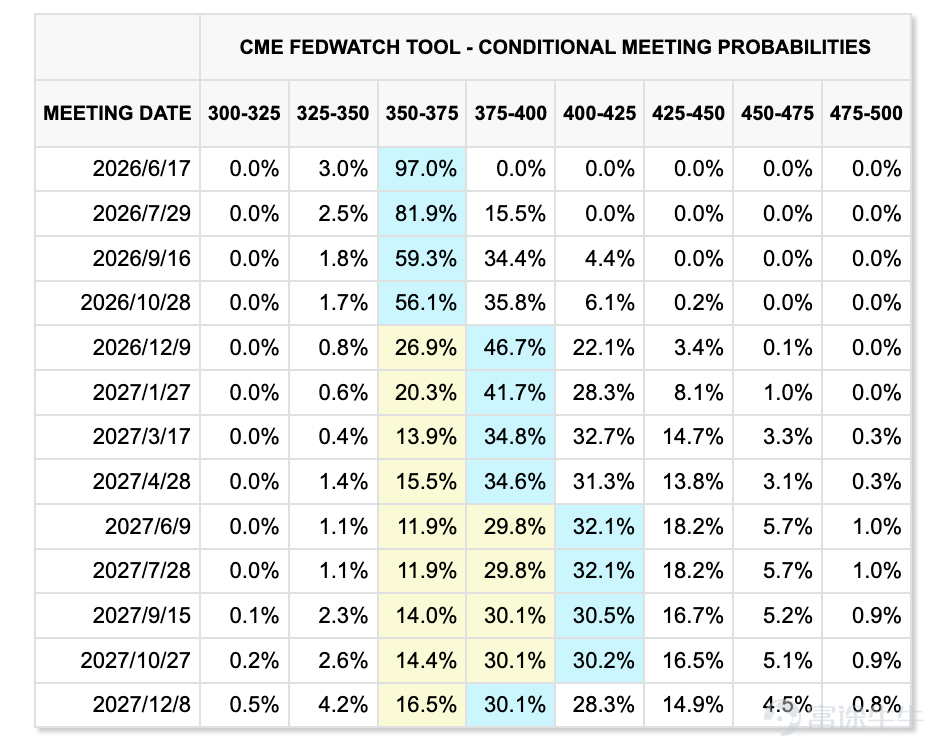
On the monetary policy front, the Federal Reserve held its benchmark interest rate steady at the 3.5%–3.75% range during its April meeting. Meanwhile, April’s CPI accelerated year-over-year to 3.8%, with a 0.6% month-over-month increase; core CPI rose 0.4% month-over-month and remained at 2.8% year-over-year. May’s nonfarm payroll added 172,000 jobs—significantly above market expectations—and the unemployment rate held steady at 4.3%. Resurgent inflation combined with a resilient labor market has further diminished market expectations for Fed rate cuts, prompting a reassessment of scenarios where high rates persist longer than anticipated. Rate markets have also begun repricing the risk of a potential rate hike within the year.
Leadership changes at the Federal Reserve have further heightened policy uncertainty. On May 22, newly appointed Fed Chair Kevin Warsh was sworn in. Warsh favors downplaying the forward guidance and dot plot approaches used under Powell, advocating instead for greater 'strategic ambiguity.' This means markets will find it harder to price risk assets based on clear policy trajectories. For crypto assets—which are highly dependent on liquidity expectations and forward-looking repricing of risk appetite—this shift in communication style is not neutral. Should the policy path shift from 'expectations of predictable easing' to 'high uncertainty with a hawkish bias,' the valuation elasticity of high-volatility, high-beta, cash-flow-free Bitcoin will be suppressed.
More importantly, May’s macro pressures stemmed not only from shifting rate expectations but also from actual contraction in underlying financial system liquidity. While the Fed’s net liquidity remains relatively high, the Overnight Reverse Repo (ON RRP) facility has declined to low levels, significantly weakening its role as a liquidity buffer for the financial system. Meanwhile, the U.S. Treasury’s TGA account remains elevated, with further replenishment pressures ahead. With the ON RRP buffer diminished, any future rise in TGA balances or Treasury issuance will more directly drain reserves from private banks. According to liquidity models, Treasury settlements between late May and early June could also temporarily withdraw reserves, making the financial system more sensitive to reserve fluctuations.
Real interest rates and the U.S. dollar also exert downward pressure. In May, long-end U.S. Treasury yields remained elevated, with the 10-year yield hovering around 4.5% and the 30-year yield briefly approaching or exceeding 5%. The 10-year real yield stayed above 2%, significantly increasing the opportunity cost of holding non-yielding assets. High real rates weighed on valuations for both gold and Bitcoin, with BTC peaking on May 11 before gradually declining. The U.S. Dollar Index rebounded from April’s lows, nearing the 99–100 range by end-May, adding direct pressure on Bitcoin.
Geopolitical tensions and commodity shocks have further reinforced inflation constraints. Reports indicate that the U.S.- and Israel-led conflict with Iran, which erupted on February 28, has reached a stalemate, leading to a sharp reduction in shipping volumes through the Strait of Hormuz. WTI crude traded repeatedly near $100 in May, with significant intramonth volatility driven by negotiation updates and geopolitical developments. Energy shocks are transmitting into inflation via transportation, fertilizer, food, and other channels, raising the risk of persistent inflation in the second half of the year. Given the continued resilience of the labor market, the Fed finds it difficult to pivot toward monetary easing; instead, markets have begun repricing the probability of a rate hike.

Markets begin pricing in expectations of rate hikes within the year
Therefore, the essence of the macro-financial environment in May was not a one-way expansion of risk appetite, but rather a structural divergence in risk appetite. U.S. equities outperformed crypto assets, supported by AI-related capital expenditures and earnings expectations for large-cap tech stocks; however, this risk appetite was highly concentrated and fragile. The decline in the volatility index indicates lower surface-level volatility, yet this risk appetite did not effectively transmit to crypto assets. More precisely, the macro environment in May was characterized by strong surface-level risk appetite in equities, while crypto assets faced significantly deteriorating conditions regarding dollar liquidity, real interest rates, and funding channels. Crypto assets failed to benefit from the positive feedback loop of rising U.S. equities, yet bore the negative feedback from higher real rates, a stronger dollar, and reserve scarcity.
From a mechanistic perspective, the macro headwinds in May were not driven by a single variable shock, but by a triple squeeze stemming from inflation constraints, rising discount rates, and contraction in liquidity channels. Inflation constraints locked down policy easing space, higher real interest rates increased Bitcoin’s holding costs, and tighter dollar liquidity weakened stablecoin and ETF funding channels—ultimately pressuring crypto assets downward even amid relative strength in U.S. equities.
Crypto Market: Dual Funding Channels Exit, Price Peaks Early and Declines Later
Against a backdrop of significantly heightened external macro constraints, Bitcoin prices in May exhibited a typical 'peak early, decline later' pattern. In the first half of the month, inflows, ETF channels, and derivative leverage jointly drove the market upward; in the second half, dual funding channels exited simultaneously, exchange stablecoin purchasing power rapidly eroded, and leveraged long positions lacked spot-market support, ultimately triggering price retracements and localized liquidations. According to the 'EMC Labs BTC Cycle Analysis Framework,' the rally since April has abruptly ended, and the market has re-entered the deep cleansing phase characteristic of the late stage of a cyclical bear market.
Fund flows were the most critical internal variable in the crypto market this month. Total monthly average fund flows shifted from an inflow of $10.5 billion in April to an outflow of $2.4 billion in May. The intramonth trajectory shows that fund flows peaked at $1.53 billion on May 4, then deteriorated rapidly in the second half of the month, plunging to a low of negative $1.24 billion on May 30. This indicates that the market did not sustain new capital support throughout May; instead, marginal buying power quickly faded after an early-month surge.
Both ETF and stablecoin channels showed clear weakening. After continuous outflows over multiple months, capital briefly returned to crypto markets in March and April; however, as macro-financial outlooks deteriorated in May, both channels resumed outflows—with stablecoins seeing $19.32 billion in outflows and ETF channels recording $23.16 billion in outflows. This renewed shift to negative fund flows directly undermined the marginal buying power needed to sustain the market rebound.

Monthly Crypto Market Fund Flow Summary
The deterioration in exchange purchasing power was even more direct. Net stablecoin positions on exchanges plummeted from an inflow of $18.2 billion at the end of last month to a net outflow of $44.1 billion—a 342.86% decline. Although total stablecoin balances on exchanges only slightly decreased from $75.97 billion to $74.66 billion, the marginal net flow direction has clearly turned negative. This means the market isn’t lacking in stablecoin stockpiles, but rather in marginal buyers willing to enter exchanges and engage in spot purchases.
Exchange Bitcoin data confirms rising short-term selling pressure. Exchange-held Bitcoin increased from 3 million BTC to 3.05 million BTC by month-end, up 1.48%; the monthly average net inflow shifted from -1,443 BTC to +1,438 BTC, a 199.68% increase. A strong net outflow of 12,391 BTC occurred on May 15, but when prices crashed on May 28, daily net inflows surged to 10,915 BTC. This suggests robust withdrawal or hodling behavior persisted mid-month, but short-term risk-off sentiment and selling pressure rose significantly in the second half after prices broke key support levels.
From a valuation and profitability perspective, Bitcoin declined from $76,314 to $73,596 in May, marking a monthly drop of 3.56%. However, due to stronger prices in the first half of the month, the monthly average price rose from $73,742 to $77,984. Overall, the MVRV ratio at month-end fell from 1.4105 to 1.3615, and NUPL stood at 0.3377. By month-end, the price had already dropped below the short-term holder (STH) cost basis of $77,165 and also fell beneath the Realized Price of $78,050, placing short-term holders collectively in unrealized loss territory and pushing the market into a technical discount and 'pain' zone. In the mid-to-late stages of a cyclical bear market, breaching such cost bases is not merely a short-term technical signal but a trigger for further loss realization and supply-side cleansing.
Realized profit and loss data also reflect shifts in market sentiment. Realized profits declined from $274 million to $90.3 million by month-end, a drop of 67.05%. Realized losses decreased from $171 million to $105 million by month-end; however, on May 29—when prices hit their intramonth low—single-day realized losses spiked to $578 million. The realized profit-to-loss ratio peaked at 4.84 on May 4 and then steadily declined, falling to 0.14 by May 28, indicating panic-driven loss realization. Both long-term holders (LTHs) and short-term holders (STHs) saw increased inflows to exchanges around May 28, signaling that the price breakdown triggered staged risk-off behavior and capitulation across different holder cohorts.
Meanwhile, the supply structure of the crypto market did not experience a collapse-style implosion. Long-term holder (LTH) balances increased from 14.81 million BTC to 14.91 million BTC by month-end, a net addition of 99,123 BTC (up 0.67%). Short-term holder (STH) balances declined from 2.21 million BTC to 2.08 million BTC, a net reduction of 129,385 BTC (down 5.85%). The LTH/STH ratio rose from 6.69 to 7.15, indicating that coins are migrating from short-term speculators to long-term holders. Long-term capital continues to absorb supply, and the floating supply remains structurally tightening.
However, the primary contradiction in the crypto market during May was not an outright loss of control on the supply side, but rather that structural improvements in supply were insufficient to offset marginal deterioration in demand. Accumulation by LTHs and whales prevented a crash-style decline, but net outflows of stablecoins from exchanges and outflows via ETF channels deprived any rally of sustained fuel. When long-term holders lock up supply and whales accumulate, yet stablecoins continue to marginally drain from exchanges, ETF inflows stall, and short-term holders sit in unrealized losses, the market enters a 'supply without demand' structure: insufficient coin release combined with inadequate capital to drive prices higher. Under these conditions, prices tend to stagnate in a range and quickly drop when short-term selling pressure emerges due to insufficient buying support.
The derivatives market acted as an amplifier of internal structural fragility this month. Open interest rose from $63.97 billion to $66.09 billion by month-end, and the monthly average increased from $62.34 billion to $68.63 billion (up 10.09%), peaking at $76.15 billion on May 5. Funding rates turned positive by month-end, and directional skew shifted from -$2.60 billion to +$2.59 billion. In other words, while spot market liquidity deteriorated, leveraged long positions re-accumulated in derivatives markets, attempting to sustain or push a rebound using leverage.
This structure is inherently unstable. When strong spot buying exists, moderate leverage can amplify upward momentum; however, when spot buying power dries up, stablecoins net outflow, and trading volumes decline, leveraged longs become potential fuel for market liquidations. On May 28, when prices broke key support levels, total liquidations reached $490.7 million, including $146.39 million in long liquidations in a single day—precisely the outcome of a 'high-leverage, crowded longs, insufficient spot absorption' structure.
Market Dynamics: Buying Power Fades, Selling Pressure Intensifies
Combining macro-financial conditions with internal crypto market structure, the core characteristic of May was divergence and hedging. Divergence occurred between external macro risk appetite and funding flows into crypto assets; hedging emerged between internal supply locking and external liquidity drainage. However, this hedging could only flatten the decline’s slope—it could not alter the fundamental reality that the market remains in the mid-to-late clearing phase of a cyclical bear market.
Externally, U.S. equities remained strong, supported by large-cap tech earnings and AI-related capital expenditures, preserving surface-level risk appetite. However, this risk appetite did not effectively transmit to crypto assets. Bitcoin responded more sensitively to changes in dollar liquidity and marginal risk capital than to broad equity index risk sentiment. In May, Bitcoin faced a distinct set of constraints: weakening of the ON RRP buffer function, persistently high real yields, a strengthening U.S. dollar, potential reserve drawdowns from Treasury General Account (TGA) and Treasury settlement operations, and geopolitical tensions driving energy inflation and compressing monetary policy easing space. Thus, equity strength primarily reflected idiosyncratic narratives around big-tech earnings and AI capex—not broad-based liquidity expansion—and crypto assets did not benefit from equivalent capital spillover.
Internally, accumulation by long-term holders and whales partially offset external pressures. LTHs added 99,123 BTC, while whales and 'sharks' accumulated 80,540 BTC, indicating that long-term capital has not abandoned Bitcoin and that coins continue concentrating among high-conviction holders. This structure prevented a crash-style decline. Despite worsening capital flows in the second half of the month, unrealized losses among short-term holders, and net positive exchange inflows, Bitcoin’s monthly decline was contained at just 3.56%, demonstrating that supply-side locking provided foundational market support.
However, this support is insufficient to drive sustained price increases or confirm that bottom reformation has been completed. A price rally requires not only reduced supply but also marginal capital inflows. The problem in May was that long-term holders could alleviate selling pressure but could not substitute for new buying power; whale accumulation absorbed some supply but could not fully offset the $4.41 billion net outflow of stablecoins from exchanges, which signaled a break in spot market purchasing power. Without concurrent inflows of stablecoins and ETFs, structural improvements on the supply side can only prevent a crash—not generate an effective reversal.

Loss-making trades still dominate the market.
From the perspective of dominant drivers, the May market was not driven by a single factor but experienced a phased shift. In the first half of the month, total capital flows peaked at $1.53 billion on May 4, open interest (OI) rose to $76.15 billion on May 5, and Bitcoin’s price surged to $82,186 on May 10—indicating that the rally was primarily fueled by capital flows and derivatives leverage. In the second half, as macro liquidity channels tightened, stablecoin flows turned negative, and ETF inflows stalled, market dynamics shifted toward spot liquidity depletion. Long positions in derivatives continued to accumulate despite insufficient spot market absorption, ultimately triggering a large-scale long liquidation on May 28.
Within our analytical framework, the market is currently in the mid-to-late stage of a four-year bear cycle, a phase characterized by the clearing of loss-making positions held by both long-term and short-term holders within the current cycle. According to eMerge IS, on-chain realized losses in May reached $5.253 billion, comprising $3.546 billion from long-term holders and $1.707 billion from short-term holders. The market remains in the process of further clearing and has not yet completed bottom reformation. More token exchanges and a more thorough reset of holder structures are needed before the market can enter a genuine bottoming zone.
Therefore, the cross-sectional assessment for May can be summarized as follows: At the external macro level, surface-level risk appetite in U.S. equities diverged from funding channels into crypto assets. At the internal structural level, long-term holders and whale accumulation partially offset downside pressure. However, from a cyclical perspective, the market has not exited the mid-to-late bear-market clearing trajectory. Supply-side improvements are a necessary—but not sufficient—condition for bottom reformation. A true phase transition requires synchronized improvements in capital flows, cost-line recovery, and the U.S. dollar funding environment.
Outlook: Cycle-level clearing is not yet complete.
According to the 'EMC Labs BTC Cycle Assessment Model,' Bitcoin remains in the mid-to-late stage of a cycle-level bear market. Although the holder structure is gradually improving, unrealized profit/loss levels remain underwater, and the clearing of loss-making positions from both long-term and short-term holders within this cycle remains the dominant theme. The current market is neither undergoing a medium-term correction nor a consolidation phase within a bull market—it is experiencing a failed bounce, ongoing clearing, and bottom reformation typical of the mid-to-late stage of a cycle-level bear market.
Macro financial conditions remain the biggest variable. Geopolitical conflicts show no sign of resolution, crude oil prices remain elevated, inflation is rebounding, and markets are repricing rate hike risks. Whether through actual rate hikes or expectations of higher-for-longer policy rates, any shift in expectations will cause significant turbulence in capital markets. If macro financial conditions deteriorate further, Bitcoin could seek re-equilibrium near its prior low around $60,000.
Internally, Bitcoin market clearing and holder structure optimization continue slowly. Clearing among long-term holders within this cycle will take more time, and if short-term holders fall below their cost basis, they may also turn to selling, exacerbating downward pressure. May’s data already shows that short-term holders entered unrealized loss territory after prices dropped below their cost basis, exchange net inflows of Bitcoin turned positive, and loss-realizing transactions increased—indicating that further selling pressure could still be released.
In the base case scenario, Bitcoin continues to complete clearing in the mid-to-late stage of the cycle-level bear market, with prices remaining in a wide trading range. Rebounds are capped near the short-term holders’ cost basis of $77,165 and the real-time market average price of $78,050. As long as spot purchasing power does not recover, stablecoins do not re-enter exchanges, and ETF inflows do not turn positive again, any rapid rally driven by derivatives leverage is likely to be a fragile bounce rather than a trend reversal.
In a downside scenario, if stablecoins continue experiencing net outflows, the SOFR-IORB spread widens further, dollar funding markets face reserve scarcity pressures, and Bitcoin price breaks below key support again, the market may once again seek rebalancing around the $60,000 level. Under such conditions, unrealized losses among short-term holders would expand, potentially amplifying exchange inflows and loss-realizing sell-offs, deepening the late-stage bear market cleansing process.
In an upside scenario, the market could only transition from a pure cleansing phase to an early recovery phase if stablecoins resume net inflows into exchanges, Bitcoin reclaims the short-term holder cost basis of $77,165, and further recovers the realized market average price of $78,050, all while dollar funding conditions remain stable. Even then, this would first signal an improvement in bottoming structure—not immediate confirmation of a new bullish cycle.
Key observations for June hinge on whether the following three validation variables improve simultaneously.
First, whether stablecoins resume net inflows into exchanges. If exchange stablecoin net positions remain negative, it indicates spot buying power has not yet recovered, and any rally driven by derivatives leverage will struggle to sustain itself. Only when stablecoins re-enter exchanges and generate sustained net inflows can the market establish the necessary capital foundation for bottom recovery.
Second, whether short-term holders exit unrealized loss territory. Currently, Bitcoin’s price is below both the short-term holder cost basis of $77,165 and the realized market average price of $78,050. If price fails to reclaim these critical cost zones, short-term holders will continue facing unrealized loss pressure, which could translate into renewed exchange inflows and selling pressure during volatility. Only by reclaiming these levels can trapped-position pressure begin to ease.
Third, whether dollar funding channels remain stable. Against a backdrop of weakening ON RRP buffers and potential continued reserve drain from TGA operations and Treasury settlements, close attention must be paid to the SOFR-IORB spread. If SOFR rises meaningfully above IORB, it signals intensifying reserve scarcity and heightened risk of financial plumbing stress, which could trigger cross-asset deleveraging and inflict secondary shocks on crypto assets.
Overall, the May 2026 price action reaffirmed that—following a failed rally—the market has returned to the late-stage bear market cleansing trajectory. Tightening macro liquidity constraints, broken spot buying power internally, and exposed fragility in derivatives leverage collectively indicate that bottom reconstruction remains incomplete. Accumulation by long-term holders and whales suggests improving supply-side dynamics, but ongoing stablecoin outflows from exchanges and unrealized losses among short-term holders reveal a lack of marginal buying power needed for a healthy reversal. Only when all three validation variables—stablecoin inflows resuming, short-term holders exiting unrealized losses, and stable dollar funding conditions—improve in tandem can the market gradually shift from late-stage bear market cleansing toward a healthier bottoming phase.
The above analysis is provided by EMC Labs.
———————————————————————
About EMC Labs
EMC Labs is a partner of Victory Securities, and together they have launched the only virtual asset fund approved by the SEC to accept stablecoin subscriptions—the Victory EMC BTC Cycle Fund. EMC Labs was co-founded by seasoned virtual asset investors and data scientists, with a core team hailing from JD.com Finance, Bell Labs, Marsbit, and other companies. EMC Labs has invested substantial resources in building a professional engine to analyze Bitcoin’s on-chain data and technical indicators.
Disclaimer
Investment involves risks, and investors should take note. The value of securities and investments can go up as well as down and is not guaranteed. Investors may not get back the original investment amount, and past performance is not necessarily indicative of future results. Victory Securities’ securities trading services are provided by Victory Securities Limited (hereinafter referred to as “Victory Securities”). This document was prepared and authorized for release on this platform by Victory Securities Limited, and the information contained herein is for reference purposes only. Victory Securities Limited reserves the right to make changes or terminate at any time without prior notice. All information provided on this platform, including this document and its contents, may not be reproduced, linked, reposted, or otherwise copied for publication or commercial use by any media, website, or individual without prior written authorization from Victory Securities. Authorized users must acknowledge that the source material originates from Victory Securities when using this document and its content, and commit to complying with relevant laws and all international conventions regarding internet usage, refraining from illegal purposes or unlawful use of this document. Violators will bear all associated legal and financial responsibilities. Data or figures quoted in this document may come from third parties; Victory Securities does not guarantee the accuracy of such third-party data or materials, nor will it assume liability for the fairness, accuracy, timeliness, completeness, or correctness of any data, forecasts, and/or opinions contained herein, nor the benchmarks upon which such forecasts and/or opinions are based. Any forward-looking statements in this document do not constitute guarantees of future performance, and actual circumstances or developments may differ significantly. This document is not and should not be considered or construed as an offer, invitation, solicitation, recommendation, advice to buy or sell any investment products, or as a basis for investment decisions, nor should it be interpreted as professional advice. Readers or those making investment decisions should fully understand the risks involved and the legal, tax, and accounting characteristics and consequences, and decide whether investing aligns with personal objectives and risk tolerance. Seek appropriate professional advice if necessary. In certain countries, the distribution and circulation of this document may be restricted by law or regulation, and recipients should be aware of and comply with such restrictions.
Risk Disclaimer: The above content only represents the author's view. It does not represent any position or investment advice of Futu. Futu makes no representation or warranty.Read more
Comments
to post a comment