

"Cash is king" narrative continues? Morgan Stanley: Memory remains the biggest bottleneck
Capital Expenditure, Depreciation, and Earnings Quality: A Comparative Study of Taiwan Semiconductor, SK Hynix, and Samsung
I. Who Invests Most Aggressively? — Comparison of Capital Expenditure Intensity
Differences in capital expenditure trajectories determine the pace at which depreciation is released, how margins come under pressure, and ultimately the valuation frameworks the market assigns to these three companies.
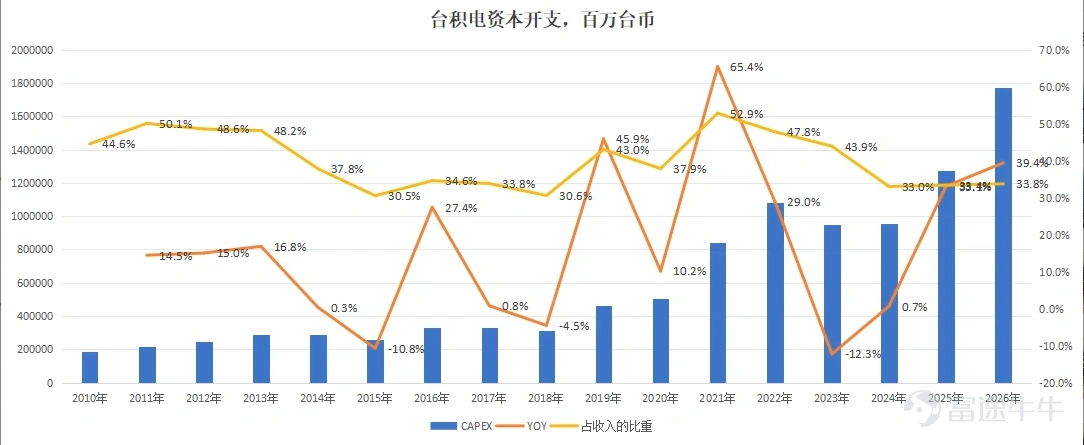
Taiwan Semiconductor: Its true distinction lies not in making exceptionally large investments in any single year, but in consistently maintaining high capital intensity over the long term
Source: Company announcements, compiled by the author
Compared with Samsung and SK Hynix, the defining feature of Taiwan Semiconductor’s capital expenditure is not short-term flexibility but long-term stability. As shown in the chart, since 2010, Taiwan Semiconductor has consistently maintained its capital expenditure at a high range of 30%–50% of revenue in most years—significantly higher than Samsung and also above SK Hynix in most years. This indicates thatTaiwan Semiconductor’s high capital expenditure is not a temporary measure tied to a specific upcycle, but an integral part of its business model. If a company sharply increases capital spending only in a few select years, it typically signals a response to a specific capacity expansion cycle. However, if a company can sustain high capital intensity over more than a decade, it means dense reinvestment has become inherently embedded as a core competitive strategy.
Taiwan Semiconductor’s capital expenditure generally follows a ‘confirmed pro-cyclical’ approach—it does not commit aggressively at the peak of industry euphoria, but instead scales up investment only after demand, yield rates, and customer adoption have been progressively validated. Capital expenditure declined from 2015 to 2018, reflecting the stabilization of smartphone growth and a moderated pace of 16nm and 10nm capacity expansion. From 2019 to 2021, capex rose significantly, driven by the ramp-up of 7nm and 5nm production, strong demand from Apple, high-performance computing, and cloud applications, and concurrent construction of advanced-node capacity at Southern Taiwan Science Park (STSP) and Central Taiwan Science Park (CTSP).
Capital expenditure contracted in 2022–2023 amid consumer electronics inventory drawdowns, reflecting its adaptive adjustment to mature-node dynamics and inventory cycles. However, spending resumed in 2024—not merely chasing cyclical momentum, but because 3nm production, the Arizona fab in the U.S., the Japan fab, and advanced packaging entered a new investment phase, underpinned by confirmed demand for AI computing power. In other words, Taiwan Semiconductor is not a typical counter-cyclical player, but rather a ‘disciplined pro-cyclical expander.’
SK Hynix: Among the three companies, it exhibits the strongest cyclicality—its CAPEX itself serves as an expression of its outlook on industry cycles.

Source: Company filings, author’s own compilation
SK Hynix’s capital expenditure is fundamentally more ‘structurally pro-cyclical.’ From 2014 to 2018, DRAM markets were in an upcycle, with demand from servers and smartphones reinforcing each other; the company expanded around M14 and M15 fabs, driving capex steadily upward until it peaked in 2018—essentially expanding in sync with rising prices and demand. From 2019 to 2020, as DRAM prices fell and the industry entered a destocking phase, capex contracted sharply—not as an active counter-cyclical move, but as a passive adjustment to the downturn. What truly matters begins post-2021: on one hand, it acquired Intel’s NAND flash business and advanced M16 while introducing EUV lithography for DRAM; on the other, in 2023—the worst year for the industry—it drastically cut spending on commodity memory capacity but did not abandon its high-end roadmap, instead gradually reallocating resources toward High Bandwidth Memory (HBM) and advanced packaging. Starting in 2024, as AI server demand became evident, capex rebounded rapidly, backed by expansions at M15X, the Yongin campus, and HBM capacity.
SK Hynix has long maintained a high capital expenditure-to-revenue ratio, typically ranging between 25% and 40%, and even exceeding 50% in certain years. This means its capex is not only highly volatile but also structurally intense. For memory companies, this characteristic carries a very clear implication: during upcycles, capex surges rapidly; during downcycles, it contracts just as quickly. Therefore, for SK Hynix, the most informative metric has never been the peak of capital expenditure, but rather its trough—because that often marks the starting point of the next earnings inflection.
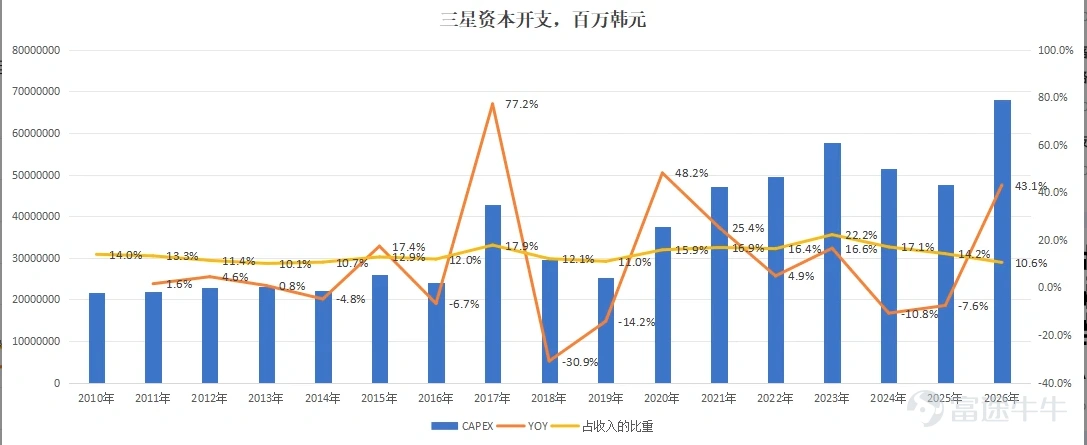
Samsung: Capital expenditures are not weak, but resemble a 'phased surge' rather than sustained high-intensity investment.
Source: Company filings, author's own compilation
Samsung’s capital expenditures have trended upward over the past decade-plus, but the pace has been uneven—more like stepwise increases than the kind of long-term, consistently high-intensity spending seen at Taiwan Semiconductor. Capex jumped 77.2% year-over-year in 2017, and another upswing began after 2020, with capex as a share of revenue peaking at 22.2% in 2023, indicating thatSamsung lacks neither willingness nor, at times, decisive commitment to invest heavily. However, over the long term, this spending appears more like concentrated bursts timed around specific cyclical inflection points, rather than a naturally sustained high-capital-intensity model stemming from its core business logic.
The underlying rationale cannot be simplistically labeled as 'counter-cyclical expansion.' More accurately, it is a hybrid approach: pro-cyclical expansion, counter-cyclical technology preservation, and capital allocation diluted across a complex multi-business structure. The 2017 surge was fundamentally driven by riding the peak of the DRAM and NAND flash memory cycle to ramp up Pyeongtaek P1 production, advance P2 construction, and expand NAND capacity in Xi’an. Capex then retreated in 2018–2019, aligning with the industry-wide adjustment following the memory price peak. The period with genuinely counter-cyclical characteristics was 2019–2021: despite weak industry conditions, Samsung continued investing in Hwaseong’s extreme ultraviolet (EUV) lithography lines, advanced process nodes, and foundry capabilities—demonstrating a willingness to spend through cycles during critical technology transitions. However, 2022–2024 revealed a key divergence between Samsung and peers like Taiwan Semiconductor and SK Hynix: even as the memory downturn became evident, Samsung maintained elevated overall capex, directing resources toward foundry, logic, and broader business expansion rather than reallocating earlier toward higher-return segments like high-bandwidth memory (HBM). Consequently, while investment remained substantial, capital efficiency failed to improve in tandem.
From an investor perspective, Samsung’s issue is not a lack of investment, but that its capex manifests more as phased surges, with returns persistently diluted by its diversified business structure—making it difficult to crystallize into a stable, verifiable return on capital like Taiwan Semiconductor’s. It is neither Taiwan Semiconductor’s 'expand after validation' model nor SK Hynix’s 'contract then concentrate for a counterattack' approach; instead, its numerous business lines often stretch capex into a curve that appears strong on the surface but lacks consistently sharp returns.
Summary
Taiwan Semiconductor’s greatest strength is not that it spends the most in any given year, but that it has normalized high capital expenditures as a steady state.
What makes SK Hynix most informative is not its capex peaks, but its capex troughs—because those typically mark the starting point of the next profit elasticity cycle.
Samsung’s problem is not underinvestment, but that its spending resembles periodic sprints rather than a sustained, high-intensity reinvestment system with verifiable returns.
II. Comparison of Depreciation Policies and Depreciation Intensity
What truly differentiates the earnings quality of these three companies isn't capital expenditures themselves, but how much depreciation those expenditures generate several years later—and whether that depreciation can be absorbed by revenue. However, before comparing depreciation figures, one must first apply a calibration layer: depreciation policies.
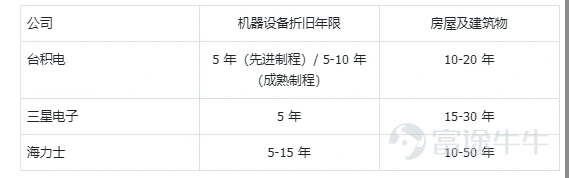
Source: Samsung and SK Hynix data are from Changxin Memory Technologies Co., Ltd.'s IPO prospectus (draft filing, December 2025); Taiwan Semiconductor data are from the notes to its 2024 Form 20-F annual report.
These figures illustrate two key points. First, Taiwan Semiconductor and Samsung are on equal footing regarding equipment depreciation—both use a five-year schedule. For every RMB 100 of capital expenditure incurred, both recognize roughly equivalent annual depreciation expenses on their income statements. Their depreciation figures are thus largely comparable; any divergence lies not in accounting policies but in revenue growth rates and gross margins. Second, SK Hynix’s depreciation range of 5–15 years is the widest and most flexible among the three. Some equipment can be fully depreciated over five years, while other assets are stretched out over 15 years.Viewed positively, this reflects the complexity of SK Hynix’s equipment mix—ranging from short-lifecycle advanced memory devices to longer-lifecycle NAND flash and packaging equipment—making a uniform policy impractical. However, from a conservative standpoint, a 15-year upper limit for equipment depreciation is unusually long for the memory industry. The conservatism ranking of depreciation policies—Taiwan Semiconductor (5 years, narrow range) > Samsung (5 years, narrow range) > SK Hynix (5–15 years, wide range)—itself serves as a mirror reflecting the earnings quality of these three companies.
Let’s now examine depreciation intensity in detail.
Source: Company filings, author’s own compilation
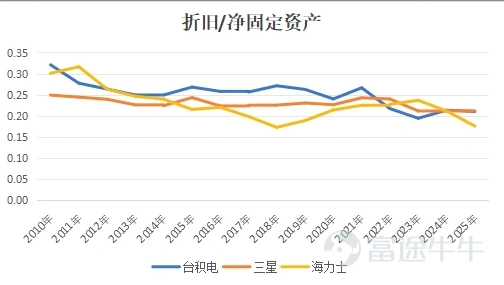
Source: Company filings, author’s own compilation
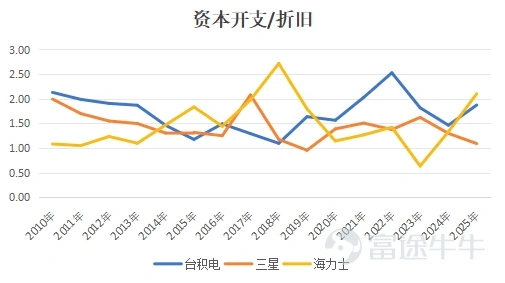
Taiwan Semiconductor certainly faces depreciation pressure—but each major investment cycle has been absorbed by revenue growth and pricing power. The company has maintained high capital expenditures for years: its capital expenditure-to-depreciation ratio reached 2.03 in 2021 and 2.53 in 2022, and is projected to remain at 2.44 in 2026. Yet simultaneously, depreciation as a share of revenue steadily declined from 0.279 in 2018 to 0.189 in 2022, with a further expected drop to 0.138 in 2026; depreciation as a share of net fixed assets also fell from 0.321 in 2010 to 0.197. The underlying industry logic is clear: from 2019 to 2022, surging demand from high-end smartphones and high-performance computing absorbed the heavy depreciation from 7nm and 5nm nodes; post-2023, AI servers, advanced packaging, and 3nm technology have taken over. Taiwan Semiconductor doesn’t avoid depreciation—it ensures every dollar invested secures corresponding, committed orders. For investors, what makes such a company truly valuable isn’t merely its willingness to invest, but its ability to maintain profitability after investing. Achieving this under a conservative five-year equipment depreciation assumption means its reported earnings carry the highest quality among the three.
For SK Hynix, depreciation acts as leverage during upcycles but becomes a blade in downturns. At the peak of the 2018 memory boom, its capital expenditure-to-depreciation ratio rose to 2.72; by the depths of the 2023 industry winter, it plummeted to 0.63, while depreciation as a share of revenue spiked to 0.400—meaning 0.4 units of every revenue unit were consumed by depreciation. This is the harsh reality of the memory sector: prices fall first, revenues collapse early, yet depreciation lags behind. But once the cycle turns, that same burden instantly transforms into elasticity. From 2024 to 2026, driven by ramping high-bandwidth memory (HBM) and explosive AI server demand, depreciation as a share of revenue rapidly compressed from 0.181 to 0.045, and the capital expenditure-to-depreciation ratio rebounded to 2.89. Given SK Hynix’s equipment depreciation period can extend up to 15 years, however, this elasticity carries a cautionary note: longer depreciation periods mean pain persists longer in downturns—older equipment may still be depreciating when rendered obsolete by newer process nodes. Thus, with SK Hynix, one must always check whether capital expenditures begin contracting at the worst of times and whether strong market conditions can continue covering depreciation releases at the peak of cycles.
Samsung is the most complicated—and also the easiest to mislead with surface-level numbers. Its depreciation-to-revenue ratio has long hovered between 7% and 14%, even dropping to 0.074 in 2026. Meanwhile, its depreciation-to-net-fixed-assets ratio has consistently remained within 0.21–0.25, showing neither severe deterioration nor obvious loss of control. But that’s precisely where the problem lies: Samsung’s depreciation pressure isn’t too apparent because it’s been 'smoothed out' by its vast and complex business structure. In 2017, during the memory upcycle, its capital expenditure-to-depreciation ratio peaked at 2.08; it fell to 0.95 in 2019 amid industry downturns; and from 2023 to 2026, despite intense competition in high-bandwidth memory and advanced process nodes, this ratio only recovered to 1.62 and 1.42—significantly weaker than Taiwan Semiconductor and SK Hynix. On the surface, depreciation rates appear moderate; in reality, mature businesses, end-market operations, foundry catch-up efforts, and memory investments are all blended together, jointly diluting both depreciation pressure and capital returns. Samsung’s issue has never been about 'ugly accounting' but rather about lacking 'economic sharpness'—it invests heavily, yet too little of that investment converts into high-quality profits. While its five-year equipment depreciation policy matches Taiwan Semiconductor’s and can be considered honest, that honesty is offset by the opacity of its consolidated financial statements.
Depreciation no longer merely reflects expense levels—it reveals the quality of capital itself. Taiwan Semiconductor demonstrates that high investment can be continuously diluted by highly predictable revenue, and its conservative depreciation policy ensures the cleanest reported earnings. SK Hynix shows how depreciation in cyclical stocks can both destroy and amplify profits—but its wide 5–15 year depreciation range means the 'purity' of those numbers depends heavily on management discipline. Samsung, meanwhile, illustrates that the greatest risk isn’t excessively high depreciation, but rather seemingly modest depreciation that masks persistently subpar capital efficiency.
III. Who Absorbs Depreciation Best
In the semiconductor industry, money invested doesn’t immediately become an expense. It first sits on the balance sheet for a year or two before slowly trickling into the income statement as depreciation. Within this time lag, the winner is whoever can grow revenue faster than depreciation accumulates.
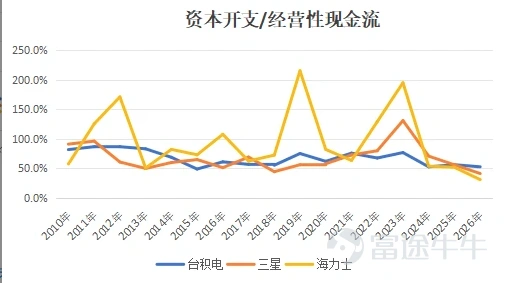
Source: Company filings, author’s own compilation
Taiwan Semiconductor has compressed this time lag to the shortest possible.For seventeen consecutive years, its capital expenditure-to-operating-cash-flow ratio has never exceeded 1—not because it spends little, but because every dollar invested already has a committed buyer lined up beforehand. Apple’s A-series chips, NVIDIA’s GPUs—orders arrive first, capacity is built afterward. Revenue is locked in even before depreciation begins to hit the books. The market assigns it a valuation close to 30x—not pricing it as a foundry, but pricing the certainty of its capital recovery.
SK Hynix’s time lag feels like gambling—but it has won three bets in a row. In 2012, amid an industry-wide trough, it pushed its capex-to-operating-cash-flow ratio to 1.71, betting on the smartphone upgrade cycle; in 2019, it raised it to 2.15, anticipating the 5G and data center recovery; and in 2023, while depreciation consumed 40% of revenue, it protected its high-bandwidth memory investments, waiting for AI demand. All three paid off. Yet its valuation always trades at a discount—the market demands a safety cushion for the next potential losing cycle. This isn’t distrust of SK Hynix per se, but distrust of the memory cycle itself.
Samsung’s time lag gets absorbed internally—not because it’s fast, but because it’s opaque. In 2019, while SK Hynix was counter-cyclically ramping up memory investments, Samsung’s capex-to-depreciation ratio dropped to 0.95, the only one among the three to fall below 1. It wasn’t unwilling to invest—it was simultaneously burning cash on QD-OLED panels, chasing Taiwan Semiconductor in foundry, and defending smartphone shipment volumes, with each segment competing for the same budget pool. Money was spent, but returns were blended across hundreds of products and dozens of divisions—nobody could clearly say how much the memory business actually earned. That very lack of clarity is the heaviest valuation discount of all.
Ultimately, what the market prices in is never just industry cyclicality or the level of profits reported on financial statements, but rather the certainty of capital recovery. Taiwan Semiconductor commands the highest premium not because it invests the most, but because it best demonstrates that every round of heavy investment reliably translates into higher-quality revenue, profits, and cash flow. SK Hynix consistently trades at a cyclical discount—not because it can’t make money, but because its profitability must always pass through the test of a memory cycle before being realized. Samsung’s valuation has long been suppressed—not due to a lack of technology or capital, but because the market finds it hardest to discern exactly where its capital is going and what kind of returns it will ultimately generate.
At a deeper level, the semiconductor industry has never been about who dares to spend more, but rather about who can truly convert capital expenditures into technological moats, pricing power, and sustainably recurring free cash flow. Capital spending is merely placing a bet; depreciation is just settling the account. What truly determines a company’s long-term value is whether that money, several years later, returns to shareholders in the form of higher-quality profits. Only those who achieve this deserve a sustained premium; without it, even the largest investments ultimately become nothing more than dead weight on future income statements.
Risk disclaimer: The above content is compiled from publicly available information and does not constitute any investment advice. Please assume all risks yourself.
Risk Disclaimer: The above content only represents the author's view. It does not represent any position or investment advice of Futu. Futu makes no representation or warranty.Read more


Comments
to post a comment
3
2