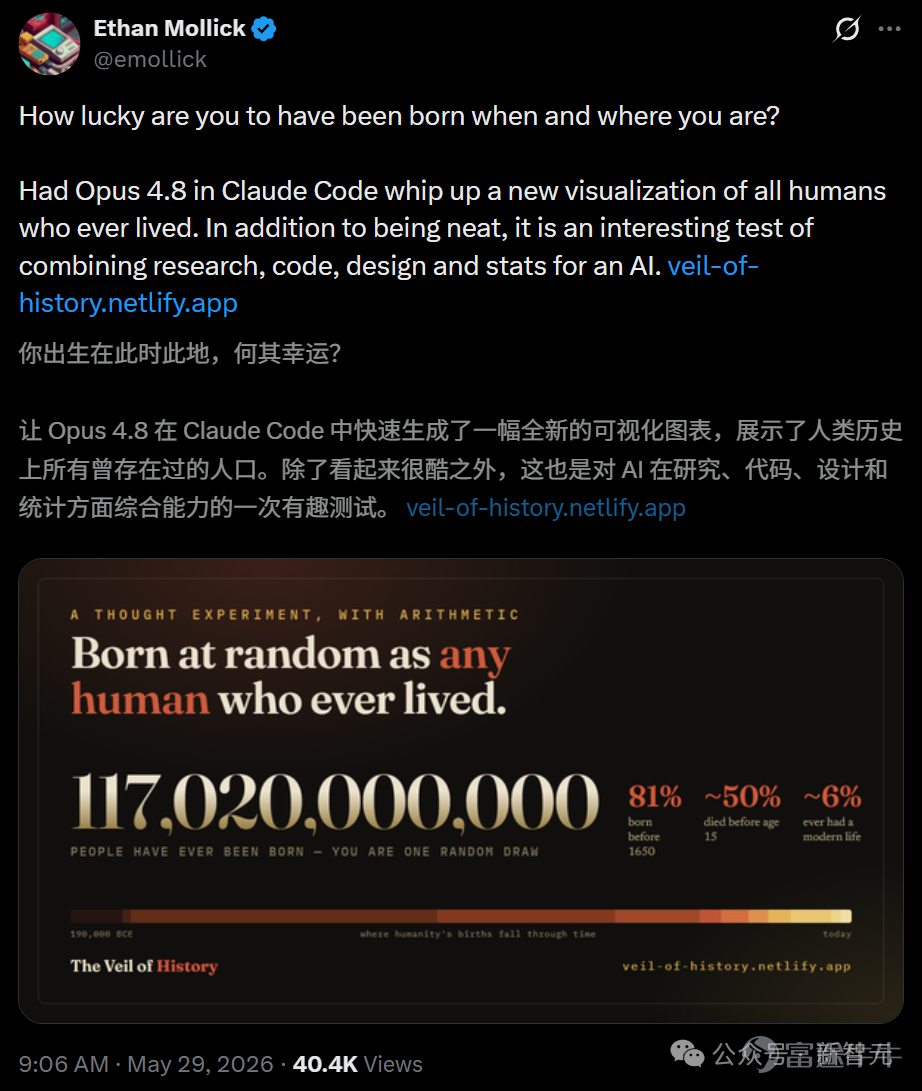

Opus 4.8 crunched the fates of 117 billion people overnight and, with a single prompt, built a human reincarnation simulator!
Article author, source: New Intelligence Source
If you were randomly reborn among the 117 billion humans who have ever lived, you’d most likely be an illiterate farmer born before 1650—and you wouldn’t live past age 15!
This answer wasn’t calculated by some historian who’s gone gray from years of research—it was generated by an AI.
Just moments ago, a tweet by Wharton School professor Ethan Mollick went viral on X.

Open the website he built, and over a hundred thousand years of human fate are distilled into a stark set of probabilities.
Behind those probabilities—from reviewing academic literature and building models to writing the first line of code and fine-tuning every pixel—not a single human programmer was involved.
It was all done by Claude Opus 4.8, executing a single instruction—an AI did it all alone.

Prompt: assume a universal veil of ignorance and you could be born as any human who has ever lived in history. What are the most likely socioeconomic conditions and locations you would be born into? Provide the top 10 by percentage chance. This should be sourced. Do research as needed.
The website is called 'The Veil of History.'
The name comes from philosopher John Rawls’s famous thought experiment.
Imagine you haven’t been born yet and don’t know which social class, race, or country you’ll end up in—how would you design society?
Mollick used Opus 4.8 to pull back this veil all the way to the scale of human history itself.
Its algorithm doesn’t distribute probability evenly by century but weights each era by the actual number of people born during it—the more births in an era, the higher your chance of being born then.
The results show that approximately 117 billion people have been born throughout human history. Roughly 81% were born before 1650, and about 94% before 1900.

The website compresses these 117 billion people into a grid of 100 small figures.
When you switch to the 'Era' tab, you’ll see that the vast majority of these figures are clustered in cells representing the pre-industrial era.
The closer you get to the modern era, the sparser the distribution becomes—only a handful stand in the 'post-1900' section.
For the overwhelming majority of 'you,' life meant bending over in a field.

Scrolling further down the website reveals the 'Ten Most Likely Lives,' with the top entries almost entirely consisting of anonymous individuals from agrarian societies.

Nameless, title-less, not even a single line left in history—yet they took up the largest shares of the entire lottery pool.
All the emperors and generals you’ve memorized since childhood together don’t amount to even one ordinary person.
After weighting, extreme poverty was the norm, literacy the exception, and simply surviving into adulthood was already a game of probability.

Click once to draw a life—you lived to age 38.
Statistics alone aren’t thrilling enough. What makes this website truly brilliant is that 'Draw a Life' button at the end.
Click it, and it genuinely draws a random birth for you from the full probability distribution.
Era, region, social class, what privileges you enjoy, and your ultimate fate—all are instantly assigned together.
Draw randomly, and most likely you’ll get a card like this:
Around the year 765 CE, a girl,a farmer or herder in sub-Saharan Africa.Extreme poverty, illiteracy, no electricity, and no running water.
Lived to about age 38.
Just two short lines—slamming onto the screen like that.

You can keep clicking until that abstract 'one in 117 billion' finally becomes a real person with a specific cause of death.
Click a few more times and you’ll find yourself repeatedly landing in roughly the same circumstances.
If you don’t believe it, click the link at the end of this articlelink, scroll down to the 'DRAW A LIFE' button, and see if you can draw a lucky modern life.
After drawing, feel free to share your result inComment section—let us know the year, location, and how old you lived to be.
In addition, the website has also created an interactive world map based on real geography, rendered using D3 and Natural Earth.
By dragging the timeline slider, you can step through 12 historical eras one by one.
For most of history, this center of gravity remained firmly anchored in Asia. Only as we approach the modern era does it begin shifting toward Europe and the Americas.
In other words, the vast majority of humanity’s grand narrative was written in the fields of Asia.

In fact, across all of human history, the number of people who could access clean water, find a doctor when ill, and reasonably expect their children to survive into adulthood adds up to little more than a tiny fraction.
Not to mention having electricity or livingin cities and enjoying a modern middle-income lifestyle.
What you take for granted right now is a standard of living utterly unattainable for the overwhelming majority of the 117 billion humans who have ever lived.
Ultimately, the way of life that seems mundane to people today stands out as a glaring, almost absurd anomaly when viewed against the entire timeline of human history.
Delivering a product of this quality is far more complex than just generating a few lines of HTML and CSS.
If assigned to a traditional team, data analysts would clean demographic curves, historical researchers would comb through literature for validation, UX designers would draft wireframes, and front-end engineers would meticulously code D3 visualizations line by line. Coordinating all these components and refining them to production readiness would easily take several weeks.
With Opus 4.8, a single AI assumes four distinct high-salary roles, seamlessly smoothing out all the friction in between.

To calculate the figure of 117 billion and its distribution across historical eras, it first referenced the Population Reference Bureau’s 2022 report titled 'How Many People Have Ever Lived on Earth?', then cross-referenced the Maddison Project Database, the HYDE dataset, and the United Nations’ population projections, ultimately synthesizing a matrix showing regional population shares across different eras.

In this process, estimating the total number of births in a given region relies on a clean formula:
Multiply the total births in each era by that region’s share of the global population during that era, then sum these values cumulatively across all eras.

The challenge is that no institution has ever compiled statistics on 'cumulative births by region.'
It therefore autonomously opted to apply the Monte Carlo method to handle uncertainty, running 4,000 simulation iterations—assigning greater noise to older, less certain periods—and ultimately outputting the median along with a 5th to 95th percentile confidence interval.

Synchronizing seamless scroll-driven storytelling with data state within a single page is no easy feat.
To achieve this, Opus designed its own modern-scrolling architecture that handles rendering massive datasets in the browser and enables dynamic, responsive charts—all with smooth, stutter-free animations.
It begins with an epic sweep of historical context, then sharply contrasts it with the insignificance of individual fate. Using visceral, punchy sentences, it drives cold statistics deep into the hearts of ordinary people.
Writing good code isn’t rare. Knowing how to stir human emotion—that’s almost the last bastion reserved for carbon-based life forms.
Back to Opus 4.8.
On Artificial Analysis’s leaderboard, it rolled forward like an emotionless steamroller, claiming the top spot with a full score of 61.4—surpassing GPT-5.5.
This marks the first time Claude has reclaimed the number-one position since OpenAI took the lead in April.

On the so-called 'Humanity's Last Exam,' Opus 4.8 scored 45.7%, leading the second-place model by a full percentage point.
On the cutting-edge physics benchmark CritPt, it also surpassed Gemini 3.1 Pro.

There was little surprise in programming.
On the more challenging SWE-Bench Pro—where it’s harder to achieve a perfect score—it scored 69.2%, compared to GPT-5.5’s 58.6%, opening up a clear 10-percentage-point gap.

On GDPval-AA, a benchmark specifically designed to simulate real-world workplace tasks that require hands-on work, research, and command-line execution,
Opus 4.8 achieved an Elo rating of 1,890, leaving second-place GPT-5.5 behind by approximately 121 points, implying a head-to-head win probability of roughly 67%.
Moreover, it reduced the average number of interaction rounds needed to complete similarly complex tasks to just 38, reaching optimal solutions through its own iterative trial-and-error and reasoning without requiring repeated human corrections.
This is precisely the underlying logic that enables it to independently deliver an entire website.

Last month, the race for the AI throne belonged to GPT-5.5, which had dethroned Opus 4.7 from the top spot. Just over a month later, Opus 4.8 has returned the favor.
Since this spring, this chair has changed hands several times—no one’s managed to warm the seat. The generational gap is now being compressed into a weekly tug-of-war.
But as the rankings keep shifting, what’s truly changing is the criteria by which they’re judged.
Once a model is treated as an agent capable of working independently, intelligence alone isn’t enough—it also needs to understand its own limits.

On the same day it released Opus 4.8, Anthropic also unveiled another move.
A Mythos-class model, even more powerful than Opus, will be made available to everyone within weeks.
Intelligence and honesty have never been mutually exclusive—the real strength of Opus 4.8 this time is that it elevates both simultaneously.
That reincarnation simulator that captivated the entire internet was merely a casual breath it exhaled.
References:
Risk Disclaimer: The above content only represents the author's view. It does not represent any position or investment advice of Futu. Futu makes no representation or warranty.Read more
Comments
to post a comment