
The US-Iran peace talks present conflicting narratives! What’s next for oil prices?
Tengsi | Trump Tears Up Ceasefire Agreement! How to Analyze the Global Energy and Hard Tech Themes?
On May 28, U.S. forces struck again at an Iranian ground control station in the Strait of Hormuz, intercepting and shooting down multiple Iranian drones posing a threat to U.S. military and commercial maritime traffic. The previously announced ceasefire agreement has already“become virtually defunct.”。
Meanwhile, global financial markets are confronting a paradoxical reality—the“liquidity bonanza”that supported risk asset pricing over the past four years has ended, replaced by a new landscape woven together by geopolitical fragmentation, energy restructuring, and a weakening monetary system—filled with structural tensions.
Since the Middle East situation escalated sharply in mid-March 2026, Brent crude oil $Brent Last Day Financial Futures (AUG6) (BZmain.US)$ has been oscillating between $80 and $114, establishing a new price anchor—not a fleeting war premium, but a permanent upward shift in global energy supply chain risk pricing;
Gold $Gold Futures (AUG6) (GCmain.US)$ has repeatedly tested its resilience around the $4,400 level, driven not merely by traditional safe-haven demand but closely intertwined with"de-dollarization"as an institutional behavior reflected in sustained central bank gold purchases;
U.S. Treasury yields $U.S. 1-Year Treasury Bills Yield (US12M.BD)$$U.S. 3-Year Treasury Notes Yield (US3Y.BD)$ have maintained a steep curve under dual pressures from sticky inflation and fiscal expansion, making short-end assets unusually attractive in terms of real yields unseen in years.
It is precisely within such an environment of"the old normal shattered, yet the new equilibrium not yet formed"during the transition period, $Global Multi-asset ETF Quant Strategy- Active (GTHK005.US)$ the portfolio structure of the R4 strategy offers an insightful analytical framework and a philosophy of asset allocation worth deep consideration.
Hedging Layer: Elevating from Tactical Protection to Strategic Defense
The single largest holding in the R4 strategy is BIL.P—the Bloomberg 1-3 Month U.S. Treasury ETF,with an allocation as high as 29%. Including GLD.P’s 5% allocation, pure hedging assets collectively account for 34% of the portfolio, forming the thickest foundational layer of the entire strategy. This reflects a pricing of macroeconomic uncertainty far beyond conventional notions of"caution", leaning instead toward a structural defense mindset.
The core function of BIL.P is not yield generation—especially now that the inverted yield curve has ended andshort-end rates remain relatively elevated.In this environment, its role is dual.
*The first role is as a liquidity buffer
When markets experienceliquidity dry-upsshort-term Treasuries are among the few asset classes that can still maintain price continuity and trading depth under extreme conditions.
*The second role is as a true anchor for real yields
In an environment of heightened inflation expectation volatility, rolling investments in 1- to 3-month Treasury bills effectively replicate the path of the federal funds rate, enabling the R4 strategy to continuously capturethe 'return on waiting'。
while GLD.P serves as a complementary extension of this logic. By 2026, gold has already undergone three identity shifts in the macro context: from an inflation hedge, to a geopolitical safe-haven asset, and now to a'non-sovereign reserve alternative'。
Global central banks, particularly those in emerging market economies, have been accumulating gold at historically unprecedented scales over the past two years,Countries are actively reducing their reliance on the dollar-centric international clearing system.。
The allocation to GLD.P in the R4 strategy is less a bet on rising gold prices and more an alignment with this structural trend—it serves as an irreplaceable ultimate collateral within a liquidity portfolio.
Energy Layer: Structural positioning and risk hedging under the new oil price paradigm
USO.P accounts for only 2% of the R4 strategy—a seemingly minor tactical allocation at first glance. However, given the current geopolitical backdrop in the Middle East, this 2% carries strategic significance far exceeding what its weight suggests.
In March 2026, when concerns over the safety of shipping through the Strait of Hormuz triggered market panic, oil prices surged by more than 10% over just a few trading days, while global equity markets broadly came under pressure—highlighting how rising energy prices served as a perfect natural hedge.
The allocation to USO.P essentially equips the portfolio with a"tail-risk insurance mechanism"。
When extreme geopolitical events trigger broad declines across risk assets, upward moves in crude oil prices deliver compensatory returns that are negatively correlated with the rest of the portfolio.
More importantly, oil prices have established a"New equilibrium"is not solely defined by short-term Middle Eastern conflicts. It is underpinned by three structural layers:
First, the supply-side discipline gradually established by OPEC+ over recent years has altered crude oil market pricing mechanisms, shifting frommarginal cost-based pricing to policy-target-driven pricing.;
Second, global upstream capital expenditures have remained persistently insufficient due to expectations around the energy transition, resulting in a systemic decline in physical supply elasticity;
Third, even if tensions in the Middle East ease,shipping insurance costs, negotiation expenses for maritime passage, and the protracted nature of geopolitical standoffsall contribute to a supply recovery pace significantly slower than historical averages.
Standard Chartered Banknoted in its April 2026 report that the oil price midpoint has already"clearly shifted up by one notch" compared to pre-conflict levels., and this is precisely the fundamental rationale for holding USO.P in the R4 strategy—not betting on escalation of conflict, but embracing an already transformed energy pricing framework.
Growth Layer: Balancing Tech Leadership Against Supply Chain Restructuring
In the R4 strategy, QQQ.O (Nasdaq-100 ETF) and SMH.O (NYSE-listed Semiconductor Index ETF tracking the top 25 U.S.-listed semiconductor companies) hold weights of 10% and 7% respectively, together comprising a 17% technology allocation—indicating the strategy has not reduced its exposure to core growth themes despite macroeconomic uncertainty.
However, this allocation differs subtly from the traditional notion of“growth stock holdings”—it specifically selects two assets within the tech sector that exhibit the strongest infrastructure characteristics, rather than high-beta, thematic assets.
The index tracked by QQQ.O, $NASDAQ 100 Index (.NDX.US)$ in the context of May 2026, is no longer purely synonymous with“the dot-com bubble”anymore.
Over the past five years, the top five constituents of this index— $Apple (AAPL.US)$ 、 $Microsoft (MSFT.US)$ 、 $NVIDIA (NVDA.US)$ 、 $Alphabet-A (GOOGL.US)$ And, $Amazon (AMZN.US)$ —have collectively accounted for more than 40% of its weight, and these companies share a common characteristic: they have become core participants in AI infrastructure development.
Regardless of macroeconomic conditions, AI computing power investment currently exhibits a rigidity similar to"defense spending"in that companies cannot easily cut related capital expenditures without falling behind in the technology race.
A 10% allocation to QQQ.O effectively provides low-cost, highly liquid exposure to this long-term technological trend.
The semiconductor focus of SMH.O adds another analytical dimension: the industry faces a contradictory outlook in 2026.
On one hand, explosive demand for AI chips continues to outstrip advanced process capacity, and $Taiwan Semiconductor (TSM.US)$ And, $Samsung Electronics (005930.KR)$ utilization rates for advanced packaging capacity have remained above 95% over the long term;
on the other hand, U.S.-China tech decoupling and geopolitical risks in the Taiwan Strait make supply chain security an unavoidable structural cost.
R4’s strategy of gaining exposure to semiconductor leaders through SMH.O, rather than individual stocks, is itself a form of risk management—it retains participation in the AI compute cycle while avoiding concentration risk tied to a single company or region.
Notably, the strategy also holds EWT.P (a Taiwan market ETF, allocated at 10%), meaning R4 has indirectoverweight exposure—if cross-strait tensions show marginal improvement, this could become a potential source of excess returns for the portfolio.
Diversification Layer: The Rationale Behind Non-U.S. Asset Allocation—from Geographic to Currency Diversification
In the R4 strategy, assets from Japan (EWJ.P, 10%), Taiwan (EWT.P, 10%), and Brazil (EWZ.P, 10%) collectively account for 30% of the portfolio weight, forming its international diversification layer.
The selection of these three allocations exhibits a strong“asymmetric diversification”characteristic—not only providing geographic diversification but also serving as a hedge within the currency framework.
Over the past year, the Bank of Japan has gradually advanced monetary policy normalization, ending the yen’s multi-year trend of one-sided depreciation.
For investors who use the U.S. dollar as their accounting currency, holding Japanese yen-denominated assets provides a currency exposure that is potentially negatively correlated with the dollar—when deteriorating U.S. fiscal conditions weaken the dollar, the yen often moves in the opposite direction.
Moreover, driven by corporate governance reforms and structural reforms at the Tokyo Stock Exchange, Japanese equities have seen sustained improvements in ROE, giving EWJ.P dual characteristics of"currency hedging"and"structural reform dividends"simultaneously.
Taiwan’s central role in the global semiconductor supply chain is irreplaceable—from advanced-process wafer foundry services to IC design and packaging/testing, ** companies dominate multiple segments of the value chain.
Holding EWT.P essentially captures excess returns from the segment of the global technology supply chain with the strongest pricing power through a region-specific ETF.
Brazil, as a major commodity exporter, has asset valuations highly correlated with global energy, agriculture, and mining cycles, which are almost entirely orthogonal to the drivers of Asian tech stocks, thereby achieving true factor diversification.
Thematic Layer: Clean Energy and Agriculture—Patient Capital in Long-Term Structural Trends
ICLN.O (iShares S&P Global Clean Energy ETF, 10%) and DBA.P (Invesco DBIQ Diversified Agriculture Index ETF, 6%) represent the longest-duration allocations in the R4 strategy; they reflect directional views on the structural transformation of the global economy over the next five to ten years, rather than short-term tactical bets.
The investment rationale for ICLN.O lies in the fact that Middle East conflicts have exposed the vulnerability of fossil fuel dependence, prompting governments from Europe to Asia to reassess their energy security strategies—universally leading to accelerated investment in renewable energy.
International Energy Agencystated in its updated report at the beginning of 2026 that global clean energy investment surpassed fossil fuel investment for the first time in 2025, and this trend is expected to accelerate further between 2026 and 2030.
The index tracked by ICLN.O covers multiple sub-sectors—including wind power, solar energy, energy storage, and grid digitalization—providing investors with diversified exposure to clean energy.
DBA.P’s agricultural theme, by contrast, rests on even more solid foundations: demographic trends and climate change.
Continued global population growth, upgrading of dietary patterns in emerging markets, and increasingly frequent extreme weather events have collectively placed persistent strain on global food supply-demand balances.
By tracking a basket of agricultural commodity futures indices, DBA.P provides portfolios with alternative risk exposure that exhibits very low correlation with traditional equities and bonds—this is the true“crisis alpha”Source: During periods of macroeconomic turbulence when traditional assets broadly decline, agricultural commodity prices often rise counter-cyclically due to supply shocks, thereby delivering valuable diversification benefits to investment portfolios.
In conclusion
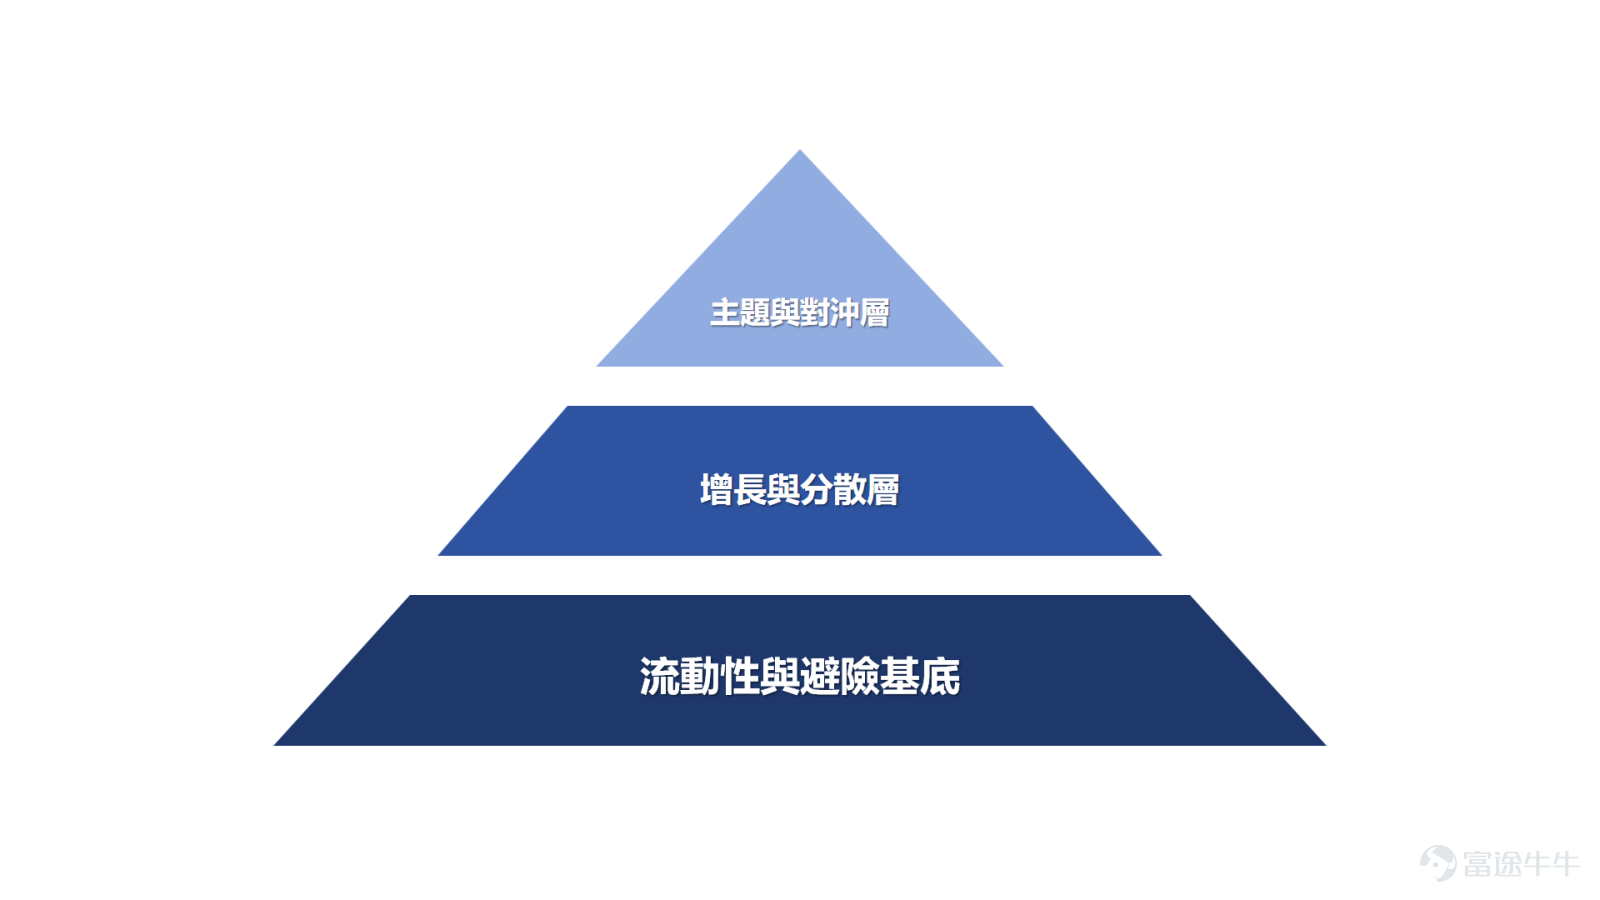
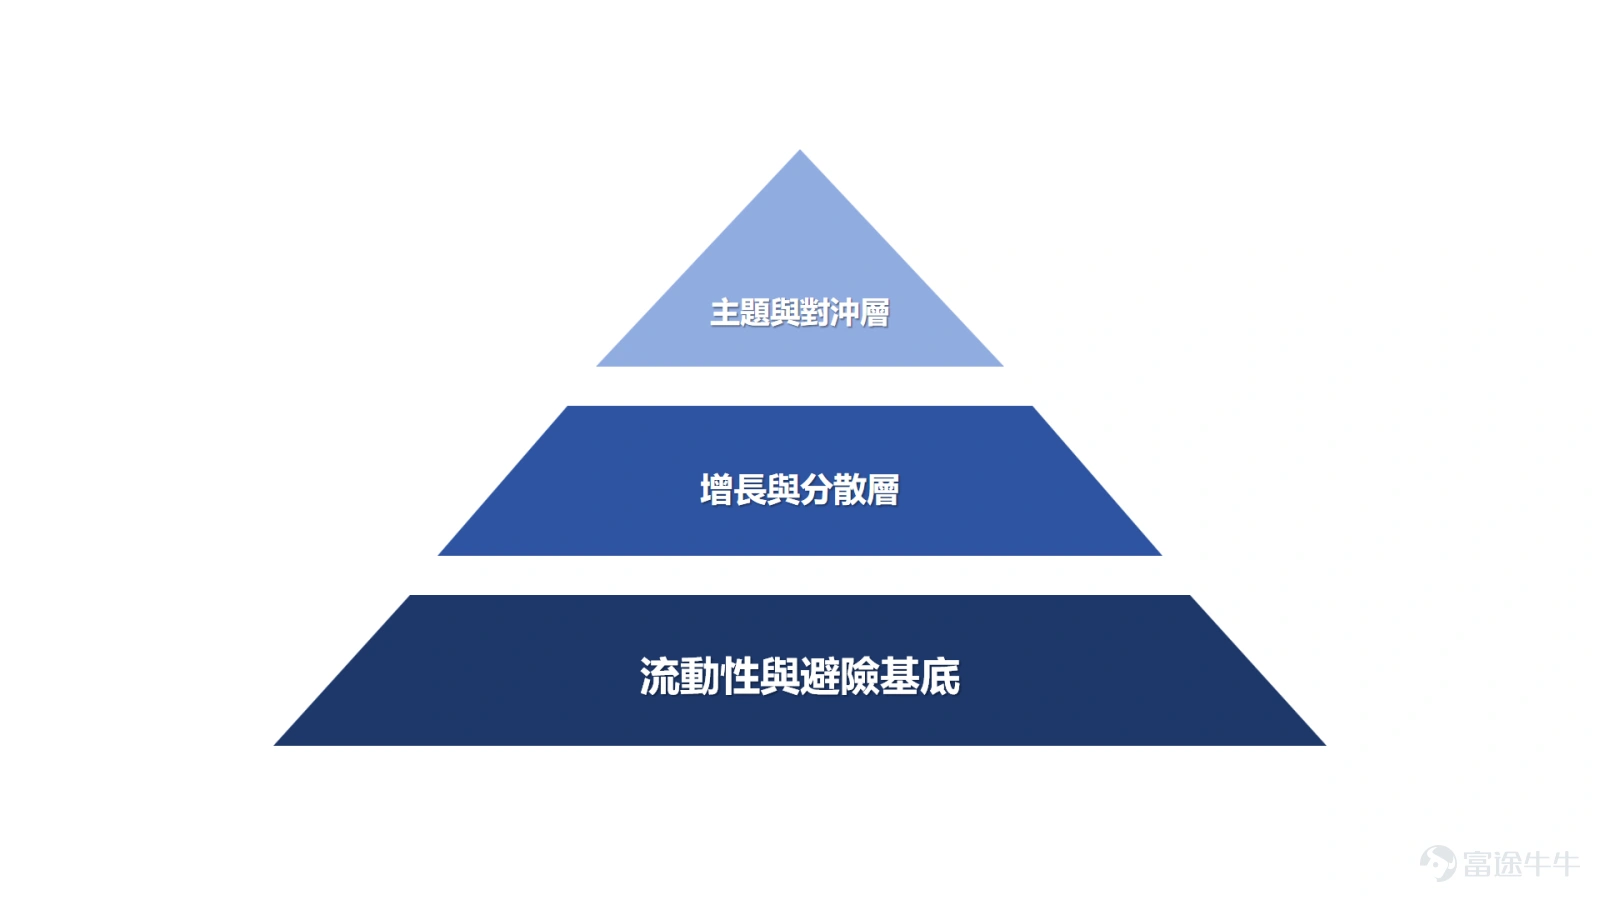
Reviewing the overall structure of the R4 strategy, we can distill a clear three-layer framework: the base layer consists of BIL.P and GLD.P, formingLiquidity and Hedging Base, providing the portfolio with survivability under extreme scenarios;
The middle layer consists of QQQ.O, SMH.O, EWJ.P, EWT.P, and EWZ.P,Growth and Diversification Layer, capturing structural growth opportunities across different economic regimes while maintaining geographic and currency diversification;
The top layer is composed of ICLN.O, DBA.P, and USO.P,Thematic and Hedge Layer, offering the portfolio tail-risk protection and long-term trend exposure with low correlation to traditional assets.
The investment philosophy reflected in this framework, in a sense, transcends conventional asset allocation paradigms. In the global macro context of 2026, investors are no longer facing a simple"risk-on vs. risk-off"It’s not a binary choice, but rather about finding a reliable structural anchor for one’s wealth in a world where geopolitical blocs continuously collide, the monetary system gradually restructures, and energy and technology cycles are deeply intertwined.
The R4 strategy offers this answer: don’t try to predict from which direction the next black swan will emerge; instead, build a system that maintains basic functionality across most plausible scenarios and where different assets take the lead under varying market conditions.
This is not a solution seeking optimality, but a framework pursuing robustness.
In a fractured global order, this straightforward way of thinking may well be the rarest—and most valuable—investment wisdom.
Risk Disclaimer: The above content only represents the author's view. It does not represent any position or investment advice of Futu. Futu makes no representation or warranty.Read more


Comments
to post a comment
9
2