
Micron reports earnings tonight—how strong is the memory 'super cycle'?

Bull Bull Technical Intelligence Unit | Trump Back with Another 'Stock Call': Can Memory Giants Micron and SanDisk Keep Rallying?
US President Trump—dubbed by some investors as the 'Oracle of the White House'—publicly expressed clear praise for $Micron Technology (MU.US)$ during an event on May 22. Looking back, Trump’s history of such public endorsements is well documented. Although Micron’s outlook appears highly positive from multiple angles—including fundamentals, earnings, and its position in the AI memory sector—as rational market participants, we must ultimately rely on actual trading data.
In this edition of the Technical Intelligence Briefing, Niu Niu will provide a detailed analysis of Micron Technology and another leading memory industry giant $SanDisk (SNDK.US)$ regarding their recent price movements.
Micron Technology (MU)

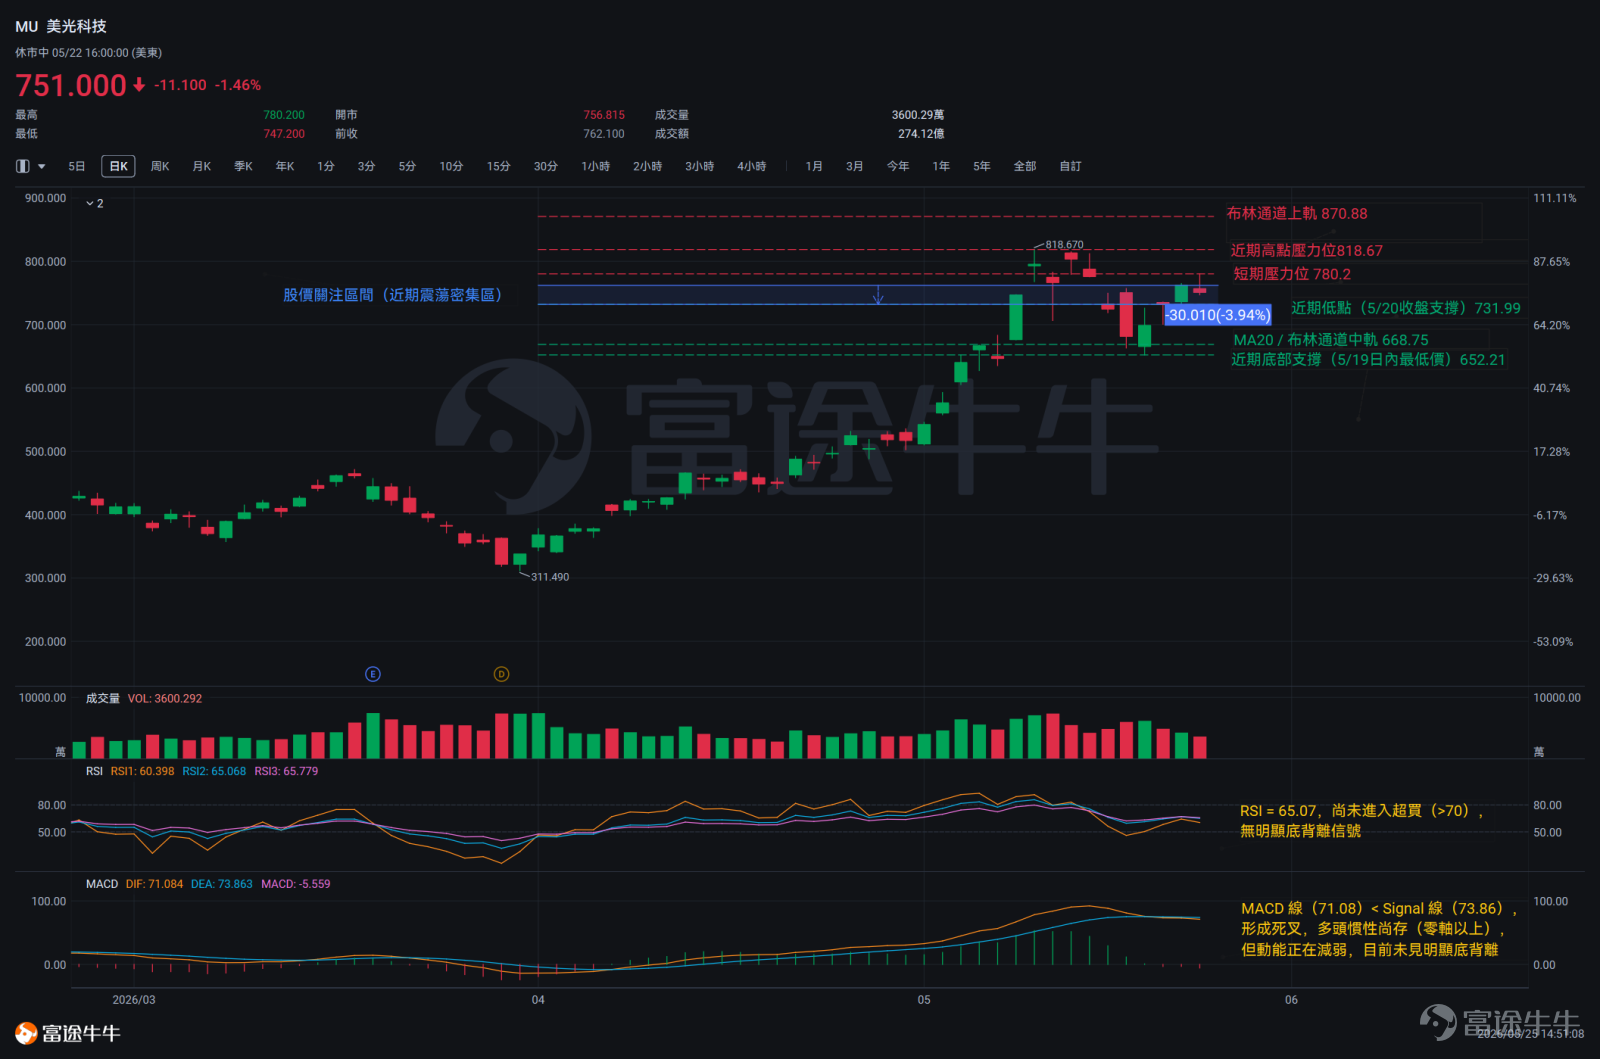
From its high of $818.67 on May 11, Micron embarked on a multi-step decline, accumulating a drop of approximately 14.6%.
This pattern of decline—characterized by modest rebounds repeatedly stifled by fresh selling pressure, consistently establishing lower lows—This is a typical sign of systematic distribution by bears, not a one-off emotional shock.Subsequently, Micron TechnologyAfter hitting a short-term bottom support at USD 652.21 on May 19, it rebounded strongly, showing a bottom-support signal with rapid buying interest entering the market.As of the current analysis, the price has stabilized around USD 751, standing at a critical crossroads in the near-term bullish-bearish battle. From a broader perspective, the stock price remains significantly above the 50-day medium-term moving average (USD 518.97), which continues to slope upward, indicating that the medium-term uptrend remains intact.This implies that the recent pullback is essentially a technical consolidation following a sharp rally, rather than a trend reversal.
Key Technical Indicators Interpretation
Moving Average (MA):The current share price of USD 751 is well above the 50-day moving average (USD 518.97), preserving the medium-term bullish structure. In the short term, close attention should be paid to the direction of the 20-day moving average—if the price decisively breaks below the MA20, the short-term bearish signal will become clearer.
RSI:The current RSI reading is 65.07, not yet entering overbought territory (>70). Recent price action shows that RSI reached or approached overbought levels around the May 11 peak, then declined in tandem with the price pullback. At present, there is no clear bullish divergence, and RSI remains in a neutral-to-high range.
MACD:The MACD line (71.08) is below the Signal line (73.86), forming a bearish crossover, indicating that upward momentum has weakened. If the MACD line continues declining toward the zero axis, the signal for a weakening medium-term trend will strengthen further. No clear bullish divergence is currently visible.
Bollinger Bands:The stock price currently sits midway between the Bollinger Bands’ middle and upper bands. The upper band resistance stands at USD 870.88, while the lower band provides support at USD 668.75. In the rebound from the low of USD 652.21 to USD 762.10, the price has recovered from the lower band area back toward the middle band, but has not yet firmly held above it. Whether the price can sustainably hold above the middle band is key to determining whether this rally is a corrective bounce or a genuine trend reversal. Should the price encounter renewed resistance near the middle band, the risk of a subsequent decline testing the lower band at USD 668.75 cannot be ignored.
Technical Comprehensive Analysis
Micron Technology currently exhibits a 'healthy medium-term trend but short-term weakness under pressure' pattern.The stock price remains within the lower range of the double-top structure and has not yet shown a clear confirmation signal of a trend reversal.Key support levels to watch include: USD 681.54 (previous dense trading support zone); USD 668.75 (lower Bollinger Band, a critical technical floor recently); and USD 652.21 (the May 19 low—if breached, it would confirm the start of a larger-scale correction).
Until the stock price effectively breaks above the USD 818 double-top resistance zone, the current rebound is more likely a technical recovery following an oversold condition.It is important to monitor whether the price can consolidate effectively within the USD 751–762 range and rebuild upward momentum. If repeated consolidation in this zone fails to push the price above USD 776, there is a risk the price could re-enter the downtrend and test lower support levels again.
SanDisk
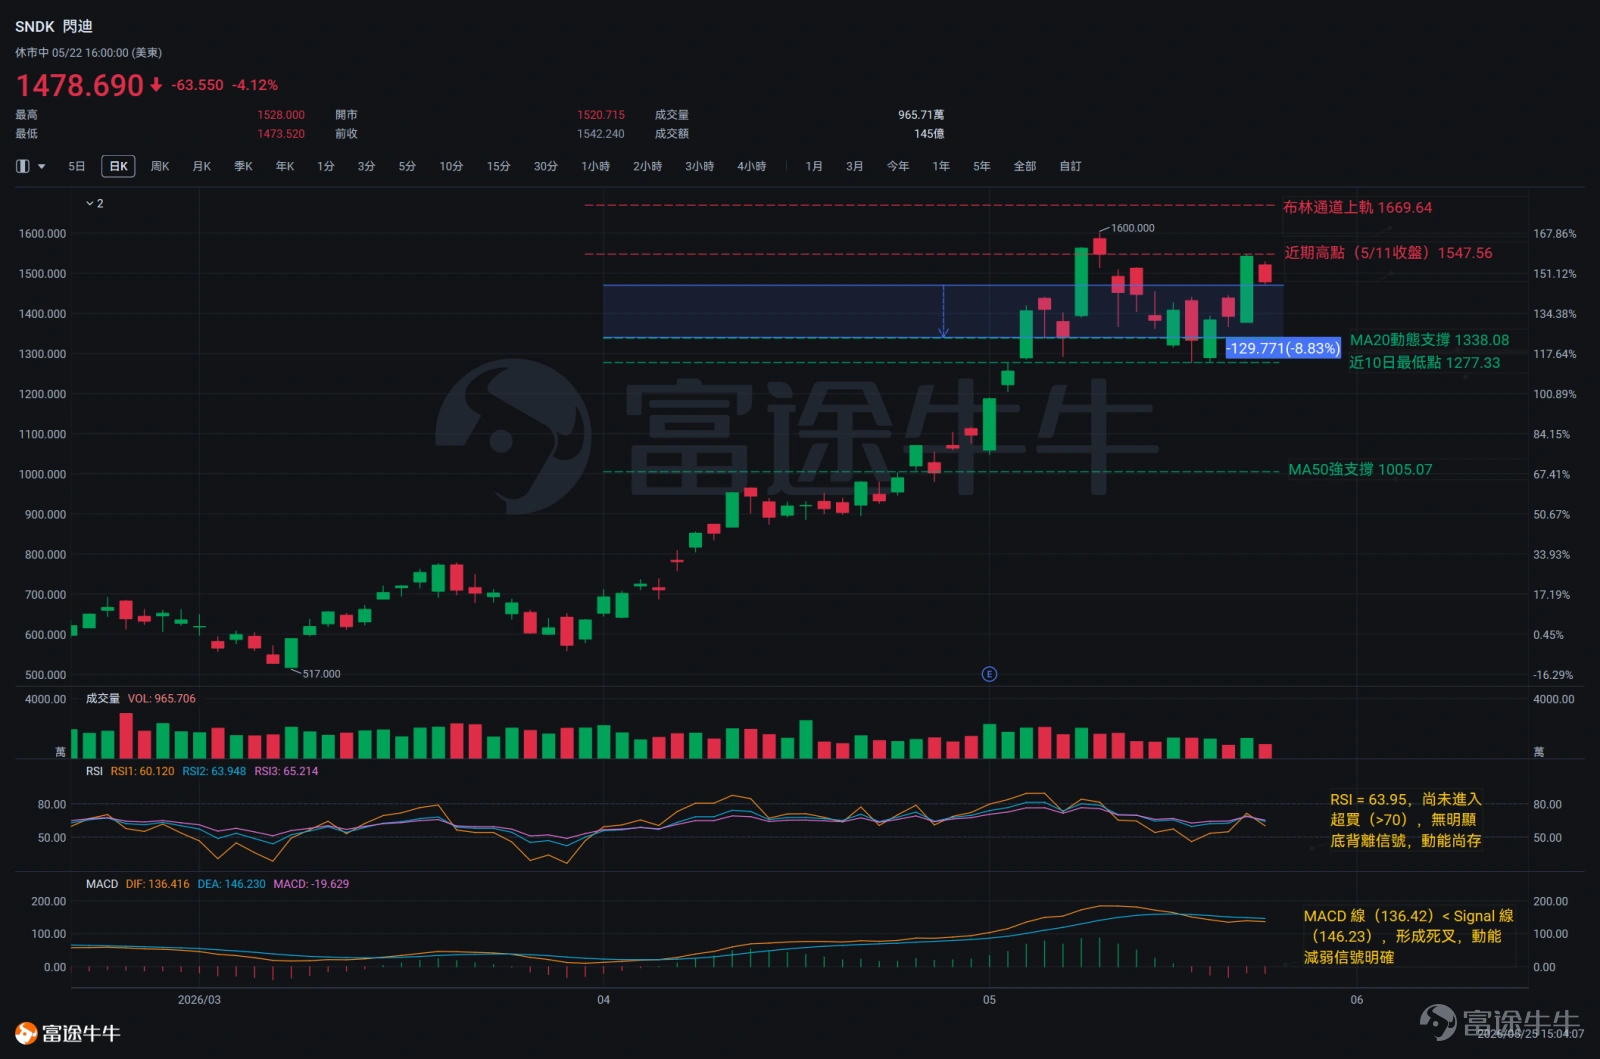
From May 11 to May 14, SanDisk posted four consecutive down days, with its share price declining stepwise from USD 1,547 to USD 1,452, USD 1,447, and USD 1,382—Signs of significant turnover at the top are evident, indicating a temporary weakening of bullish momentum and signaling consolidation at elevated levels.On May 18, a highly volatile bearish candle emerged: opening at USD 1,431.67, dropping as low as USD 1,277.33, and closing at USD 1,333.01, forming extremely long upper and lower shadows.This reflects intense tug-of-war between bulls and bears, with the long lower shadow suggesting underlying support at lower levels.May 21 marked the strongest daily candle recently, with a single-day gain of approximately 12%,representing a strong bullish offensive signal that clearly reversed the prior bearish dominance.SanDisk's current share price is $1,478.69—firmly above both the 20-day moving average (MA20) at $1,338.08 and the 50-day moving average (MA50) at $1,005.07, maintaining a complete bullish alignment.Close attention should be paid to whether the bearish reversal candle on May 22 forms the early structure of a double-top pattern confirmation.
Key Technical Indicators Interpretation
Moving Average (MA):The MA20 stands at $1,338.08 and the MA50 at $1,005.07. The current share price remains significantly above both moving averages, preserving the bullish alignment. However, with the current price ($1,478) approximately 10% above the MA20, there is gravitational pull toward mean reversion. Should the price continue declining in the short term, watch closely whether the key MA20 support level is breached.
RSI:The current reading is 63.95, situated in the neutral-to-high range (30–70). Bullish momentum has not lost its critical threshold, and there are no clear signs of bearish or bullish divergence.
MACD:The MACD line (136.42) is below the Signal line (146.23), forming a bearish crossover, indicating a temporary weakening of bullish momentum. However, the overall indicator remains above the zero line, suggesting the medium-term bullish environment has not yet reversed—it is merely an internal momentum adjustment within the trend.
Bollinger Bands:The current share price of $1,478.69 lies between the middle Bollinger Band ($1,338.08) and the upper band ($1,669.64), reflecting elevated volatility and significant market divergence. The price retreated before reaching the upper band, signaling relatively weak short-term momentum.
Technical Comprehensive Analysis
SanDisk exhibits a 'healthy medium- to long-term outlook with short-term high-level consolidation' pattern overall.The strong bullish candle on May 21 was a significant recovery signal for bulls, but the price failed to hold its high on May 22.Whether the price can effectively break through the dense resistance zone between $1,547 and $1,600 is the key observation point to assess if this rebound has continuation potential.Until the price convincingly breaks through and sustains above the $1,547–$1,600 resistance zone, the current rally should be viewed primarily as range-bound consolidation.
Key intraday price levels to watch include USD 1,338.08 (dynamic support from the 20-day moving average, a zone where the price has tested multiple times over the past two weeks before stabilizing, and a structural pivot between bullish and bearish sentiment; a break below this level would require reassessment of the short-term direction) and USD 1,277.33 (near-term support). Key resistance levels above are USD 1,547.56 (recent high-volume trading zone), USD 1,600 (short-term structural resistance—any breakout must be confirmed by volume and sustained closing above this level), and USD 1,669.64 (upper Bollinger Band).

Here’s some good news for everyone: the new 'AI Custom Indicator' feature has just launched on the NiuNiu desktop platform!
Want your own custom indicator? Now, just give a simple instruction and AI will generate it for you! Plus, you can backtest with one click—no coding required—and instantly see your potential returns. Give it a try today!
Risk Disclaimer: The above content only represents the author's view. It does not represent any position or investment advice of Futu. Futu makes no representation or warranty.Read more


Comments (8)
to post a comment
79
166